CRUDEOIL bagged 36k/lot, further level marked !!MCX:CRUDEOIL1!
#MCX:CRUDEOIL bagged good profits and further levels marked for practice.
Details with results shared in the signature column.
#NATURALGAS , #COPPER also bagged very good results check for details.
Happy LEarning !!
MCX

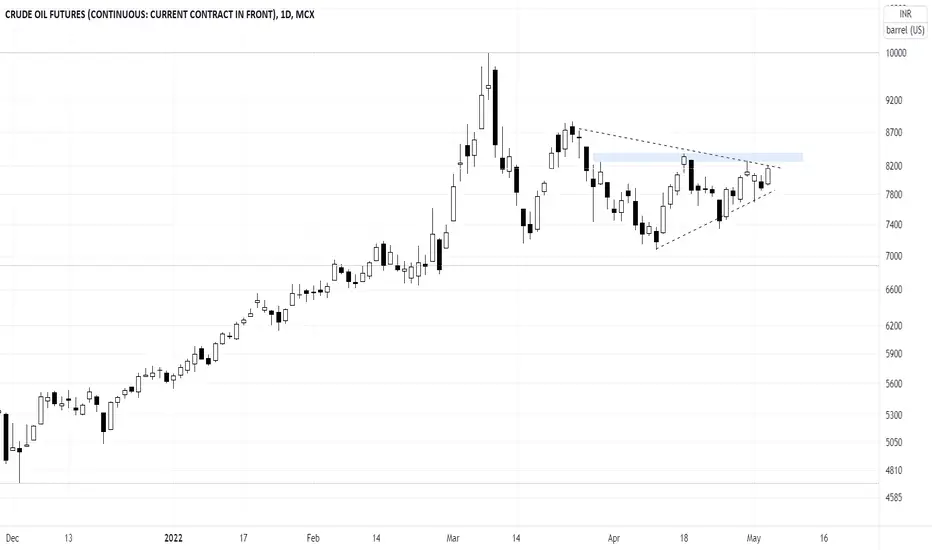
Crude - Symmetrical Triangle Crude is forming a symmetrical triangle. Currently, it is facing a resistance level of 8300 levels but if this level is crossed then we can see a quick move!
Concepts - Symmetrical Triangle ( Pattern Analysis )
Resistance Levels

NIFTY Long Market take support ..This lower blue line is buy zone and Upper blue line is profit zone ..
market oversold..this is my idea ..and yours comment below ..
this is not a tips ..only thought ..


MCX copper crucial trendline level to watch 815--813#MCX #copper till now respected the trend line and given and given move from 790 to 830
now this rising trend line levels comes around 815--813.. if copper breaks down this trend line and levels
than it will move down towards 800----790
till it is respecting trend line no shorting... stay with patience
views are educational

#Silver - Nested H&S inside a larger H&S- hourly chartSilver is forming a nice H&S and nested H&S
IF price breakout of the rectangle at the right shoulder it could go higher

Live Challenging Signal BUY INDIA NIPPON @ 376.20
Signal Specification
Pair: INDIA NIPPON
Entry Type: Buy
Entry1: 376.20
ENTRY2: 210.20
Tp1&2: 592.80
Sl1: 311.50
Sl2:133.05
R/R: 4.97
Our Unique Features:
—————————————————————
1. Follow our 15 signals ….10% equity will increase in your account for sure.
2. We are not Trailing stop! or average the trades.
3. 2% Risk Management Per trade.
4. Risk vs Reward up to 1:7.
Note:
Trade signals would usually have a risk to reward ratio of 1:2.
It means that even 2 out of 4 signals hits their SL marks, the other two would have closed with profit.
This allows you to be good in overall pips profit.
Signals are usually inter-day (Based on the daily candle) therefore, trades would usually have a holding time of an average minimum of 24 hours.
Note: Everything works with Best money management.
Note: Please leave comments for any query.
Disclaimer: This is my trading experience, it is not an invite or recommendation to trade.
Best Wishes
Forex Tamil

#StockMarket #StockIdeas #StocktoWatch #StockToBuy #positionalMCX
Company is almost debt free.
Stock at near its strong resistance zone
If broke then can be seen good move
Buy above 1455 for positional targets of 1560/1500
To Ultimate target of 1650 in next 12months
Keep SL of 1400.
----
Note:
Above levels are for education purposes only
Do your own analysis before taking any trade

MCX gold ... time to rallyMCX gold in falling wedge... and breakout of the wedge will give upside move towards 52000+++
gold doing abc correction and coming out of the wedge will confirm completion of corrective abc wave
views are educational

MCX - Fire in Commodity will continue to heat up stock !!MCX - Fire in Commodity will continue to heat up stock for a year timeframe.
Entry Price - 1400-1440
Stop Loss Below 1200
Target - 2700-3600
Long Term Play - Wild Moves should come one way

short crude @99 or 100Short crude 99 or 100 for target 92.80
now global situations are bearish thats why short ing crude will give benefit ,

MCX copper range contraction within the triangleMCX copper within the triangle and now range is slowly contracting between 790---826
keep eye on breaking of triangle on either side will give clear trend ahead... till than play support and resistance.. 790 & 826
790 is important support level to watch ... as breaking below this level will bring weakness towards 760--750
whereas breaking out of the triangle will give move towards 850---870
views are educational
plan your trades accordingly..
As a trader one should alaways try to take quality trades ... which will bring patience in to you..
profit or loss is the byproduct of your skill..

gold futures monthly chart analysisaccording to harmonic pattern, gold price will hit 55000 in coming months

Crudeoil levels for March 9, 2022Many of the telegram channel were discussing about crude uptrend is changed to sell trend, As per my view until this uptrend channel low not broken it is uptrend only.
If tomorrow gap up or gap down open, it will work as per marked level only.
Disclaimer: Im not tip provider and this chart is not indented to take trade in my levels. It is all your own risk.

Crudeoil levels for March 7 2022If crudeoil open in between this channel it may respect marked level work like buy in dip. Another scenario if open gap down below bottom trendline may change to sell trend forthcoming sessions.
Disclaimer: Im not tip provider and this chart is not indented to take trade in my levels. It is all your own risk.

MCX copper within the downward channelMCX copper withing the channel and brokem imp support 845-840 with strong bearish candle
below this 820--800 possible on downside...
view is valid till it is below 845
views are for educational

MCX:NICKEL 1000+ points achieved !! new target marked !!MCX:NICKEL1!
#MCX:NICKEL1 reached 1000+ points with level 2047 and now trading @ new levels,
Next potential target marked on chart.
Happy LEarning !!

MCX:NICKEL1 Levels marked only for LEarning !!MCX:NICKEL1!
#MCX:NICKEL trading bullish and reached ATH,
Potential level marked on chart only for learning.
Also marked my trade details with entry and stop loss for easy reference.
Sharing live trades for gaining live market experience for beginners, target hit/not Hit doesn’t matter, only the experience matters.
Share your feedback to continue live trades like this, based on your response will share.
You can ping me directly and share your experience.


MCXOnly take position on above 1:5 RR ratio
-----------------------------------------------------
Current Price :1272
Take position at : breakout the triangle setup above 1420
Max Target 45% ROI
Stop loss according your Psychology
RRR 1:9
Time period : 1 year

NATURAL GAS Intraday Levels for 28th Feb 2022These are the Intraday Levels according to my Calculation and Analysis....

CRUDE OIL Intraday levels for 28th Feb 2022Theses are the Intraday Levels according to my Calculation and Analysis....
