CRUDE OIL FOR NOVEMBER 2022Possible Support & Resistance levels for Crude Oil in the month of November,2022,
MCX

Crude Long ( 12 Oct)Crude Long ( 12 Oct)
RSI-46
Buy at CMP- 7315
SL- 7243
Target- 7375, 7412
Join us, Learn more, Earn more
Disclaimer- We are not SEBI registered advisor.
Charts and views are only for educational purpose.

Gold Long ( 12 Oct)Gold Long ( 12 Oct)
RSI-45
Buy above- 50880
SL- 50715
Target- 51060, 51180
Join us, Learn more, Earn more
Disclaimer- We are not SEBI registered advisor.
Charts and views are only for educational purpose.

CRUDEOIL #Watchlist
#CRUDEOIL (5hr Chart):-CMP 7590 looking good for 7800,7900++, Only above 7630/7645 Hourly Closing.
#Disclaimer:-View shared is for educational purposes only.

MCX Natural Gas Head and Shoulder Natural Gas on MCX (INR) making an head and shoulder
Resistance 725
Downside Possible 520-475

Silver ( XAGUSD )My idea to trade silver as sell on rallies As the fundamental on Silver is not improving economic activities are slow . A very important to be taken note of Silver is a industrial utility the demand and supply need to focus on and this has a major impact on the fundamentals of silver . Till the time we are seeing EUR going down and rates keep on increasing this will not make this improving in near future .Ema will be acting as a resistance and if we break above ema then we can see some changes in the trend till the time we are in down trend and will be continued .

MCX- Looks to reverse, holding the levelBuy around 1295- 1275, keep SL 1250 on closing basis.
Target-1330,1360,1390
*Note-Only for educational purpose.

SILVER VIEW silver is sell on rise as there is no change in the fundamentals yet so break above the given resistance line is not seen in near future so we continue to drop in the downward channel also it depends on the behaviour of dollar index and cpi data of usa so upcoming Data can be used as a trigger for change in the fundamentals and can help silver to get above the resistance and shine again Till the time we are experiencing low industrial demand.

Silver Micro HarmonicsI have tried to calculate possible fate of Silver Micro using Harmonics and Elliott Wave Analysis.


Symmetrical Triangle ConsolidationStart accumulating on the lower support line and wait for the breakup.

MCX Ltd - 02.09.2022MCX Ltd - 02.09.2022
The stock is trading @ 1277 levels
The PRICES ARE BELOW EMA
There is a MACD BULLISH DIVERGENCE in Daily Chart
There is a STOCHASTIC BULLISH DIVERGENCE in Daily Chart
There is a RESISTANCE @ 1291 levels
RSI needs a BREAKOUT in Weekly Chart
Watch out for the price action

MCX Natural Gas is high but avoid sell and holdNatural gas futures in MCX and NYMEX is touching new highs day by day and may create temptation for derivative traders to sell and hold by looking at the premium in price. Price may stay higher for quiet some time and may touch 900 in MCX. Fundamental factors and political stress are supporting NG price at this moment. So short term buying is better preferred and selling need a confirmation that will be published here on a later time.

#CRUDEOIL Crudeoil 1hour time frame crudeoil has resistance at 7301-7280 levels if sustain this levels we can see can oil can fall till 7080 level just for educational purpose only

AS RIGHTLY SAID BUY THE DIP AND STOCK TO CREATE WEALTH.As updated in the charts we still expect continued downfall in oil before it further shoots up for a new life time high TVC:USOIL .
It’s the right time to stock oil . we recommend buying in it from 86 levels with a stop loss of 64 .
Thank you so much .

Silver Short (01 Aug)Silver Short (01 Aug)
RSI- 43
RSI divergence
Sell at CMP- 58340
SL- 58570
Target- 58060, 57712
Join us, Learn more, Earn more
Disclaimer- We are not SEBI registered advisor.
Charts and views are only for educational purpose.

IS IT SMART TO ADD SILVER IN THE PORTFOLIO AT CURRENT LEVELS ?MCX:SILVER1! NO FAVOURABLE CHART PATTERNS, NO TECHNICAL SIGNS OF REVERSAL.
Can a contra bet of long positions be initiated at current levels ?
Well, the retail investors looking for diversification of their portfolio's, have a great opportunity to add silver futures. The risk reward ratio is favourable at current rates plus there is a high chance of bounce back and short covering at the expiry.
But again,
One cannot predict the downfall from the current levels as there are no indications in the chart patterns. Just a blind trade.
The idea shared is for educational purpose only.
Crude Long (26 July)Crude Long (26 July)
RSI- 71
Pole and flag
Buy at CMP- 7865 or around 7845
SL- 7811
Target- 7923, 7970
Join us, Learn more, Earn more
Disclaimer- We are not SEBI registered advisor.
Charts and views are only for educational purpose.

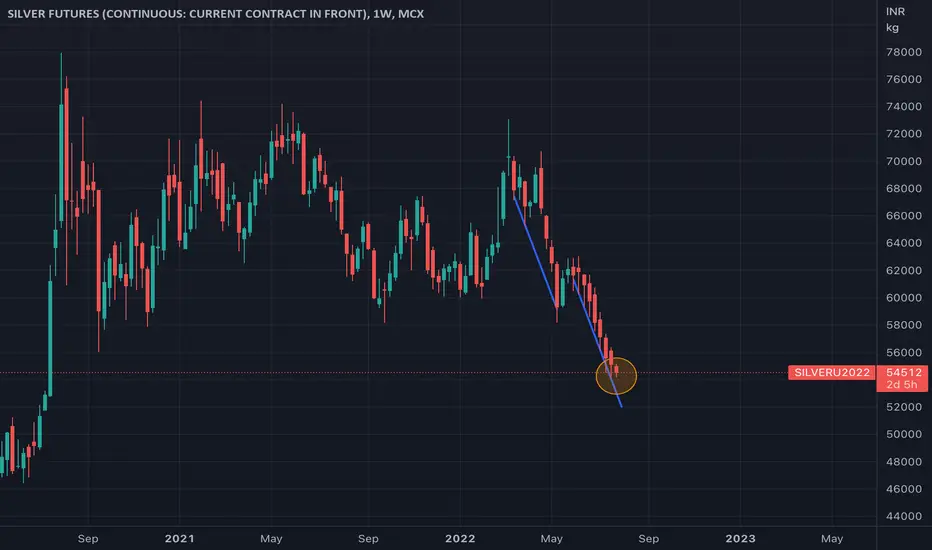
Silver Long (26 July)Silver Long (26 July)
RSI- 41
Buy at CMP- 54520
SL- 54350
Target- 54710, 55010
Join us, Learn more, Earn more
Disclaimer- We are not SEBI registered advisor.
Charts and views are only for educational purpose.

Multi Commodity Exchange of India Ltd - 20.07.2022MCX Ltd - 20.07.2022
The stock is trading @ 1388 levels
There is a STRONG RESISTANCE @ 1399 levels
Let the prices go above 1414 and sustain the same in weekly close
The prices are above EMA
Watch out for the price action

Short ZincAs per the daily chart Zinc has created H&S pattern. This gives us a good shorting opportunity.

Big Fall in CrudeOilThe markets are falling down because of increased fear of recession. Recession affects everything, be it stocks or commodities like CRUDEOIL, NATURALGAS, SILVER, GOLD etc.
Energy sector fell drastically yesterday. Crude Oil fell about 11% whereas Natural Gas fell about 6%.
Crude Oil has a strong supply zone around 9300 according to the monthly timeframe from where it fell down.
In last month it tried to break the supply zone but it failed. It is clearly visible on weekly timeframe that it couldn't break the supply zone.
On the Daily timeframe we can see the formation of Head and Shoulder pattern from which it has broken down the neckline yesterday. Right shoulder was made from the strong resistance at 8850 from where it got rejected twice.
It is also forming a downward moving channel.
On 4 hour timeframe it has broken down the support with good amount of volume.
Today it is moving in lower part of the channel and I think the closing of the candle will be below 8100.
The MACD and RSI have turned bearish on multiple time frames. If the price of USOIL sustains below $100, we can see further down move in the coming weeks or months.
Disclaimer: This post is meant for learning purposes only. Invest your capital at your own risk.
