My BTC 2023 scenario 48K or 60-62K? Hi dear community and my loyal followers, I hope you are fine.
I'm looking at weekly log chart of BTC.
As you noticed from my previous analyses I compared 2022-2023 with 2015-2016 and not with 2019-2020 coz they are very identical. Taking into account this similarities I nailed any single move from the bottom of 2022/15.5K/ to the current moment /30K/.
As you see Based on my measurement and similar move I don't expect BTC to dump below 25K instead of it I expect pump to 35-37K maybe a little bit higher/37-38K/ filling weekly FVG zone and reached the same % pump as BTC did in 2015, after that we'll see dump to 20-22K filling daily GAP on BTC futures. Then we'll see see huge bounce towards 48K if we count 30% from the top and 60-62K if we count from the last swing high 37-38K to the top as it is shown in 2015. The worst case I expect 48K in 2023. When BTC reaches 48K or 60-62K we should see deep correction to 25-28K in case that BTC new ATH will be hit in 2024-2025.
If you like my analayses don't forget to check below analyses, like, comment, follow and share please. I will appreciate any kind of support. Have a good day, I wish you good trades and big profits.
Megaphone

ADANGREEN | RSI + Channel breakout - Potential for 30-35%ADANGREEN | RSI + Channel breakout - Potential for 30-35%
CMP : 1226 (Dip : 1150)
SL : 1100
Target : 1600
Almost 1:5 risk reward setup

SCHNEIDER | Trendline breakout - Potential for 30%SCHNEIDER | Trendline breakout - Potential for 30% (Technically people call this as "Megaphone chart setup)
CMP : 126 (Dip : 120)
SL : 110
Target : 160
1:5+ risk reward setup.

Megaphone Pattern in HavellsMegaphone Pattern in Havells is formed on a daily chart. This pattern is very rare to be identified, and arrows are self explanatory. Also watch video for a generic idea on how this pattern can be understood.


Mega Phone Chart Pattern Breakout* Breakout from Mega Phone chart pattern with high volume. Chart pattern details available in below attached link .
ALong

CADILAHC | Megaphone pattern is a pattern which consists of minimum two higher highs and two lower lows. The pattern is generally formed when the market is highly volatile in nature and traders are not confident about the market direction. Normally this pattern is visible when the market is at its top or bottom. The greater the time frame is better the pattern will work. However, traders love this pattern when it is formed in a daily or weekly time frame
CEducation

Bullish Megaphone Pattern Breakout*Bullish Megaphone Pattern Breakout in BLUE STAR LIMITED .
*How to made and trade this pattern all details are available below attached link .
* Near breakout of megaphone chart pattern also made a inverted H & S pattern that shows the strength of this pattern.
Kindly Let us Know if you have any Questions.
Thank You

Bullish Megaphone Pattern *Bullish Megaphone Pattern Breakout in Brigade enterprises .
*How to made and trade this pattern all details are available below attached link .
Kindly Let us Know if you have any Questions.
Thank You

MegaPhone PatternWhat is Megaphone Pattern?
Megaphone pattern is a pattern which consists of minimum two higher highs and two lower lows. The pattern is generally formed when the market is highly volatile in nature and traders are not confident about the market direction. Normally this pattern is visible when the market is at its top or bottom. The greater the time frame is better the pattern will work. However, traders love this pattern when it is formed in a daily or weekly time frame.
Key Points :-
* Megaphone pattern is a pattern that consists of minimum of higher highs and two lower lows.
*The pattern is generally formed when the market is highly volatile in nature and traders are not confident about the market direction.
*Megaphone pattern is known to give multiple trading opportunities to the trader.
*This pattern also can be traded when it fails but is necessary to identify the failure perfectly.
*Sometimes only pattern is not enough to take best trading decisions you may need multiple indicators to identify better entry and exit
points.
How to identify the Megaphone pattern ??
* Generally, Megaphone Pattern consists 5 different swings. But the swing has to have minimum two higher highs and two lower lows. A trend line is drawn by connecting point 1 and point 3 while point 2 and 4 are also joined together to draw a line.
These two lines create a shape which looks like a megaphone or inverted symmetric triangle.
Below are a few characteristics of Megaphone trading pattern:
*Volume plays an important role when it comes to the recognition of this pattern.
*In the Megaphone Top, volume usually peaks along with prices.
*An increase in the volume, on the day of the pattern confirmation is a strong indicator.
Theoretical ways to trade the Megaphone pattern:
Megaphone pattern is known to give multiple trading opportunities to the trader.
A trader can trade Megaphone pattern as
Breakout Trades
Swings trades (while making higher highs and lower lows)
When the Price fails to give a breakout.
Breakout Trades:
When the price breaks the trend line after making the 5th swings and closes outside the pattern boundary, a breakout is confirmed. Breakout may happen in positive or in a negative direction. Depending upon the market condition and the position of the pattern in the chart, bullish and bearish breakout happens.
After a prolonged bull run, when this pattern is formed at the top and the price closes below its lower trend line, then it acts as a trend reversal pattern.
But, if the price closes above the higher trend line and makes new higher highs in the chart then it will be termed as a Continuation Pattern. Traders can take a trade when price closes outside the pattern boundary (in whichever direction) to get the best possible confirmation of the breakout.
For educational Purpose Mega phone Pattern Under construction stocks are below-
* V Guard Industries
*Solar Industries Limited.
*Blue Star Limited.
*Rattan India .
Kindly Let us Know if you have any Questions.
Thank You

Fedral Bank hourly chart . ascending megaphone breakout.As shown in the chart, price closed above the resistance line of the ascending megaphone. Typically, this pattern gives downward breakout but in this bull run, it gave upward breakout. No matter, weather it is regular breakout or failure of pattern ...... close above breakout is there. target is near the magic figure Rs 100.


A possibile Sharp Fall!! - Bearish Butterfly & Broadening WedgeExpecting TVC:USOIL to go for a sharp correction.
Harmonics 4-point & 5-point pattern helped identify a Potential Trend Reversal Zone, where bullish movement may end & trend may reverse.
Got a terminal candle confirmation in the PRZ.
Also, in a broader view prices formed a Broadening Wedge Pattern (a-b-c-d-e wave structure) which might possibly be a B-wave in an A-B-C Correction Wave pattern.


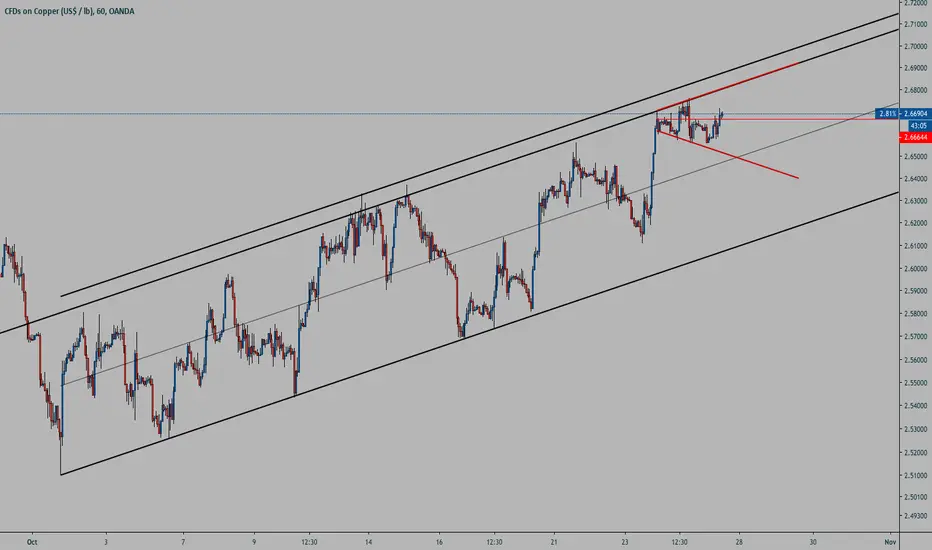
Copper hourly chart analysis - Channel and megaphoneCopper hourly chart analysis - Channel and megaphone
CEATLTD megaphone bottom on hourly chartCEATLTD megaphone bottom on hourly chart
Short below 1140 OR buy after a close above the megaphone top.


Broadening Top (Megaphone) Pattern BreakoutThe stock has nicely formed Broadening Top (Megaphone) Pattern and gave the breakout today. It has also broken the medium term resistance of 1274. Although it is trading above another resistance of 1330 but still a threat on the onward journey. One can use the setup to go long by providing a SL of 1310 on closing basis.
Disclaimer : All stock recommendations and comments are my personnel view please take financial consultancy for trading decision.

GOLD Megaphone top setupGold (XAUUSD) has formed a megaphone top on hourly chart. We will take decision based on the price action which is going to unfold.
Keep watching this space for more updates of targets and SL

Bajaj Finace Long : Broadening FormationThe stock is in uptrend so one should follow the trend until it changes and try to enter long at appropriate level. The stock has formed a Broadening Formations and yesterday's Green bar and today's trading above it are indicating a potential long at this level. Stop Loss closing below the lower line.

PFC Megaphone Short would the History Repeat?The Price movement is forming Broadening Formations(Megaphone) Right-Angled and Ascending . Last time it has retested the level within 7 Bar and moved down till the other end. Interestingly it is forming the similar move again Let's see if history repeats. Anyway the pattern is picture perfect, Stop Loss is affordable and Risk to Reward is attractive what else should we look while framing the trade. My only Concern is Budget Day volatility.

Classical Chart Pattern Short PFCThe pattern is self explanatory one can short now with small stop loss and take the ride till the lower level or whenever feels it is good profit. Risk to reward could be good.
