Everyone Asking Why $PIPPIN Did a 30x in a Few Days Is Already LEveryone Asking Why CRYPTOCAP:PIPPIN Did a 30x in a Few Days Is Already Late (Read Before You Trade)
CRYPTOCAP:PIPPIN did not rally 30x because of innovation.
It rallied because market structure allowed it to.
No presale.
No venture capital.
No team allocation.
From Pump.fun to $300M+ market cap in days.
Here is the reality 👇
1️⃣ Separate narrative from mechanics
Markets do not move on stories.
They move on liquidity, positioning, and leverage.
CRYPTOCAP:PIPPIN ’s move was structural, not fundamental.
Anyone telling you otherwise is selling a narrative.
2️⃣ Launch mechanics defined tradability
CRYPTOCAP:PIPPIN launched on Pump.fun via a fair-launch bonding curve.
🔹 No private allocations
🔹 No insider inventory
🔹 Uniform market access
This removed early insider dumping,
It did not remove downside risk.
3️⃣ Tokenomics were neutral, not bullish
▪️ 1B fixed supply
▪️ 100% circulating
▪️ No future unlocks
▪️ No inflation
Clean structure reduces uncertainty.
It does not create demand.
Demand came from positioning, not supply math.
4️⃣ AI credibility acted as a filter, not a driver
Association with BabyAGI’s creator improved narrative quality.
It did not justify valuation.
It lowered skepticism.
Narratives don’t need depth,
They need acceptance and distribution.
5️⃣ Pre-breakout behavior followed a known pattern
Before expansion, we observed:
🔸 Tight consolidation
🔸 Low public attention
🔸 Increasing large-wallet activity
This is where asymmetric risk is formed.
Retail reacts later.
6️⃣ Expansion phase was mechanical
Once volume accelerated:
🔹 Leverage increased
🔹 Shorts were liquidated
🔹 Exchanges amplified liquidity
🔹 Momentum systems engaged
From this point, price discovery becomes reflexive.
7️⃣ Risk concentration is non-trivial
On-chain data indicates significant supply concentration.
A small group of wallets controls a meaningful share of float.
This introduces binary risk:
🔹 Support continuation
🔹 Or rapid distribution
Liquidity disappears faster than it appears.
8️⃣ This asset class demands precision
CRYPTOCAP:PIPPIN is best described as:
👉 A high-beta momentum instrument
👉 A narrative-driven liquidity event
It is not:
❌ A long-term investment vehicle
❌ A fundamentals-based AI allocation
❌ Capital-preservation oriented
Volatility is a feature, not a flaw.
9️⃣ Where participants fail
Most losses occur when traders confuse:
🔹 Narrative with valuation
🔹 Momentum with durability
🔹 Fair launch with safety
Markets punish conceptual errors quickly.
1️⃣0️⃣ Final assessment
CRYPTOCAP:PIPPIN is not a forecast.
It is a case study in modern crypto market behavior.
Success in this market comes from understanding:
👉 Structure
👉 Liquidity
👉 Timing
👉 Risk
Not belief.
This is a high-risk memecoin environment.
Position sizing and discipline are mandatory.
Follow for institutional-grade crypto analysis.
NFA & DYOR
MEME

Trading Strategies for MEME Stocks1. Understanding MEME Stocks
Before developing strategies, it’s essential to define what MEME stocks are:
Definition: MEME stocks are shares that gain popularity primarily through social media hype rather than traditional financial metrics. Examples include GameStop (GME), AMC Entertainment (AMC), and others.
Volatility: They are extremely volatile, often moving 20–50% in a single day based on social sentiment rather than earnings reports.
Market Influences: Retail investor activity, viral posts, and short squeezes heavily influence price movements.
Understanding these characteristics is the foundation for building effective trading strategies.
2. Core Principles of Trading MEME Stocks
Trading MEME stocks requires a different mindset than traditional investing. The following principles are critical:
Momentum Focus: MEME stocks move quickly, often with no correlation to fundamentals. Traders need to follow momentum rather than intrinsic value.
Sentiment Analysis: Monitoring social media trends, forum discussions, and news can provide insights into potential surges.
Risk Management: High volatility demands strict stop-loss levels to avoid catastrophic losses.
Quick Decision-Making: Entry and exit decisions must be executed rapidly as price swings can be extreme within hours.
These principles will guide strategy development.
3. Momentum Trading Strategy
Momentum trading is one of the most effective approaches for MEME stocks.
Steps:
Identify Trending Stocks: Use screeners or social platforms to identify stocks with surging discussions and trading volume.
Confirm Volume: High trading volume validates momentum. Sudden spikes in volume often precede price surges.
Technical Entry Points: Enter trades on breakouts above resistance levels or strong bullish candlestick patterns.
Exit Strategy: Exit on signs of weakening momentum or reversal patterns. Trailing stop-loss orders can protect profits while allowing for upside continuation.
Advantages:
Captures large price swings.
Utilizes short-term opportunities effectively.
Risks:
False breakouts can result in rapid losses.
Requires constant monitoring of market sentiment.
4. Social Media Sentiment Analysis
MEME stocks are uniquely sensitive to online sentiment. Traders can leverage this through:
Reddit Monitoring: Subreddits like WallStreetBets provide early signals of potential surges.
Twitter and Discord: Influential accounts and trending discussions can influence retail trading behavior.
News Aggregators: Platforms like Finviz or Stocktwits track viral news and chatter.
Implementation:
Track keywords and hashtags related to the stock.
Look for sudden spikes in mentions or engagement metrics.
Cross-reference sentiment with trading volume for confirmation.
Benefit:
Sentiment analysis allows traders to anticipate moves before they materialize in price charts, giving a first-mover advantage.
5. Short Squeeze Strategy
Short squeezes are a common driver of MEME stock rallies.
Understanding Short Squeezes:
A short squeeze occurs when heavily shorted stocks experience sudden buying pressure.
Short sellers are forced to cover positions, driving prices higher rapidly.
Strategy Steps:
Identify Heavily Shorted Stocks: Use short interest ratios and data from platforms like FINRA.
Monitor Trigger Events: Positive news, social media hype, or momentum indicators can trigger a squeeze.
Entry Point: Enter during early signs of short covering, often indicated by rising volume and sudden price jumps.
Exit Point: Take profits as soon as momentum shows signs of fading or when price becomes unsustainably high.
Advantages:
Can generate rapid gains in short periods.
High potential ROI if timed correctly.
Risks:
Extremely volatile; timing is critical.
Losses can be significant if squeeze fails.
6. Technical Analysis for MEME Stocks
While fundamentals may take a backseat, technical analysis is crucial for MEME trading.
Key Tools:
Support and Resistance Levels: Identify critical price levels for entry and exit.
Moving Averages: Short-term moving averages (e.g., 5-day, 20-day) help identify momentum trends.
Relative Strength Index (RSI): Helps spot overbought or oversold conditions, useful in predicting reversals.
Candlestick Patterns: Patterns like bullish engulfing, hammers, or doji can signal potential reversals or continuation.
Best Practices:
Combine multiple indicators for confirmation.
Focus on intraday and short-term charts (1-min, 5-min, 15-min) for trade timing.
Avoid relying solely on a single technical signal due to high volatility.
7. Risk Management Strategies
Risk management is arguably the most critical aspect of MEME stock trading.
Techniques:
Position Sizing: Never allocate more than a small percentage of capital to a single trade (e.g., 1–5%).
Stop-Loss Orders: Protect against sharp reversals by placing stop-loss orders slightly below support levels.
Take-Profit Levels: Predefine exit points to lock in gains amid rapid volatility.
Diversification: Spread investments across multiple MEME stocks to reduce exposure to a single trend.
Psychology:
Emotional discipline is key. MEME stocks can be highly addictive due to rapid gains.
Avoid chasing price spikes; stick to pre-defined trade plans.
8. Swing Trading Strategy
Swing trading is suitable for traders looking to hold MEME stocks for several days or weeks.
Steps:
Identify Trend: Use daily or weekly charts to find uptrending MEME stocks.
Entry Point: Buy during temporary pullbacks in an overall uptrend.
Exit Point: Sell near resistance levels or when technical indicators show momentum fading.
Monitoring: Keep track of news, social sentiment, and earnings reports as catalysts for continued momentum.
Benefits:
Captures larger trends than intraday trades.
Less stressful than constant intraday monitoring.
Risks:
Overnight gaps can result in unexpected losses.
Requires patience and confidence in trend continuation.
9. Scalping Strategy
For highly active traders, scalping offers opportunities to profit from intraday volatility.
Methodology:
Use Short Timeframes: Focus on 1-minute or 5-minute charts.
Frequent Trades: Execute multiple small trades targeting minor price fluctuations.
Technical Indicators: Leverage moving averages, Bollinger Bands, and volume indicators.
Quick Exit: Close positions as soon as targets are met, avoiding large drawdowns.
Advantages:
Takes advantage of rapid price movements typical in MEME stocks.
Reduces exposure to overnight risk.
Risks:
Demands full attention and fast execution.
High transaction costs may eat into profits.
10. Psychological and Behavioral Considerations
Trading MEME stocks is as much a psychological game as a technical one.
Herd Mentality: Many traders follow the crowd, creating self-fulfilling price spikes.
Fear of Missing Out (FOMO): Can lead to impulsive entries at peak prices.
Patience and Discipline: Successful traders avoid emotional decision-making and stick to predefined strategies.
Avoiding Overexposure: MEME stocks can dominate media headlines, but not all hype translates into sustainable profits.
Understanding these behavioral aspects is crucial for surviving the extreme volatility inherent in MEME stocks.
11. Tools and Platforms for MEME Stock Trading
Traders can leverage various tools to improve their decision-making:
Trading Platforms: Robinhood, Webull, Zerodha, and Interactive Brokers offer easy access to MEME stocks.
Screeners: Tools like Finviz, TradingView, and Yahoo Finance help identify trending stocks.
Social Media Analytics: Platforms like Stocktwits, Reddit tracking tools, and Twitter analytics assist in sentiment monitoring.
Technical Indicators: TradingView and MetaTrader allow charting with customizable indicators for intraday and swing trading strategies.
12. Common Mistakes to Avoid
Ignoring Risk Management: Overleveraging can lead to catastrophic losses.
Chasing Hype: Entering trades at peak prices often results in losses when momentum fades.
Neglecting Exit Strategy: MEME stocks can reverse quickly; predefined exit points are essential.
Overtrading: Excessive trading increases costs and emotional stress.
Avoiding these pitfalls can improve long-term success.
13. Conclusion
Trading MEME stocks is an exhilarating but highly risky endeavor. Unlike traditional investing, it relies heavily on momentum, social sentiment, and short-term price action rather than fundamental valuation. Successful MEME traders combine multiple strategies:
Momentum and swing trading for capturing trends.
Sentiment analysis to anticipate moves.
Short squeeze exploitation for rapid gains.
Strict risk management to safeguard capital.
Additionally, psychological discipline and adherence to predefined trading rules are critical. While MEME stocks can generate extraordinary returns, they demand careful planning, continuous monitoring, and a clear understanding of the volatile forces at play. By applying these strategies thoughtfully, traders can navigate the exciting world of MEME stocks while mitigating the risks inherent in this unconventional market segment.
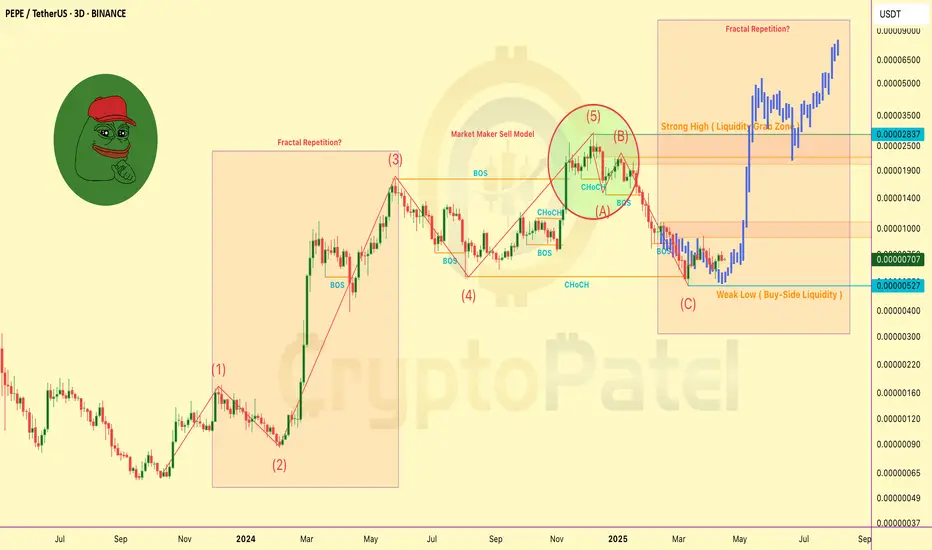
PEPE/USDT – 3D Chart Technical Breakdown (April 2025)PEPE/USDT – 3D Chart Technical Breakdown (April 2025)
Based on SMC, ICT, Elliott Wave, and Fractal Analysis
Major Structure Insights:
▪️ PEPE completed a 5-wave Elliott impulsive rally followed by an ABC corrective wave.
▪️ Wave C swept the buy-side liquidity near 0.00000527, triggering potential reversal.
▪️ Recent CHoCH and BOS suggest a trend shift back to bullish.
Fractal Repetition Detected!
▪️ Previous bullish pattern is repeating – similar structure and accumulation signs.
▪️ Market Maker Sell Model played out perfectly at the top before correction began.
Key Liquidity Zones:
🔵 Weak Low: 0.00000527 (swept)
🟠 Strong High: 0.00002837 (targeted)
▪️ Intermediate Levels: 0.00001000, 0.00001900, 0.00002837
▪️ Final Expansion Projection: 0.000065–0.000090
Smart Money Concepts Confirmed:
▪️ Liquidity engineered and swept at lows
▪️ Institutional entry signs after BOS
▪️ Fractal structure supports a bullish continuation phase
Outlook:
If structure holds and price continues above 0.00000600, next leg toward 0.000019–0.00002837 could be explosive.
Below 0.00000500 = Invalidation zone.
Note: This is a technical viewpoint for educational purposes.
DYOR – Not Financial Advice.
PROS/USDT 300% Potential as per chart analysis#PROS/USDT Chart Analysis
🔹 Support Level: PROS is holding strong above the $0.60 support level.
🔹 Potential Upside: If $0.60 support holds, targets of $2-$3 are possible in the coming days.
Risk-Reward Ratio:
Risk: ~20% (if it goes below $0.60).
Reward: 200%-300% potential gains.
Pro Tip: Always consider your risk-reward ratio and follow strict risk management.

FLOKIUSDT Long SetupFLOKIUSDT Trade Setup
Entry: 0.00014801
SL: 0.00014449
TP: 0.00016932
RR: 4.92
Not a financial advice.
Trade at your own risk.

MEMEUSDT: Cup & Handle Pattern Could Signal Major Reversal!Yello Paradisers! Are you ready for a potential breakout that could send MEMEUSDT soaring? Let's dive into the latest technical analysis and see what's brewing.
💎MEMEUSDT has recently broken out of a descending channel and is currently showing consolidation. This consolidation is forming a classic cup and handle pattern, which typically increases the probability of a reversal.
💎However, to confirm this bullish move, we need to see a breakout and candle closing above the resistance zone. This would significantly enhance the likelihood of a strong upward move.
💎On the other hand, if a pullback occurs, we might see a potential double bottom forming at the support zone. For confirmation of this bullish structure, we need to observe an I-CHoCH (Internal Change of Character) indicating a shift towards a bullish market structure. This would further increase the probability in our favor.
💎But caution is key! If MEMEUSDT breaks down and closes candle below the support zone, it will invalidate our bullish scenario.
🎖 Remember, patience and discipline are crucial in trading. Stay focused and make strategic decisions. This is the only way you can achieve long-term success in your crypto trading journey.
MyCryptoParadise
iFeel the success🌴

RATS LONG SETUPRATS (1000RATS) is trying to recover from huge loss, currently trying for 0.18 range, so long setup would be great for upcoming days.

#Bitcoin Big Fight: Bulls vs. Bears ( Fresh Update )#Bitcoin Big Fight: Bulls vs. Bears ( Fresh Update )
Hey everyone! Right now, Bitcoin is at $66,233
Key Points:
Big Move Alert: If Bitcoin jumps over $70,500, we might just see it hit $100,000 super fast.
Bulls' Hope: Watch out for $62,500. If we stay above this, the bulls have a chance to keep the party going.
Bears' Target: If we fall under $62,500, we could be heading down to $50,000.
Important Levels:
Support (Bulls' Floor): $62,500
Resistance (Wall to Break): $71,000

SHIB MEME RESTING SHIB: Meme Token Breakout Potential
The popular meme token SHIB has seen a significant spike in interest over the past 10 days, with its price rallying alongside the increased attention. Currently, SHIB is resting on the 10MA, which could act as a support level and bounce off.
Technical Analysis:
- The recent price action has formed a bullish flag pattern, which is a continuation pattern that typically signals a potential breakout in the direction of the previous trend.
- Trading volumes have decreased significantly after the initial spike.
Risks:
- SHIB is a highly volatile meme token, and its price movements can be unpredictable and influenced by social media trends.

REEFUSDT 🚀🚀REEFUSDT LONG
Lev 3-7X
Entry 0.1570-0.1554
Targets- 0.1593 (book 50% and move sl to second entry point) 0.1670 50%

