Everyone Asking Why $PIPPIN Did a 30x in a Few Days Is Already LEveryone Asking Why CRYPTOCAP:PIPPIN Did a 30x in a Few Days Is Already Late (Read Before You Trade)
CRYPTOCAP:PIPPIN did not rally 30x because of innovation.
It rallied because market structure allowed it to.
No presale.
No venture capital.
No team allocation.
From Pump.fun to $300M+ market cap in days.
Here is the reality 👇
1️⃣ Separate narrative from mechanics
Markets do not move on stories.
They move on liquidity, positioning, and leverage.
CRYPTOCAP:PIPPIN ’s move was structural, not fundamental.
Anyone telling you otherwise is selling a narrative.
2️⃣ Launch mechanics defined tradability
CRYPTOCAP:PIPPIN launched on Pump.fun via a fair-launch bonding curve.
🔹 No private allocations
🔹 No insider inventory
🔹 Uniform market access
This removed early insider dumping,
It did not remove downside risk.
3️⃣ Tokenomics were neutral, not bullish
▪️ 1B fixed supply
▪️ 100% circulating
▪️ No future unlocks
▪️ No inflation
Clean structure reduces uncertainty.
It does not create demand.
Demand came from positioning, not supply math.
4️⃣ AI credibility acted as a filter, not a driver
Association with BabyAGI’s creator improved narrative quality.
It did not justify valuation.
It lowered skepticism.
Narratives don’t need depth,
They need acceptance and distribution.
5️⃣ Pre-breakout behavior followed a known pattern
Before expansion, we observed:
🔸 Tight consolidation
🔸 Low public attention
🔸 Increasing large-wallet activity
This is where asymmetric risk is formed.
Retail reacts later.
6️⃣ Expansion phase was mechanical
Once volume accelerated:
🔹 Leverage increased
🔹 Shorts were liquidated
🔹 Exchanges amplified liquidity
🔹 Momentum systems engaged
From this point, price discovery becomes reflexive.
7️⃣ Risk concentration is non-trivial
On-chain data indicates significant supply concentration.
A small group of wallets controls a meaningful share of float.
This introduces binary risk:
🔹 Support continuation
🔹 Or rapid distribution
Liquidity disappears faster than it appears.
8️⃣ This asset class demands precision
CRYPTOCAP:PIPPIN is best described as:
👉 A high-beta momentum instrument
👉 A narrative-driven liquidity event
It is not:
❌ A long-term investment vehicle
❌ A fundamentals-based AI allocation
❌ Capital-preservation oriented
Volatility is a feature, not a flaw.
9️⃣ Where participants fail
Most losses occur when traders confuse:
🔹 Narrative with valuation
🔹 Momentum with durability
🔹 Fair launch with safety
Markets punish conceptual errors quickly.
1️⃣0️⃣ Final assessment
CRYPTOCAP:PIPPIN is not a forecast.
It is a case study in modern crypto market behavior.
Success in this market comes from understanding:
👉 Structure
👉 Liquidity
👉 Timing
👉 Risk
Not belief.
This is a high-risk memecoin environment.
Position sizing and discipline are mandatory.
Follow for institutional-grade crypto analysis.
NFA & DYOR
Memecoins

$PEPE BREAKDOWN: 70% Dump? SMC Says YESCRYPTOCAP:PEPE BREAKDOWN (READ THIS BEFORE YOU SCROLL): 70% Dump? SMC Says YES
Price has broken the long-term support at $0.0000059 and that level is now strong resistance.
Until PEPE reclaims this zone, trend stays bearish.
SMC Structure
HTF Demand swept + Weekly FVG filled
Liquidity taken below multi-month lows
Support → Resistance flip at $0.0000059
Below this = continuation sell-side liquidity hunt
Downside Expectation
If price rejects from the new resistance, PEPE still has room for 60–70% downside.
That drop would hit the HTF Accumulation Zone → $0.00000178
(High-value area where Smart Money positions.)
Fractal Outlook
Last time PEPE entered this structure → 4650% bull run.
Same HTF pattern forming again.
If PEPE drops 40%–70%, that’s where long-term money accumulates for the next big move.
Reclaim $0.0000059 = bullish reversal
Stay below = deeper accumulation incoming
HTF structure is not bearish forever, It’s preparing the next expansion. Watch the reclaim.
NFA & DYOR

Will Bitcoin Test $65000 level soon ?🚨 #BTC/USDT SMC Update and Fresh Analysis 🚨
Our previous short setup played out perfectly with a solid -21% move from the $94,000 region, catching the local top and dumping all the way to $75,000.
What’s next?
From a Smart Money Concepts (SMC) perspective, current PA suggests another local top might be in.
🔹 Bearish Order Block just got tapped
🔹 Strong Resistance seen near the $86,000 level
🔹 Price forming LL (Lower Low) and LH (Lower High) structure
If this setup plays again, we may see a new low below $75,000.
Key Level to Watch:
If a HTF candle closes above $88,200, the short thesis is invalidated — and in that case, we may be looking at a bullish continuation toward the $100,000 zone.
Reminder:
Don’t enter blindly. Wait for confirmations and respect risk management—protect your capital at all costs.

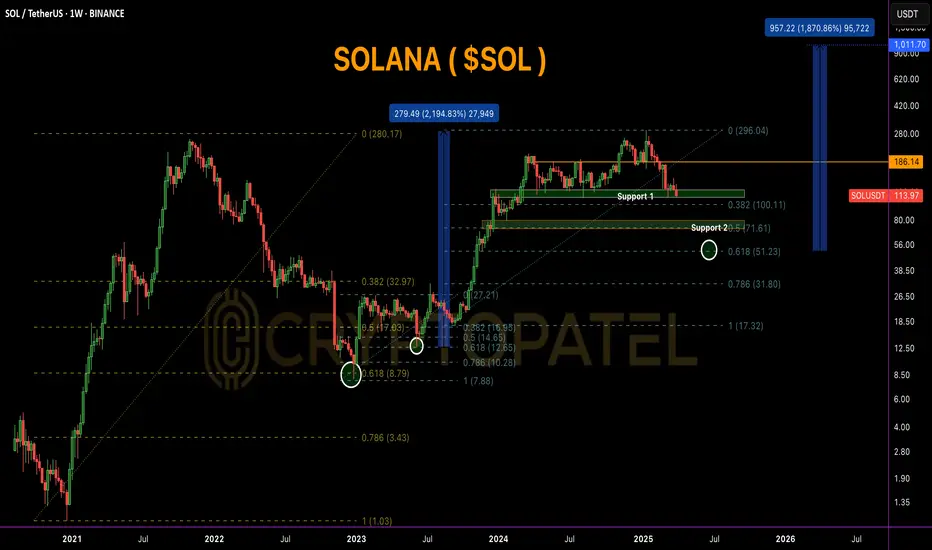
SOLANA Weekly Chart Breakdown–2020 Fractal Signals Massive Bull#SOLANA Weekly Chart Breakdown – 2020 Fractal Signals Massive Rally Ahead!
CRYPTOCAP:SOL is trading at $114.35, currently sitting on a key Fibonacci 0.382 support zone ($100–$115). This area has historically acted as a strong bounce level and is perfect for early accumulation.
If this zone fails, the next major support is the golden pocket ($50–$72) — also marked as Support 2, aligning with the 0.618 Fib retracement.
Historically, this level triggered a 2,100% rally back in 2020-21. If this fractal pattern repeats, we could be looking at a future target near $1,000+.
Breakout level to watch:
▪️ $186 = Bullish confirmation
▪️ $296 = Previous ATH
▪️ $1,011 = Fibonacci-based bull cycle target
Accumulation Plan:
▪️ Zone 1: $100–$115 → Light spot entries
▪️ Zone 2: $50–$72 → Heavy long-term accumulation
✅ Holding above $100 keeps the bullish structure intact.
✅ Break above $186 = start of the next bull wave.
Smart accumulation now can lead to 10x+ returns in the upcoming cycle!
It's All About SO/USDT Overview.
Why Buy Bitcoin? ( Detail Post about $1M Target )Why Buy Bitcoin?
It’s hard to ignore Larry Fink and BlackRock.
At Davos, Fink said: "Bitcoin could hit $500K to $700K."
Meanwhile, top experts are making bold predictions:
🔹 Tim Draper: $250K by end of 2025
🔹 Michael Saylor: BTC = World's largest asset in 48 months
🔹 Peter Brandt: $120K – $200K by Sept 2025
🔹 Chamath: $500K by Oct 2025, $1M by 2040
🔹 Max Keiser: $200K by end of 2024
🔹 Bernstein: $200K by 2025
🔹 Fidelity: SEED_TVCODER77_ETHBTCDATA:1B per BTC by 2038-2040
🔹 Hal Finney: $10M per BTC long-term
Waiting for the headline: "Bitcoin ‘PLUNGES’ from $1,001,000 to $985,000." – CZ Binance
Are you paying attention yet? 🚀
NFA & DYOR

Will Ethereum Fall below $1500 or Ready to $8000 ?#Ethereum Fresh Weekly Analysis
🔹 Current Trend: CRYPTOCAP:ETH has dropped -51% in the last 3 months, signaling a major retracement.
🔹 Key Support Zone: Trading above $2000-$1900, a crucial accumulation zone for this bull market.
🔹 Upside Targets: If #ETH holds this support, we could see $6000 / $8000 / $10,000 in the coming months.
🔹 Risk Factor: If ETH fails to hold $2000, expect a potential dip towards $1500—a key level for long-term accumulation.
Smart Strategy:
✅ Accumulate ETH on dips instead of chasing tops.
✅ Wealth is built by buying in bear markets and selling in bull cycles.
✅ Long-term holders should focus on accumulation, not panic selling.
IMO ETH/USDT has strong potential in this bull cycle—buy smart, hold strong!
Note: Not Financial Advice so DYOR

ETH/BTC Crashed 70%! Target Achieved! Now Real Bull Market ?ETH/BTC Crashed 70%! Target Achieved! Now It's Time for the REAL Bull Market
◾️ Our Short Entry: 0.075 BTC ✅
◾️ Current Price: 0.02337 BTC ✅
◾️ Total Drop: -70%
◾️ Target Achieved! Now, we are ready for the actual Bull Market!
💰 Accumulation Phase Begins! Time to start positioning for the next big move.
#Crypto #Ethereum #Bitcoin

Will TRUM coin hit ATH $77 again ?🚨 $TRUMP Coin crashed 79% from its $77 ATH in just 15 days! 🚨
It's now holding at $16, and I expect a bounce to at least $30 soon.
When do you think $TRUMP will hit $77 again?

$MONGUSDT READY FOR MEGA THIRD WAVE POLONIEX:MONGUSDT LOOKING JUICY after completing WXYXZ CORRECTIVE AND LOOKING FOR MEGA THIRD WAVE Easy 1000-10000x on the cards ....MEMECOIN TO THE MOOONN

BONK Breakout Looks Strong so Targeting Huge 500% Jump! Big SEED_DONKEYDAN_MARKET_CAP:BONK Move Coming: Breakout Looks Strong so Targeting Huge 500% Jump! 🚀
SEED_DONKEYDAN_MARKET_CAP:BONK shows a strong bullish breakout and retest above its weekly support at $0.000030. If this level holds, we could see an explosive 500% move from the accumulation zone: $0.000033-$0.000029.
➡️ Target: 500%
➡️ Stop Loss: $0.000024 or weekly close below $0.000028
➡️ Already 350% gave From Previous Analysis
⚠️ Note: Memecoins are highly volatile with high risk/reward. Always DYOR—this is not financial advice. Get ready for a market reset and potential rally!

T/USDT Bullish Breakout Chart Analysis#Threshold ( NYSE:T ) Bullish Chart Analysis
$T/USDT looks strong for an upward move! The price has broken out and is now trading above the resistance zone.
Accumulation Zone: $0.03 - $0.025
Key Level: If NYSE:T hold above $0.025, it could go up by 500%, Targeting $0.147.
Targets:
1️⃣ $0.040
2️⃣ $0.055
3️⃣ $0.147 🚀
⚠️ Remember: This is not financial advice. Always do your own research before investing.

ETH/USDT Bearish chart below $2660 so what next?$ETH/USDT Technical Analysis
CRYPTOCAP:ETH is trading around $2640, with a strong Bearish Order Block near $2660—high probability of rejection. If $2660 holds as resistance, a retracement toward $2450 is likely.
Note: A 4H candle close above $2660 will invalidate the setup, and I'll close my ETH/USDT short position.
Support: $2450 / $2300
Resistance: $2660

ORDI/USDT Bullish Chart Analysis #ORDI Update:
SEED_DONKEYDAN_MARKET_CAP:ORDI could see a 20-30% upward move if it holds the $30 support level.
However, if it falls below $30, it may drop further, potentially going below $20.
Stay cautious and watch the key levels!

PEPE Swing Long Trade Update - Pepe is currently Trading at .00001057
- PEPE has shown impulsive moves and still is showing the same for the past 2 days
- It will be essential to see how the weekly candle closes for PEPE
- If you are holding Pepe then continue holding it as I think we can soon see this pumping another 30% from here
- Now let's talk about the odds if Pepe doesn't pump from here we can even see this dumping towards the FVG it has created and I think that will be a very conservative entry
- If you are looking for Spot Accumulation then make sure you wait and look for a conservative entry

Ethereum Ready to $6000 ?CRYPTOCAP:ETH Chart Update
Next Target: $5500-$6000
Best Accumulation Zone: $2500-$2100
Long Term Target: $8000-$10,000
#Ethereum bounced strongly from the $2100 level (channel support), and with the next resistance at $5500-$6000, I’m expecting the next stop for #ETH to be $6000

PEPE Swing Long Bullish Setup - Pepe is currently trading at .000000782
- Majorly all the memecoins across the board are setting up nicely and huge
- Pepe from a Spot Accumulation perspective looks completely set here
- I can easily see a upside of 100% in a quarter so watch out for PEPE in dips

Arbitrum $5 Potential in Current Bull Market?ARBITRUM (ARB/USDT) Chart Analysis:
➡️ Liquidation Sweep: ARB has recently hit a high liquidation zone, wiping out all longs that were opened near the top. Even those with lower leverage positions have been liquidated, pushing the price into a very deep dip.
➡️ Accumulation Zone: This dip presents a strong accumulation opportunity in the spot market. I'm starting to accumulate ARB between the $0.58-$0.4 range. This area is ideal for long-term investors looking to capitalize on the current market conditions.
➡️ Resistance Levels:
Major Resistance 1: $0.8
Major Resistance 2: $2
Should ARB break through these two key resistance levels, we could potentially see the price rally to $5-$8.
➡️ Investment Strategy: I've initiated my buy orders, and my target is set at $5. After losing the $1.84 support, ARB has dropped by 77%, which marks an 82% decline from its all-time high (ATH).
➡️ Bull Run Expectation: In the current bull run, I am aiming for a potential 10x return on ARB. This could be a prime opportunity to position for significant gains.

WIF/USDT Forming Lower Low PatternMy Short term View on WIF/USDT
As per Chart Analysis We can See #WIF/USDT Forming LL/LH Pattern.

Crypto Total Market cap ( Atcoins Boom hard soon )At the peak of this bull run, we expect the #crypto market cap to hit at least $10 trillion, with #Bitcoin reaching $150k-$180k.
Work hard in the coming months to maximize profits. Stay ready for major market movements and manage risks effectively.
The next year could be life-changing—stay dedicated and persistent.
Like/share if you Agree

POPCAT Technical Analysis - Popcat or theme-based tokens can be the next euphoric crypto to lead the Crypto Bull Run rally from the meme category
- Popcat is currently trading at a cheap zone and can easily give 5-10x returns from here
- Memecoins print you money when you buy it cheap and hold it for a decent span, trading in meme coins isn't very profitable when compared to holding
- Popcat Accumulation Zone - 0-30-0.40$

NOTCOIN Ready for Another Leg down?GETTEX:NOT Fresh Update & Chart Still Super Bearish ❌
IMO As per Chart Analysis We can see Small Pump toward $0.006-$0.0065 before Next leg down to $0.004
Do you own Research also before investing in Any crypto. NFA

#Ethereum Super Bullish Elliott Wave Analysis Towards $10,000#Ethereum Super Bullish Elliott Wave Analysis Towards $10,000 Target
1️⃣ ((C)) Zigzag Pattern: On the ETH/USDT 1D chart at the cycle degree, wave ((C)) of a Zigzag pattern appears to be unfolding. The projected target for this wave is $3,250.
2️⃣ Diagonal Wave 4: On the $ETH1D chart at the primary degree, Wave 4 down of an ascending Diagonal is currently in progress. The anticipated target for this corrective wave is $3,050.
3️⃣ Diagonal Wave [ ]: On the #ETH 1D chart at the Supercycle degree, Wave [ ] of an ascending Diagonal seems to be developing. The projected target for this significant wave is between $9,000 and $10,000.
Please Correct if I'm Wrong & Must Appreciate if you Happy with My Analysis.
Thank you Family.
Stay informed with our detailed technical analysis.

Technical Analysis Update: DXY & Bitcoin Price Correlation Technical Analysis Update: DXY & Bitcoin Price Correlation
DXY Overview:
The US Dollar Index (DXY) is currently trading at a pivotal support level of $105. This level is crucial as it has played a major role in dictating the next moves for Bitcoin.
Bitcoin Price Implications:
If DXY Bounces: Should the DXY rebound from the $105 support level, we might see a bearish impact on Bitcoin, potentially driving BTC prices down towards the $50,000 mark.
If DXY Breaks Down: Conversely, if the DXY fails to hold this support and breaks below $105, it could signal a bullish scenario for Bitcoin, with price targets possibly reaching up to $75,000.
What to Watch:
Traders should keep a close eye on the DXY's behavior at the $105 support. A confirmed bounce or breakdown will be pivotal in setting the next direction for BTC prices.
Action Steps:
- Monitor DXY closely for any signs of reversal or continuation patterns at the support level.
- Prepare for potential volatility in BTC prices in response to DXY movements.
Stay Tuned: Follow for more updates.
