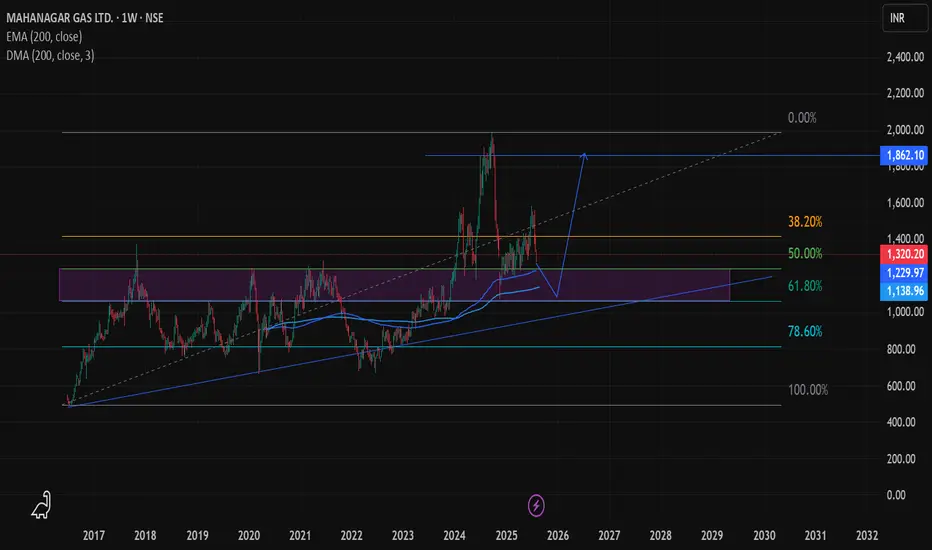
MGLThe stock appears to be reversing from the Fibonacci retracement levels, in the aligning with the 200 EMA and 200 DMA on the weekly timeframe.
MGL
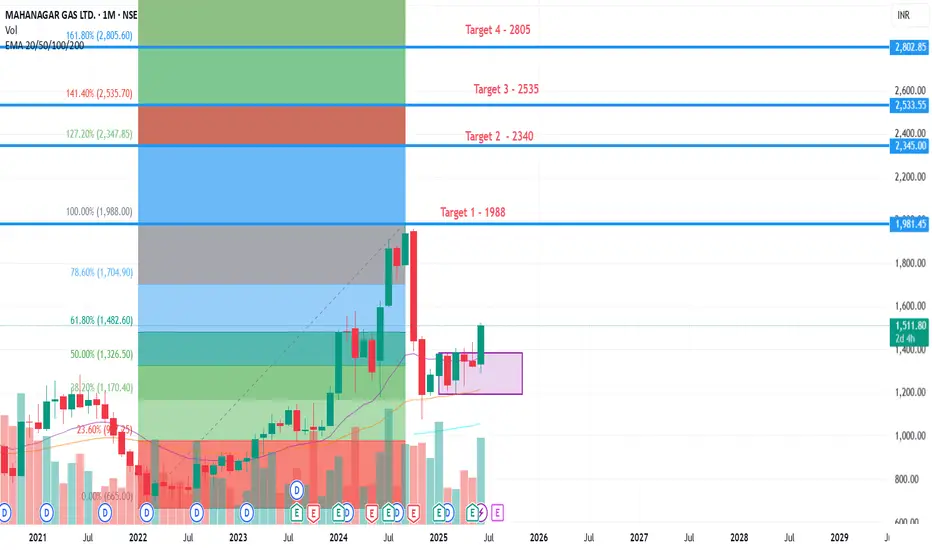
Long MGL target 2800+MGL has taken good support at 1388 on Monthly chart.
The Long term target of MGL is 2800+
Stop Loss is 1388
Its long term target so need patience.
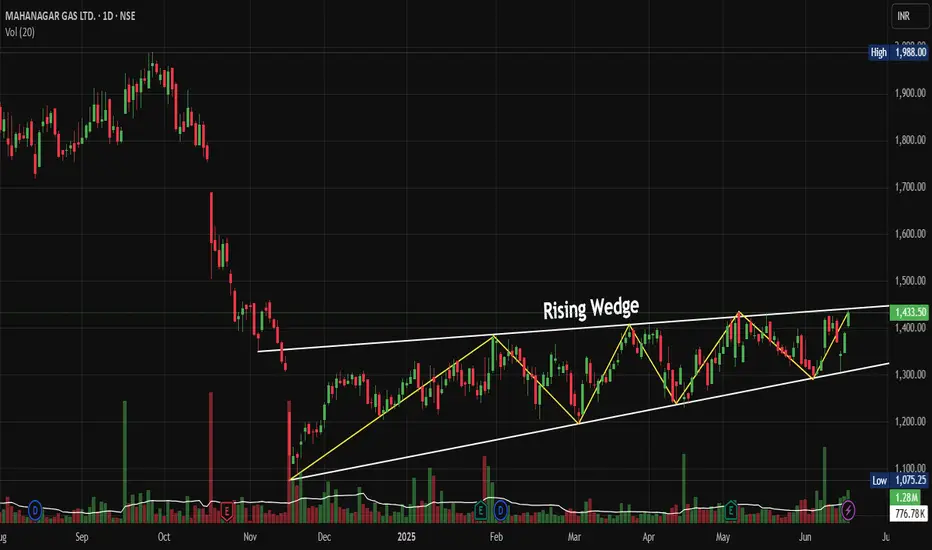
MGL: Rising Wedge Breakout Sets Stage for Explosive RallyNSE:MGL : Rising Wedge Breakout Sets Stage for Explosive Rally after management guidance of double-digit volume growth for the next three to four years.
Price Action Analysis:
• Stock has formed a classic Rising Wedge pattern from November 2024 lows around 1,075 to current levels near 1,433
• The wedge shows converging trendlines with higher highs and higher lows, typical of consolidation before a breakout
• Recent breakout above the upper trendline around 1,400 levels confirms bullish momentum
• Price has rallied 33% from the wedge base, indicating strong underlying demand
Volume Spread Analysis:
• Volume spikes are visible during key breakout moments, particularly in recent sessions
• Higher volume on up days compared to down days suggests institutional accumulation
• Volume expansion during the wedge breakout confirms genuine buying interest
• Recent green volume bars indicate sustained buying pressure supporting the uptrend
Key Technical Levels:
Support Levels:
• Immediate support at 1,380-1,400 (previous resistance turned support)
• Secondary support at 1,300 (middle of the rising wedge)
• Major support at 1,200-1,250 (lower trendline of the wedge)
• Critical support at 1,075 (November 2024 lows)
Resistance Levels:
• Immediate resistance at 1,450-1,470 (psychological levels)
• Next resistance at 1,500 (round number resistance)
• Extended target at 1,600-1,650 based on wedge height projection
• 52-Week high resistance around 1,988 (historical peak)
Technical Patterns:
• Rising Wedge pattern near to completion with successful breakout
• Multiple higher highs and higher lows confirming uptrend structure
• Potential cup and handle formation on longer timeframes
• Bullish flag consolidation patterns within the broader uptrend
Trade Setup:
Entry Strategy:
• Primary entry on pullback to 1,400-1,420 levels (retest of breakout zone)
• Aggressive entry at the current market price of around 1,433 for momentum players
• Scale-in approach: 50% at 1,420, 25% at 1,380, 25% at 1,350
Exit Levels:
• First target: 1,500 (16% upside from current levels)
• Second target: 1,600 (22% upside potential)
• Extended target: 1,700-1,750 for long-term holders
• Trailing stop-loss strategy recommended above 1,500 levels
Stop-Loss Placement:
• Conservative stop-loss: 1,320 (below wedge support)
• Aggressive stop-loss: 1,380 (below immediate support)
• Risk-reward ratio of 1:2 to 1:3 depending on entry and exit points
Position Sizing and Risk Management:
• Allocate a maximum of 2-3% of the portfolio to a single position
• Use a 1% risk per trade rule based on stop-loss distance
• Consider partial profit booking at 1,500 levels
• Maintain position size discipline to avoid overexposure
Sectoral and Fundamental Backdrop:
Sector Analysis:
• City Gas Distribution (CGD) sector showing resilience amid energy transition
• The government push for clean fuel adoption, supporting the natural gas demand
• Infrastructure expansion in tier-2 and tier-3 cities benefiting CGD companies
• Regulatory environment remains supportive with steady tariff mechanisms
Fundamental Strengths:
• NSE:MGL operates in prime Mumbai and adjoining areas with stable demand
• Strong cash flows from residential and industrial customer base
• Consistent dividend-paying track record with healthy payout ratios
• Robust balance sheet with minimal debt and strong return on equity
• Expanding PNG and CNG network, providing growth visibility
Key Catalysts:
• Increasing vehicle conversion to CNG, supporting volume growth
• Industrial demand recovery post-pandemic is driving commercial sales
• Government policies favouring cleaner fuel alternatives
• Potential for geographical expansion into new license areas
Risk Factors:
• Crude oil price volatility is affecting input costs
• Competition from electric vehicles in the transportation segment
• Regulatory changes in gas pricing mechanisms
• Economic slowdown impacting industrial demand
My Take:
The technical setup suggests NSE:MGL is well-positioned for continued upward momentum following the rising wedge breakout. The combination of strong fundamentals, supportive sector dynamics, and bullish technical patterns creates an attractive risk-reward proposition for both swing and positional traders. However, traders should remain disciplined with position sizing and risk management given the stock's premium valuation at current levels.
Keep in the Watchlist.
NO RECO. For Buy/Sell.
📌Thank you for exploring my idea! I hope you found it valuable.
🙏FOLLOW for more
👍BOOST if you found it useful.
✍️COMMENT below with your views.
Meanwhile, check out my other stock ideas on the right side until this trade is activated. I would love your feedback.
Disclaimer: "I am not a SEBI REGISTERED RESEARCH ANALYST AND INVESTMENT ADVISER."
This analysis is intended solely for informational and educational purposes and should not be interpreted as financial advice. It is advisable to consult a qualified financial advisor or conduct thorough research before making investment decisions.
Long Correction is expected to take place in INDRAPRASATH GAS!Elliott Wave Analysis:-
In Correction wave a) wave took place and for retracement b) wave and still a little more correction was pending it seems to be. and the fall is expected from there.
i am not a SEBI registered advisor.
Before taking a trade do your own analysis or consult a financial advisor.
I share chart for education purpose only. I share my trade setup.

Mahanagar Gas Limited: A Breakout OpportunityThe stock is in a solid consolidation phase, forming a bullish pattern of higher highs and higher lows. Patience is key, so I'm playing it smart by waiting for a decisive breakout above ₹1339 on a closed candle. Once confirmed, I'll buy above that high for a strong entry point.
📊 Technical Insight:
RSI is showing strength, hinting at momentum building up. Fingers crossed that we get a smooth breakout without an overly sharp spike!
💼 Fundamentals Check:
With robust financials and a leading position in the gas distribution sector, Mahanagar Gas is a powerhouse in the energy space. Strong market fundamentals and positive technical signals make it one to watch closely!
Let’s see if this one fuels up for a big move!

Mahanagar Gas cmp 1300.20 by Weekly Chart viewMahanagar Gas cmp 1300.20 by Weekly Chart view
- Price Band 1145 to 1185 Support Zone
- Gap Down Opening Filled Up for fresh upside
- Stock is getting ready for fresh upside post testing retesting of the Support Zone and Gap Down Opening Filling Up Event is done

MGL diwali pick for tp 3500-4000MGL diwali pick for tp 3500-4000
strong fundamental stock for this diwali to coming diwali

MGL - Bullish1880 - 1900 Strong resistance can now turn into support
Breakout has happen with strong volumes
Expecting a small pull back before rallying further
1980 can act as an SL area

MGL - MAHANAGAR GAS -Short term SwingUptrend - I see a nice cup and handle formed. the cup has a double bottom as well.
I like the pattern and expect a breakout soon. Stoploss is a must to keep you safe if it doesn't work.

MGL - BearishAt strong supply area
May start a retracement journey downwards soon
Expecting 1800 - 1740 soon
1880 strong resistence

Fundamental call - Accumulate on dipsNot a technical view but this call is based on fundamental work being done by MGL across Mumbai, Thane, kalyan and dombivili.
MGL has invested heavily to setup gas pipelines across KDMC and TMC limits. These pipelines are being laid in very heavily populated areas and have lot of potentials to generate revenue as people subscribe to piped gas. This may take few year to complete but the potential for profits is very high.
Hence MGL can reach target of 1500 to 2200 in 3 years.
Accumulate on dips. It's currently near its long time resistance a breakout and sustain above resistance can take this share flying or retracement.
No stop loss

MGL - Accumulation breakout possibleStock accumulating in a range now for past 10+ days
Range breakout upside possible if market and sector supports
All accumulation happing wid low volumes
Keeping on radar for bullish side

MGL- BUY (SWING TRADING)MGL-BUY swing trading technically good level at buying.
fundamentally strong company in ongc and power sectors.

MGL | Swing Trading | Swing stockMGL one of the good stock at buy level.
Good for swing trading that can give up to 9% profit in this swing and long hold can also give breakout and good momentum soon.
keep in your watchlist and keep tracking it.
Like | Share | Comment.
Best of luck
Regards,

Mahanagar Gas Ltd.Hi,
A Bullish Flag & Pole pattern is visible on the daily chart of NSE:MGL after consolidation of around a month.
Daily MACD have given negative crossover on 12'Feb 24 and it is turning to bullish. On weekly and monthly charts the MACD has already given a positive crossover. So, expecting the momentum to continue.
All the Levels with proper stoploss mentioned on the chart are for educational purpose. Consult your financial advisor before making any investment decision.

MGL - Breakout Setup, Move is ON..NSE:MGL
✅ #MGL trading above Resistance of 1440
✅ Next Resistance is at 1700
Related charts:
Charts are self-explanatory. Levels of breakout, possible up-moves (where stock may find resistances) and support (close below which, setup will be invalidated) are clearly defined.
Disclaimer: This is for demonstration and educational purpose only. This is not buying or selling recommendations. I am not SEBI registered. Please consult your financial advisor before taking any trade.

MGLMGL on monthly timeframe has given a good 5 years range breakout. Interestingly there was also good range consolidation for few months near ATH before this breakout.
Volumes have also started building up and this can be a good positional trade in coming months

MGL - Long Setup, Move is ON..NSE:MGL
✅ #MGL trading above Resistance of 1241
✅ Next Resistance is at 1440
Related charts:
Charts are self-explanatory. Levels of breakout, possible up-moves (where stock may find resistances) and support (close below which, setup will be invalidated) are clearly defined.
Disclaimer: This is for demonstration and educational purpose only. This is not buying or selling recommendations. I am not SEBI registered. Please consult your financial advisor before taking any trade.

MGL F&P PATTERN BREAKOUTMGL breaking f&p pattern
with good volume
trading above 20 ema
EDUCATIONAL IDEA

MGL - Buy Opportunity AnalysisNSE:MGL
Mahanagar Gas Limited is a natural gas distribution company. The Company is engaged in the distribution of compressed natural gas (CNG) and piped natural gas (PNG) in Mumbai and its adjoining areas.
TTM EPS: 68.63
TTM PE: 11.95
Sector PE: 23.74
Book Value Per Share: 327.24
P/B: 2.51
Face Value: 10
Mkt Cap (Rs. Cr.): 8,097
Dividend Yield: 2.81
Some Positives:
Company with No Debt
Increasing Revenue every quarter for the past 2 quarters
Book Value per share Improving for last 2 years
Company with Zero Promoter Pledge
Current price is less than the intrinsic value
Company is expected to give good quarter
Company has been maintaining a healthy dividend payout of 38.80%
Good time to consider, as stock is not in overbought zone
Some Negatives:
Inefficient use of capital to generate profits - RoCE declining in the last 2 years
Decline in Net Profit with falling Profit Margin (QoQ)
Decline in Quarterly Net Profit with falling Profit Margin (YoY)
Recent Results: Declining Operating Profit Margin and Net Profits (YoY)
My Opinion: Chart pattern looks promising for 50% return in medium to long term(If you are planning for long-term investment keep adding on dips till 770 and keep a stop loss at 650). In short term too, target of 840-850 is achievable. Please analyze chart on shorter time-frame before you buy.
NOT A RECOMMENDATION. JUST FOR EDUCATION PURPOSE. Thanks

MGL : Best Bearish setup : Long term Resistance zone Alert! Bearish Pattern Spotted! 🐻
📊 Pattern: Broadening Triangle Pattern
📌 Symbol/Asset: MGL
🔍 Description: Stock is around long term resistance zone.
and on a smaller timeframe stock is on the resistance of broadening triangle pattern.
One can take short position from here.
This is the best short trade setup for now !!
👉 Disclosure: We are not SEBI registered analysts, this is not a buy or sell recommendation.

MGL : Exciting Bullish Pattern Alert Exciting Bullish Pattern Alert!
📊 Pattern: Broadening Pattern
📌 Symbol/Asset: MGL
🔍 Description: Stock is about ti give breakout. If stock gives breakout then we can expect momentum after breakout.
If resistance is not crossed then we can see fall upto support levels.
👉 Disclosure: We are not SEBI registered analysts, this is not a buy or sell recommendation. Technical patterns are just one piece of the puzzle. Consider conducting further research, consulting with a financial advisor, and managing your risks appropriately.

MGL Flag and Pole pattern We can see MGL 1500 in upcoming days as per my analysis .
at least this share can make a new high ..cheers.!
