MGL

MGLTrendline and the specially designed volume action analysis suggest a BULLISH run on the MGL.
The background with light green color are indication for bulls taking the position and the Light red background suggest Bears are dominating in the region.
This is my NEXT week analysis on MGL support line are there with good volume supporting the bullish view.
will give follow back to all the followers.
Please comment and let me know about my analysis, Follow for more analysis.
**DISCLAIMER
There is a very high degree of risk involved in trading. Past results are not indicative of future returns. I assume no responsibilities for your trading and investment results. The indicators, strategies, columns, articles and all other features are for educational purposes only and should not be construed as investment advice.

MGL POSITIONAL BUY ABOVE 845MGL BUY ABOVE 845
TARGETS: 854, 863, 870, 875, 879, 884
Posting for Educational purpose only
Closing Basis means stock need to trade above 845 between 3:20 ~ 3.30 PM
If my analysis appears OK then please LIKE, FOLLOW and SHARE to get more future ideas


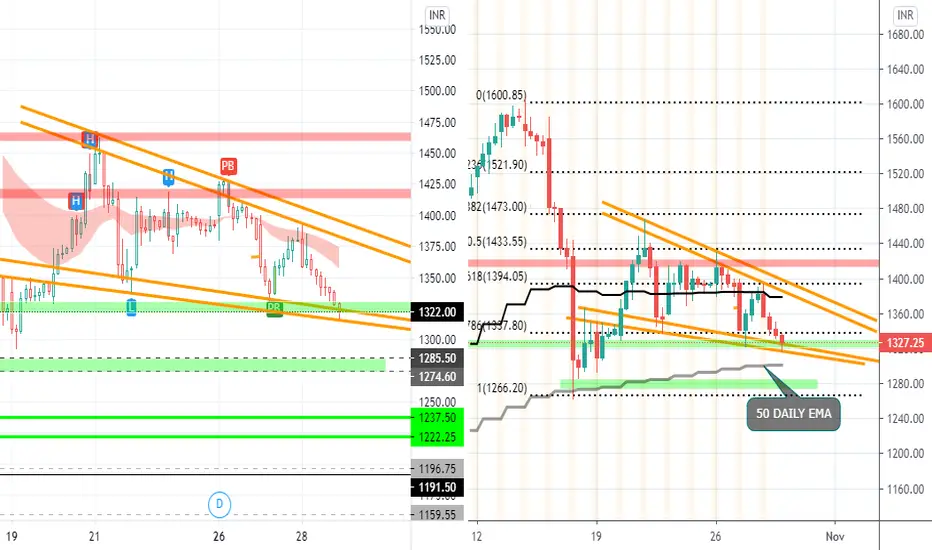
MGL LOOK OUT FOR THESE LEVELS!!! ALL THE LEVELS ARE MARKED ON CHART; FALLING WEDGE PATTERN IN HIGHER TIMEFRAME.
SELL NEAR THE RED ZONE IF REVERSAL CANDLES ARE FORMED ON THE ZONE/ NEARBY THE ZONE
MIGHT GET SOME SUPPORT FROM 50 DAILY EMA OR THE GREEN ZONE(1275-1285) AND COME BACK INTO THE CHANNEL.
The indicator used:
1) Daily Lines plots Daily 20 & 50 EMA on lower time frame charts
2) TE REKAB -> PB: PULLBACK
If you like the analysis, do leave a like and follow for more such content coming up.
The analysis is my POV, hope you got bucks in your pocket to consult a financial advisor before investing :P :)
HAPPY TRADING!!
M
MGL- SWING PICK by Market MattersA breakout has happened. Now wait till it retest the breakout level and move higher...........
Note:
Avoid the stock if a big gap up or gap down is seen
Enter after the breakout happens and not before it
Do not chase the market, i.e., do not get involved in late entries
Only enter with strict stop-loss and target
This is not a recommendation and is for educational purposes only.
always follow risk-reward and quantity management for the 100% of the times
The above mentioned idea may not work, so beware of the risk you are taking
Follow me to Learn and Earn with me.
Happy Trading!!

MGL LOOK OUT FOR THESE LEVELS!!! ALL THE LEVELS ARE MARKED ON CHART;
PRICE IS STRUGGLING TO BREAK DAILY 20 EMA,
PRICE HAS INCREASED ON ACCOUNT OF HIGH VOLUME, AND ITS SUSTAINING/CONSOLIDATING ON ACCOUNT LOW VOLUME.
The indicator used:
1) Daily Lines plots Daily 20 EMA on lower time frame charts
2) TE REKAB shows reversals in the market
PB stands for - PULL BACK.
If you like the analysis, do leave a like and follow for more such content coming up.
The analysis is my POV, hope you got bucks in your pocket to consult a financial advisor before investing :P :)
HAPPY TRADING!!


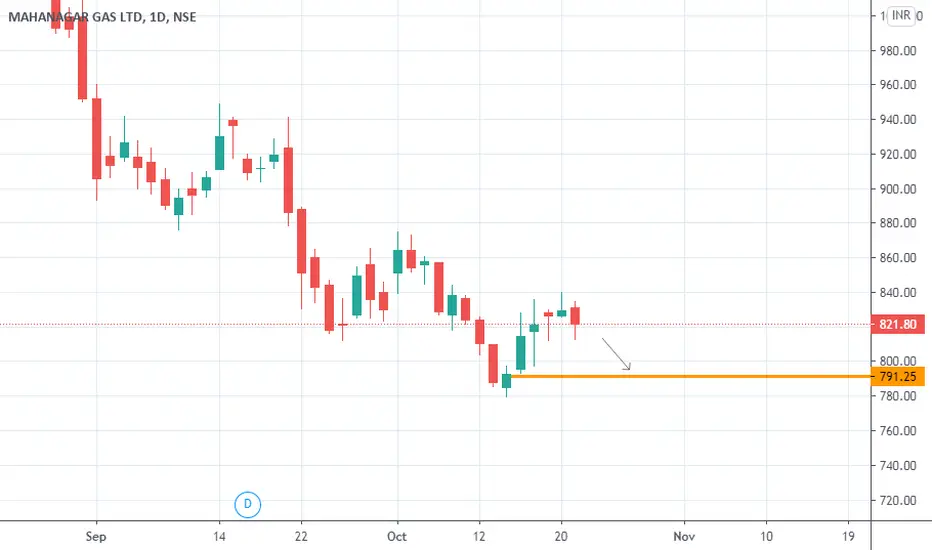
IF MGL Breaks 810 than it may give you targets of 790 IF MGL Breaks 810 than it may give you targets of 790
IGL - Accummulation - Get ready to enterContinously trading in a small range is an indication of a breakout. A BIG BREAKOUT...........
Buy above 850.55
Note:
Avoid the stock if a big gap up or gap down is seen
Enter after the breakout happens and not before it
Do not chase the market, i.e., do not get involved in late entries
Only enter with strict stop-loss and target
This is not a recommendation and is for educational purposes only.
always follow risk-reward and quantity management for the 100% of the times
The above mentioned idea may not work, so beware of the risk you are taking
Follow me to Learn and Earn with me.
Happy Trading!!


MGL - Potential Inverted Head and Shoulders PatternMGL is forming what appears to be an inverted Head & Shoulders pattern on Hourly time frame.
Initiate long.
Target : 1025
Stop Loss : 905

MGL Did Not Break The First 15 Minute Candle Range Of The DayIf MGL Breaks The Next Day, There Will Be a Huge Movement.


MGL: case of ending diagonalAs per the current structure it seems the prior correction is going to be completed in 1 0r 2 days. There is a formation of ending diagonal. One should buy the stock in the range of 860-65 keeping the stop loss at 845 for the target of 950 & if it hold then 995.

Mgl has given a bullish trend indication on rsi cross over Mgl is awaited for a crossover in the price chart
