MIDHANI IN (Mishra Dhatu Nigam) Long 🌎
The company specializes in the production of specialty metals.
Primary products: nickel-, cobalt-, and iron-based superalloys, titanium alloys, specialty steels, and soft magnetic alloys.
The company's products are of strategic importance and are supplied to the defense, aerospace, and energy sectors (including nuclear).
The company operates a full production cycle—from smelting to the production of finished forged, rolled, and drawn products.
Specializing in strategically important alloys for the defense and aerospace industries creates high barriers to entry and ensures stable demand.
74% of shares are state-owned.
EV/EBITDA 31.2
P/B 4.9
Debt/Equity 0.25
Revenue
2023 | 872
2024 | 1,073
2025 | 1,074
Net Profit
2023 | 156
2024 | 91
2025 | 110
MIDHANI

Midhani: Breaks Out of Consolidation: Ready for Lift-Off ?NSE:MIDHANI Breaks Out of Consolidation: A Technical Powerhouse Ready for Lift-Off ?
Price Action Analysis:
- Current Price: ₹463.60 (as of June 23, 2025)
- Price Movement: +20.30 points (+4.58%) on the day
- The stock has demonstrated a spectacular breakout from a lengthy consolidation phase
- Sharp vertical surge from ₹340 levels to current highs of ₹463.60
- Strong momentum evident with substantial volume expansion
Volume Spread Analysis:
- Current Volume: 6.03M shares (significantly elevated)
- Average Volume: 2.36M shares
- Volume surge of approximately 155% above average indicates strong institutional participation
- Volume spike during breakout confirms genuine buying interest
- The previous consolidation period showed declining volume, typical of accumulation phases
Key Technical Levels:
Base Formation:
- Primary Base: ₹220-₹340 range (March 2025 to May 2025)
- Base Duration: Approximately 3 months
- Base Type: Cup and Handle pattern with rectangular consolidation
- Base Depth: From ₹463 high to ₹220 low (52.5% correction)
- Quality: High-quality base with proper volume characteristics
Support Levels:
- Immediate Support: ₹420-₹440 (previous resistance turned support)
- Secondary Support: ₹380-₹400 (50% retracement of recent move)
- Major Support: ₹340-₹360 (breakout point and upper base boundary)
- Ultimate Support: ₹280-₹300 (middle of base formation)
Resistance Levels:
- Immediate Resistance: ₹480-₹500 (psychological round numbers)
- Next Resistance: ₹520-₹540 (measured move from base)
- Major Resistance: ₹580-₹600 (long-term projection target)
Technical Patterns Identified:
Primary Pattern:
- Cup and Handle Formation: Completed with successful breakout
- Handle Formation: Tight consolidation between ₹320-₹340 levels
- Breakout Volume: Exceptional with 155% above average volume
Secondary Patterns:
- Ascending Triangle: Formed during the handle phase
- Flag Pattern: Brief consolidation after initial breakout surge
- Higher Lows: Consistent pattern throughout base formation
Trend Analysis:
- Primary Trend: Strongly Bullish (breakout confirmed)
- Intermediate Trend: Bullish momentum accelerating
- Short-term Trend: Overbought but maintaining strength
Trade Setup and Strategy:
Entry Levels:
- Aggressive Entry: ₹445-₹460 (current levels on minor pullbacks)
- Conservative Entry: ₹420-₹440 (on deeper retracement to support)
- Breakout Entry: ₹350-₹360 (for those who missed the initial move)
Exit Levels:
- Target 1: ₹500 (near-term psychological resistance)
- Target 2: ₹540 (measured move from base)
- Target 3: ₹600 (extended target based on base width)
Stop-Loss Strategy:
- Tight Stop: ₹420 (for aggressive entries)
- Standard Stop: ₹380 (below key support zone)
- Conservative Stop: ₹340 (below breakout point)
Position Sizing and Risk Management:
Position Sizing Guidelines:
- Conservative Allocation: 2-3% of portfolio
- Moderate Allocation: 3-5% of portfolio
- Aggressive Allocation: 5-7% of portfolio (for high-risk tolerance)
Risk Management Framework:
- Maximum Risk per Trade: 2% of total capital
- Risk-Reward Ratio: Minimum 1:3 for all entries
- Scaling Strategy: Add positions on pullbacks to support levels
- Profit Booking: Book 30% at Target 1, 40% at Target 2, 30% at Target 3
Portfolio Considerations:
- Sector Allocation: Limit defence/aerospace exposure to 10-15% of portfolio
- Correlation Risk: Monitor other defence stocks for overexposure
- Market Timing: Consider broader market conditions before position sizing
Sectoral and Fundamental Backdrop:
Defence and Aerospace Sector Overview:
- India's defence budget targeting ₹1.75 lakh crore turnover by 2025
- The government focus on Atmanirbharta (self-reliance) in defence manufacturing
- The global aerospace and defence market is showing a strong growth trajectory
- Space economy growing at 7.4% year-over-year globally
Company Fundamentals:
- Market Cap: ₹8,693 crore
- Revenue: ₹1,074 crore (FY2025)
- Net Profit: ₹110 crore with 21.28% growth in Q4 FY2025
- Promoter Holding: 74% (strong management confidence)
- Specialisation: High-grade alloys, aerospace materials, defence components
Recent Developments:
- Strong presence at Aero India 2025 with indigenous aerospace materials
- Launch of High-Temperature Nickel Alloy Billets and Superni 41 Plates
- Strategic partnerships with HAL, GTRE, ADA, and the Indian Air Force
- Focus on critical materials for defence and aerospace applications
Industry Catalysts:
- Increasing defence procurement by the Indian government
- Export opportunities in aerospace components
- Technological advancement in the space and defence sectors
- The government push for indigenous manufacturing capabilities
Risk Factors and Considerations:
Technical Risks:
- Overbought conditions in the near term may lead to consolidation
- High volatility expected due to recent breakout
- Potential for profit booking at psychological resistance levels
Fundamental Risks:
- Dependence on government orders and policy changes
- Competition from private sector players
- Raw material cost fluctuations
- Execution risks in scaling up production
Market Risks:
- Broader market correction could impact momentum
- Sector rotation away from defence stocks
- Geopolitical factors affecting defence spending
- Interest rate environment impacting valuations
My Take:
NSE:MIDHANI presents a compelling technical setup with a successful breakout from a well-formed base pattern. The combination of strong volume confirmation, favourable sector dynamics, and improving fundamentals creates an attractive investment opportunity. However, investors should be mindful of the recent sharp move and consider appropriate position sizing and risk management strategies.
The stock appears well-positioned to benefit from India's growing defence and aerospace sector, supported by government initiatives and increasing focus on indigenous manufacturing capabilities. Technical indicators suggest further upside potential, making it suitable for both momentum and growth-oriented investment strategies.
Keep in the Watchlist.
NO RECO. For Buy/Sell.
📌Thank you for exploring my idea! I hope you found it valuable.
🙏FOLLOW for more
👍BOOST if you found it useful.
✍️COMMENT below with your views.
Meanwhile, check out my other stock ideas on the right side until this trade is activated. I would love your feedback.
Disclaimer: "I am not a SEBI REGISTERED RESEARCH ANALYST AND INVESTMENT ADVISER."
This analysis is intended solely for informational and educational purposes and should not be interpreted as financial advice. It is advisable to consult a qualified financial advisor or conduct thorough research before making investment decisions.

MIDHANI – Bullish Flag Breakout📊 Pattern Analysis
1. Pole Formation:
The initial rally forming the flagpole is marked by high-momentum bullish candles rising at approximately a 60° angle, supported by increasing volume, indicating strong institutional buying and trend conviction.
2. Flag Formation:
Following the pole, the stock entered a consolidation phase forming a downward-sloping parallel channel (the flag). This retracement occurred on declining volume, a classic sign of a healthy correction with no aggressive selling pressure — reinforcing the validity of a bullish flag.
3. Breakout Confirmation:
The stock has now broken out above the flag resistance with a large bullish candle and surge in volume, confirming the continuation of the prior uptrend. The breakout candle shows a decisive close above the flag range, indicating strong buyer interest.
📈 Technical Indicators
Volume: Volume has spiked significantly on the breakout day, validating the move.
50 EMA: Price has respected the 50-day EMA, which has acted as dynamic support throughout the flag formation.
RSI: The Relative Strength Index is currently above 65, indicating strong bullish momentum but still below overbought levels, allowing room for further upside.
🎯 Trade Setup
Parameter Level
Entry On breakout confirmation or minor pullback
Target Height of the pole added to breakout point
Stop-Loss Below the recent swing low (bottom of flag) or trailing SL aligned with the 50 EMA
Risk-Reward Favorable – allows strategic trailing of profits
📌 Example Calculation:
If the pole is ₹80 high and the breakout occurred at ₹320, target = ₹400.
📌 Conclusion
MIDHANI has confirmed a textbook bullish flag breakout with strong technicals in place:
High-angle pole on volume,
Shallow flag pullback with weak volume,
Breakout with rising momentum and EMA support.
This setup suggests a strong trend continuation and offers an attractive opportunity for momentum traders and swing positions.
🔁 Call to Action
✅ Follow for more updates
👍 Like if you found this analysis helpful
📤 Share with your friends and fellow traders
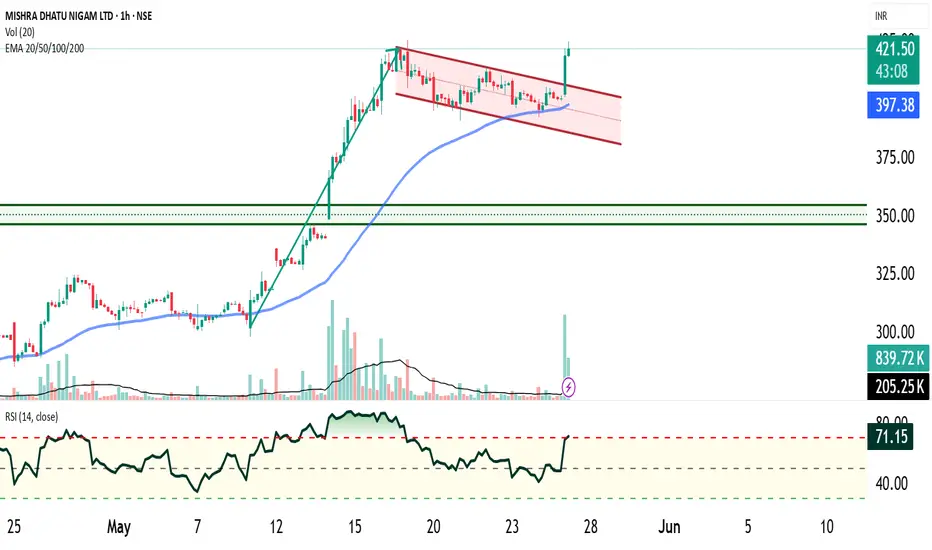
MIDHANI - Bullish Consolidation with VolumesNSE: MIDHANI is closing with a bullish consolidation candle supported with volumes.
Today's volumes and candlestick formation indicates strong demand and stock should move to previous swing highs in the coming days.
The stock has been moving along the horizontal support for the past few days which is indicating demand.
One can look for a 8% to 13% gain on deployed capital in this swing trade.
The view is to be discarded in the event of the stock breaking previous swing low.
#NSEindia #Trading #StockMarketindia #Tradingview #SwingTrade

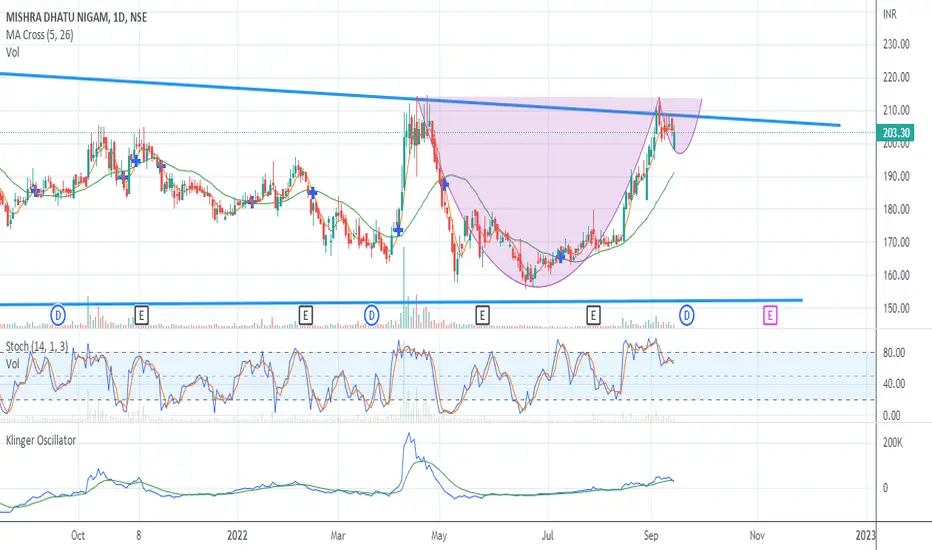
Cup and handle in Mishra dhatu NigamMIDHANI has formed a beautiful a beautiful cup and handle pattern from 2020. Now, the stock is standing near its neckline and is looking strong.
However, the stock has rallied from quite some time now so wait for consolidation after breakout or a retracement to get a good SL. Currently, 230 is a strong support.
Positional Target can be 350 which is 90 points(the length of handle above the neckline) .
Note:-Idea is shared for educational purposes and should not be considered as a recommendation.

Long Midhani for target of 380 long termMIDHANI is religiously following the Fibonacci ratios taking support at 61.8 percentile . Long term target of 380 other targets shown on chart.
May take couple of years to achieve this.
Alloy is important Nuclear submarines and ships. So very good valuation.

Break of strong trendlineVolume is increasing good stock for positional trade
Formation of cup pattern and breakout
can expect min 2-4%in btst trade

MIDHANI LONGMIDHANI CUP N HANDLE BOX RECTANGLE BREAKOUT very nice consolidation pattern target will be 370
Disclaimer
The information and publications are not meant to be, and do not constitute, financial, investment, trading, or other types of advice or recommendations

Inverse head and shoulder breakoutChart -> MIDHANI Daily
Inverse head and shoulder breakout with volume!
CMP: 225
Good Range: 210 to 225
Target: 263.50
SL: 206 Daily Close
Disclaimer: This is for educational purposes only, not any recommendations to buy or sell. As I am not SEBI registered, please consult your financial advisor before taking any action.

MIDHANIMarket Cap 4,520 Cr.
Stock P/E 25.8
Industry P/E 17.1
Dividend Yield 1.28 %
ROCE 19.4 %
OPM 31.4 %
Promoter holding 74 %
Pledged percentage 0 %
Debt to equity 0.22
Free Cash Flow -73.7 Cr.
Relative Strength > 0

Long Midhani for target of 240 In near term there is correction in stock and can fall close to 190 - 195.
Once the stock closes above 214 then we can go long. Also fundamentally a new manufacturing plant is starting in 2023 which raises the forward PE for the stock.
This has been accumulation since last 2 years and havent participated in rally. The defense local manufacturing will make it more attractive.
MIDHANI | Good for Long NSE:MIDHANI
Entry : Above 212 on closing basis
Target : 224, 235, 248, 265 & 278
SL : Closing Below TL or According to Your Risk Management
Reason for Trade : TL Break Out with Moderate Volume & Upcoming Divident |
Maintain position Sizing | Keep strict SL | Book on each Target & Trail your SL
I am not a SEBI registered analyst, All scripts posted here are only for study purpose. Do your own analysis before taking any positions.

Midhani - BullishPlain n Simple
Multi week range taken out with High Volumes
Wait for retest of Breakout
Buy area 178-182
Sl Below 170
Tgts 240

MIDHANI -Swing Trade #MIDHANI
Buy-Above 190
Sl-170
T-220 240 265
The stock has made a base bear 180. Trendline is about to break. Sl is small here. RR is too good. 1:2 will be met on our 1st target itself.

MIDHANI LONG MISHRADHATUNIGAMMIDHANI LONG
Upmove from long consolidation
Target 1- 222
Target 2- 248
Target 3- 277

Long midhani once againBut midhani at cmp 185 for a tgt of 201/210/215. Last week of sep may see buying due to dividend. Risk to reward is favourable . It is ITC of PSU poisoned to reach 200.


#1 MIDHANI - Invested 1L in it lets see | Part-1💲💲 FOLLOW me @Averoy_Apoorv_Analysis and get these free analysis and Real-time trades that I take too :) 💲💲
🔰I too am a learner and would love to learn with you all :)
🔰Well, this is a transparency series created by me, here I will take the trades and then post them, will also tell how much I invested in it and what are my targets, when I exited, what were my returns, or did the SL got hit. These trades are under the guidance of my mentor and as per my risk-reward ratio, This is no call just being transparent with you all :)
➼Don't blindly take the trade focus on the process first then step into the trade
➼Define your risk first then trade
➼If your setup of trading and mine matches then it's awesome we think the same :)
🔰 {Some info} - updated
➼My name is Apoorv and I am a 2nd year Engineering student, I want to pursue trading as my career, and thus whatsoever setups or trades I potentially see on my charting platform, I post it here and share them with you all.
➼I hope you will love my simple analysis style.
➼Feel free to suggest your view on this as learning is earning here :)
➼I take my trades on my Zerodha account :)
➼These charts are my and only my work, my thought process
➼just from an educational point of view and no calls.
➼Guidance: The Madras Trader
<<<<<>>>>>


Live Challenging Stock Market Analysis Buy MIDHANI @ 204.35Live Challenging Stock Market Analysis Buy MIDHANI @ 204.35
Target @ 267.30
Our Unique Features:
—————————————————————
1. Follow our 15 signals ….10% equity will increase in your account for sure.
2. We are not Trailing stop! or average the trades.
3. 2% Risk Management Per trade.
4. Risk vs Reward up to 1:7.
Note:
Trade signals would usually have a risk to reward ratio of 1:2.
It means that even 2 out of 4 signals hits their SL marks, the other two would have closed with profit.
This allows you to be good in overall pips profit.
Signals are usually inter-day (Based on the daily candle) therefore, trades would usually have a holding time of an average minimum of 24 hours.
Note: Everything works with Best money management.
Note: Please leave comments for any query.
Disclaimer: This is my trading experience, it is not an invite or recommendation to trade.
Best Wishes
Forex Tamil


#MidhaniDisclaimer: I am not a SEBI registered or authorized analyst. The charts/levels/stocks posted will be only for educational purpose and not a buy/sell recommendation. I will not be responsible for your any losses & profit. No any kind of legal actions will be entertained for the same.
