Minda Corp: Gearing Up for a BreakoutThe chart of Minda Corp provides delineates critical price thresholds that signify breakout points, along with specific support levels that serve as indicators of where buying interest may manifest.
Additionally, the chart highlights regions likely to act as ceiling points for future price ascensions, allowing for informed decisions on entry and exit strategies.
Disclaimer: The information contained in this technical analysis report is intended solely for informational and educational purposes. It should not be interpreted as financial advice or a recommendation to buy or sell any security. Investors are strongly encouraged to conduct their own research and consult with a qualified financial advisor before making any investment decisions.
MINDACORP
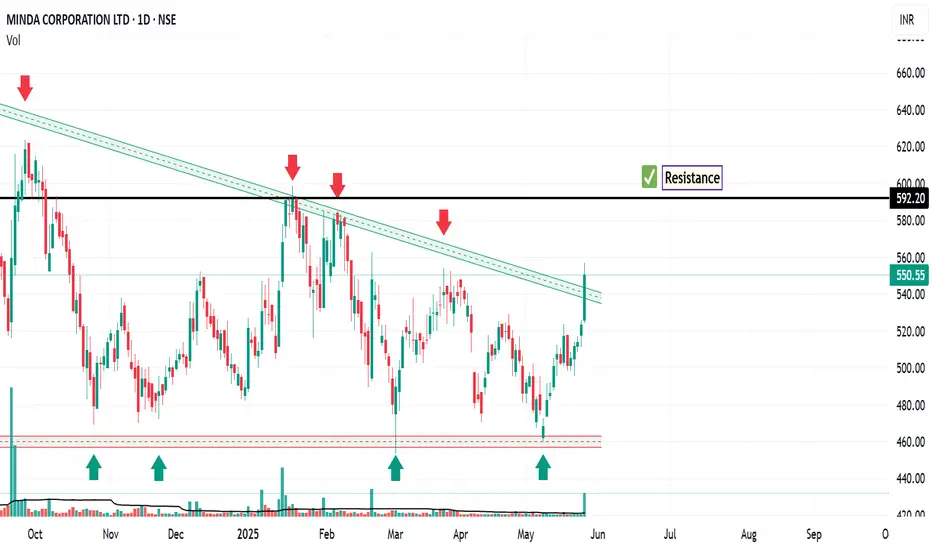
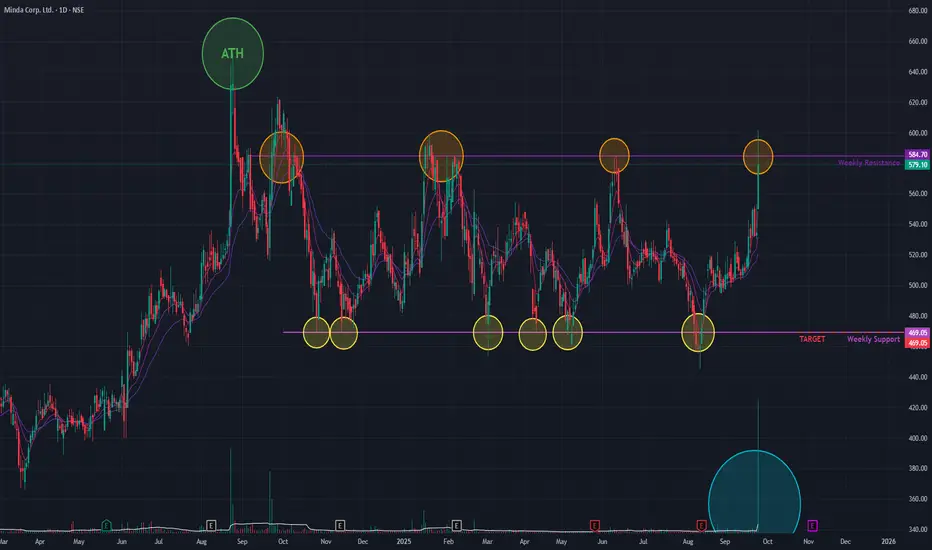
Minda Corp (D) - Challenges Major Resistance with Massive VolumeMinda Corp is making a powerful attempt to break out of a prolonged consolidation phase that has been in place since its All-Time High in August 2024. Today, the stock surged +8.34% on the back of exceptionally high trading volume —the largest spike seen in a considerable time.
The stock challenged a major resistance trendline that has been a barrier since September 2024, rejecting multiple breakout attempts. While today's price action breached this level intra-day, it failed to achieve a close above it , signaling that the battle between buyers and sellers at this critical juncture is not yet over.
Broad-Based Bullish Signals 👍
Despite the failed closing, the underlying technical picture is strong, with multiple indicators suggesting a bullish bias:
- Multi-Timeframe Strength: The short-term Exponential Moving Averages (EMAs) and the Relative Strength Index (RSI) are all indicating bullish crossovers on the monthly, weekly, and daily charts .
- Volume Thrust: Today's massive volume spike underscores the significant buying interest at this resistance level, even if it was not enough to secure a close above it.
Outlook: Awaiting a Decisive Close
The stock is at a critical inflection point. A decisive close above the resistance line on high volume is now required to confirm a true breakout.
- Bullish Case 📈: If a confirmed breakout occurs and the momentum is sustained, the next potential target is the resistance zone near ₹701 .
- Bearish Case 📉: If the stock is rejected again at this level, it could fall back to the lower end of its consolidation range, with a potential support level near ₹469 . The price action in the coming days will be crucial.
2 Amazing swing trading ideas for 17 Jan 2025 I make educational content videos for swing / positional trading

Minda Corp Breaking Major Levels after Bouncing from 200 DEMANSE:MINDACORP today broke major Levels with good Volumes and Made a Good Base near the demand zone near 200 DEMA, and RSI showing Bullishness.
Trade Setup:
It can be a Good 1:1 RISK-REWARD Trade. With the recent base being crucial levels.
Target(Take Profit):
631.50 Levels for Positional Trader.
Stop-Loss:
Around 504.95 For Swing Trade and Recent Base for Positional Trader.
📌Thank you for exploring my idea! I hope you found it valuable.
🙏FLLOW for more
👍BOOST if useful
✍️COMMENT Below your views.
Meanwhile, check out my other stock ideas below until this trade is activated. I would love your feedback.
Disclaimer: This analysis is intended solely for informational and educational purposes and should not be interpreted as financial advice. It is advisable to consult a qualified financial advisor or conduct thorough research before making investment decisions.

MINDACORP - Long Setup, Move is ON..NSE:MINDACORP
✅ #MINDACORP trading above Resistance of 404
✅ Next Resistance is at 482
Related charts:
Charts are self-explanatory. Levels of breakout, possible up-moves (where stock may find resistances) and support (close below which, setup will be invalidated) are clearly defined.
Disclaimer: This is for demonstration and educational purpose only. This is not buying or selling recommendations. I am not SEBI registered. Please consult your financial advisor before taking any trade.
Big Breakout In Minda CorporationBuy Minda Corporation At Cmp 308.85
SL - 270 ( Weekly Closing Basis )
Target - 390/405

Minda Corporation Analysis Stock is trading in a channel with higher high pattern, given BO and retested, again BO with good volume burst, follow chart for proper support and resistance levels.

MINDA CORP - 40% RETURNS!!!BUY - MINDA CORP LTD
CMP - Rs. 281
Target - 1: Rs. 350
Target - 2: Rs. 400
.
.
Technicals - Bullish Symmetrical Triangle BO
.
This is just a view by an expert analyst, please invest at your own risk.
.
Follow me for more!

MINDACORP - Ichimoku BreakoutStock Name - Minda Corporation Limited
Ichimoku Cloud Setup :
1). Today's close is above the Conversion Line
2). Future Kumo is Turning Bullish
3). Chikou span is slanting upwards
All these parameters are showing bullishness at Current Market Price
and more bullishness AFTER crossing 327
#This is not Buy and Sell recommendation to any one. This is for education purpose and a helping hand to learn trading in Market.
#CloudTrading
#IchimokuCloud
#IchimokuFollowers
#Ichimokuexpert
I hope you all like my analysis.
Please do share your thoughts into comment section.
Please give a like, share & subscribe for daily analysis.

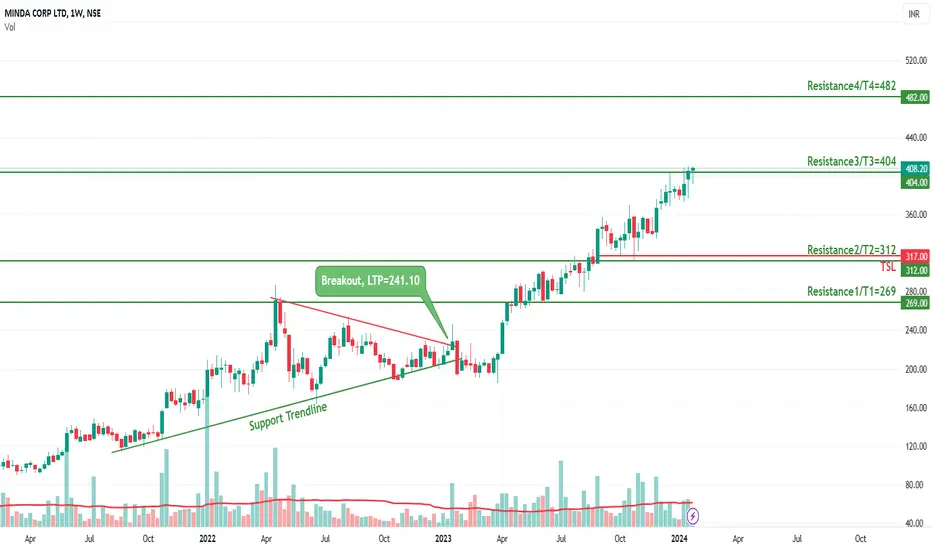
MINDACORP - Long Setup, Move is ON..NSE:MINDACORP
✅ #MINDACORP trading above Resistance of 312
✅ Next Resistance is at 404
Related charts:
Charts are self-explanatory. Levels of breakout, possible up-moves (where stock may find resistances) and support (close below which, setup will be invalidated) are clearly defined.
Disclaimer: This is for demonstration and educational purpose only. This is not buying or selling recommendations. I am not SEBI registered. Please consult your financial advisor before taking any trade.

mindacorp cup and handle patternmindacorp weekly chart cup and handle pattern..
will breakout above 303-304 level.
if breakout happens than will see 400+ level
note : chart is for educational level.

Very healthy breakoutChat -> Minda Corp Daily
Consolidation near ATH and the breakout with volume blast shows it is a very healthy breakout.
CMP: 298
Good Range: 285 to 300
Targets: 320, 360, 410
SL: 260 Daily Close
Disclaimer: This is for educational purposes only, not any recommendations to buy or sell. As I am not SEBI registered, please consult your financial advisor before taking any action.

MINDACORP - Ichimoku Bullish Breakout Stock Name - Minda Corporation Limited
Ichimoku Cloud Setup :
1). Today's close is above the Conversion Line
2). Future Kumo is Turning Bullish
3). Chikou span is slanting upwards
All these parameters are showing bullishness at Current Market Price
and more bullishness AFTER crossing 288
#This is not Buy and Sell recommendation to any one. This is for education purpose and a helping hand to learn trading in Market.
# Cloud Trading
# Ichimoku Cloud
# Ichimoku Followers
I hope you all like my analysis.
Please do share your thoughts into comment section.
Please give a like, share & subscribe for daily analysis.

Mindacorp formation of cup pattern1.Strong resistance @ 287
2.Is near its all time high
3.volume is good
4.can expect 2-3%in btst trade

MINDACORP - DARVAN BOX - SWING MINDACORP has formed DARVAS BOX pattern on DAILY Time frame.
Sustaining above 270 can be a good breakout.

MINDACORP - Ichimoku Bullish Breakout Stock Name - Minda Corporation Limited
Ichimoku Cloud Setup :
1). Today's close is above the Conversion Line
2). Future Kumo is Turning Bullish
3). Chikou span is slanting upwards
All these parameters are showing bullishness at Current Market Price
and more bullishness AFTER crossing 243
#This is not Buy and Sell recommendation to any one. This is for education purpose and a helping hand to learn trading in Market.
# Cloud Trading
# Ichimoku Cloud
# Ichimoku Followers
I hope you all like my analysis.
Please do share your thoughts into comment section.
Please give a like, share & subscribe for daily analysis.

Breakout In MindacorpStock gives breakout on hourly timeframe .
CMP : 224
Target : 247
Stoploss : 213
This is not a buy or sell call, this analysis is shared for educational purpose.

MINDACORP - Consolidation and BreakoutNSE:MINDACORP
Currently trading above long-term support 210 level and trying to breakout triangle pattern.
Also, Daily RSI is at 59 > Weekly and close to Monthly RSI levels. Recently Daily RSI crossed moved from 40 levels and crossed the W RSI level and is on the raise.
Also recently formed an inverted Head-n-Shoulder pattern and trying to breakout Head level.
Add to watchlist - once sustains above 224 level.... will move to 235 and then to 250+ levels in short period.


Minda Corp Ltd.Formation of a symmetrical triangle pattern. Key levels to watch are 222, 237, 253 and 287 on positive momentum.
Above 287, can see a breakout move given the consolidation phase the stock is in since the high.
188-175 can act as important support zone. However, price breach on the downside at 165 can see the stock price even go lower till 150 level.
Always trade with a strict stop loss.
Note: Personal analysis, not a buy sell recommendation. Please do due diligence and consult your investment advisor.

MINDA CORP LOOKS GOOD FOR SWING AND SHORT TERMthis is my first post hereafter i post good swing and short term stocks before 3:15
** I AM NOT SEBI registered advisor please consult financial advisor for your investment.
**This is only for educational purpose you can also share your thoughts on the comments
** In this chart, I can see good supportive trendline and whenever it hits the line it showing some bullish pattern candle and rises.
The Resistance Line was breached with very good candle and Breakout of small INVERTED HEAD & SHOULDER pattern.
One can long above 217 to capture those target.
keep following We will grow like healthy society.

MINDACORP: Inverse H&S BreakoutInverse Head and Shoulders Continuation:
This pattern forms in an extensive upside rally. It consists of a left shoulder, a head, and a right shoulder.
At the end of the left shoulder, a minor correction takes place on the upside which happens on the low volumes comparatively the starting of the left shoulder. After this again a down move can be seen on large volumes forming a head having its bottom is below the left shoulder following an upmove correction on lower volumes & completing the head.
The completion of the head must be above the top of the left shoulder. If the prices rise above the top of the left shoulder then too this pattern remains intact. In the end, the right shoulder is formed usually on smaller volumes comparatively the previous two rallies.
Now if you connect the tops of the left shoulder, head & the right shoulder there will be a formation of the ‘Neckline‘. This line will act as a decision line. If the prices break this neckline & give closing above the line, this will be the confirmation of the breakout of the Inverse head and shoulders pattern.
However, it has been noticed that after breaking of the neckline the prices again attracted towards this neckline. We say this phenomenon as a retest of the neckline which will add some more confidence while trading this pattern.
After retesting if the prices again start rising, this will be the final confirmation of the up move as shown above.
The bookish target of this pattern is taken as the vertical price range from the bottom of the head to the neckline & the bookish Stop loss should be the bottom of the right shoulder. However this stop loss can be big, so it is advised to keep a stop loss of 4-5% of the price range below the neckline.
TRADING STRATEGY:
Buy on cmp add on dips , keeping SL of 200 look for the measured target of 240-245 region.
