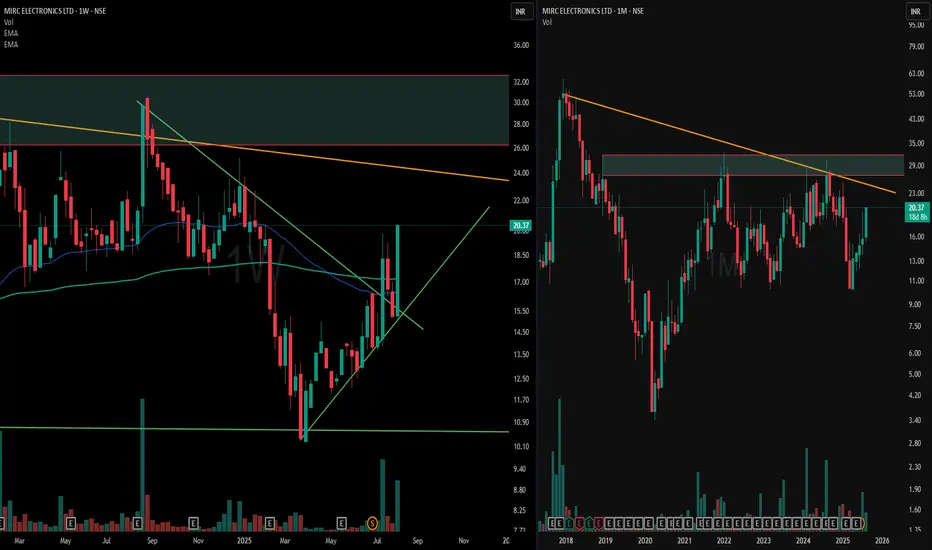
From Breakdown to Structure: A Tale of Two Timeframes📊 Left Chart – Weekly Timeframe (WTF)
Price shifted from a series of lower highs/lows to forming a W-bottom entirely below the 200 & 50 EMA. Post-recovery, it moved into a channel consolidation, held by a green ascending support and capped by a green counter-trendline, creating a clean geometric structure.
📈 Right Chart – Monthly Timeframe (MTF)
A broader view reveals multi-fold hindrances, with red & orange trendlines marking a multi-year counter-trend. Each upside push faces historical resistance near the supply zone.
📝 Editorial Note:
Not a forecast — simply a snapshot of evolving structure from compressed weekly action to obstacle-heavy monthly context.
Mircelectronics
buybought at 20.60 sl 19.20 daily closing target 24-25.
It;s not an investment advise to buy or sell

Buy Mirc Electronics - Long Term DeliveryMirc Electronics is a buy with a first target of Rs. 31 and second target of Rs. 38.
Price of this script looks oversold to me. On daily candle chart piercing line pattern has been created with heavy volume so i dont think there is more downside from here in the stock..
However Stop Loss should be place at Rs. 19.80
If anyone interested in more such fundamental and technical calls please visit our website wp.me
