Chart always tells the truth - Nifty and Banknifty The chart always tells the truth.
We studied that NSE:NIFTY would bounce, and it did — what a bounce!
But keep in mind, fear is still present in the market. Traders can sell even on the smallest negative trigger. Today’s move was largely because of short covering.
Today’s Nifty candle is bullish, but buyers’ volume is only 40 million higher than sellers, while on Friday sellers had 43 million more than buyers.
This clearly shows that sellers are still active.
So, a bullish candle + low volume + short covering = likely sideways action tomorrow.
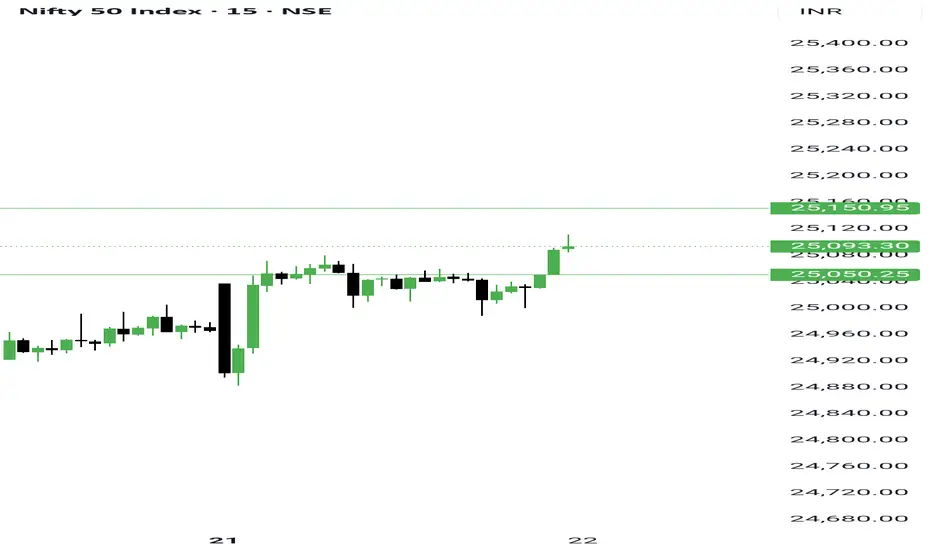
Nifty levels:
- Support: 25050
- Resistance: 25175 — above this, we could see short covering up to 25350
The market remains bullish, and this is the right time to build a list of stocks where character or structure change has happened.
If you can spot such small-cap stocks, you can easily aim for 40-50% upside in next 3-4 months.
Talking about NSE:BANKNIFTY — even after such a big green candle, sellers outnumbered buyers by 7 million in volume. So be cautious while trading here.
BankNifty levels:
- Support: 56770
- Resistance: 57200
Sector-wise, the craze is still around IPOs. Focus on recently listed NSE:NIFTY_IPO stocks (1-2 years old) where character changed in the last rally.
Here’s how my recent picks performed today:
NSE:MASTEK - +7%
NSE:PARADEEP - +7.63%
NSE:JYOTICNC - +5%
NSE:BDL - +2.80%
NSE:LTF - +3.66%
NSE:UPL - +3.92%
NSE:CARRARO - +5.6%
NSE:KPEL - +4.7%
NSE:MMTC - +3.79%
That’s all for today.
Take care.
Have a profitable tomorrow.
MMTC
Everyone’s Buying MMTC… I’m Waiting for this to happen✅ CT Breakout (WTF): Well-defined CT break cleared with strong bullish momentum.
✅ Volume Confirmation: Breakout candle accompanied by 269M+ volume, signaling genuine interest.
✅ Structure: Higher low before breakout reinforces structural reliability.
✅ Base Formation: Multiple weeks of tight consolidation at base builds a solid foundation for the move.
⚠️ Caution – DTF Overextension: On the daily timeframe (DTF), price shows back-to-back green candles, indicating a short-term overbought condition.
A retracement is healthy and preferred. A direct move from here risks a poor R:R swing
📌 Conclusion:
Solid weekly breakout with all structural prerequisites in place. However, due to the extended DTF structure, wait for a healthy pullback before initiating swing entries. Avoid chasing strength. Let the price offer a clean opportunity.
🔁 Following the yellow path = strategic patience + optimal R:R.

MMTC Ltd Poised for Upside After Channel Support at 84Details:
Asset: MMTC Limited (MMTC)
Support Level: 84 (channel support)
Potential Target: To be determined based on breakout confirmation
Stop Loss: Below 84 or as per individual risk tolerance
Timeframe: Short to medium-term
Rationale: MMTC has taken support at the 84 level within its channel, signaling potential for an upward move. If buying interest picks up, the stock could see a rally, provided it sustains above this critical support.
Market Analysis:
Technical Setup: The stock has respected the channel support at 84, and its price action suggests a reversal or continuation of the upward trend.
Sector Context: MMTC, as a key player in trading and minerals, may benefit from favorable commodity trends and market conditions.
Price Target:
Potential targets will depend on confirmation of the breakout and volume support. Historical resistance levels can serve as benchmarks for initial targets.
Risk Management:
Place a stop loss below the 84 support level to minimize risk in case of further downside.
Timeframe:
Short to medium-term, depending on the strength of the bounce and overall market sentiment.
Risk-Reward Ratio:
Favorable, with a low-risk entry point near support and significant upside potential if the stock breaks out of the channel.
Watch for confirmation of upward momentum and ensure to monitor volume and market conditions closely before initiating a position.

MMTCMMTC Buy Zone Target and SL marked.
Only for education purpose. Investments in stock market is subjected to market risk do own researches before investing.

MMTC- Technically visible U-turnMMTC is a company which has one of the worst fundamentals among all PSUs
News of company being scrapped were in market couple of months ago.
Only investors with high risk appetite and disposable money should be interested in this stock.
Technically, a monthly closing above 70 will be confirmation for huge breakout. Previous attempt failed but now we have only 3 sessions so worth the risk for big targets.
Good volumes are seen in past 6 months which means something big is cooking, either upside or downside. Be prepared for both if interested to invest.
If breakout is genuine, definitely huge upside potential as ATH is above 1000 which is more than 15x of CMP .

MMTC - Swing Trade Analysis - 4th July #stocksMMTC (1D TF) - Swing Trade Analysis given on 4th July, 2024
Pattern: RECTANGLE BOX BREAKOUT
- Resistance Breakout - Done ✓
- Volume Buildup at Resistance - Done ✓
- Demand Zone Retest & Consolidation (for a small SL and a better RR) - Done ✓
* Disclaimer

MMTC, DTL BO MMTC making HLs about to test DTL (Down Trend Line)
-VCP in action
-Sellers flushing out
-Check its prior moves, it moves with great momentum


Weekly Long Setup in Alembic LtdA bullish flag & pole Chart Pattern Breakout completed on the Weekly Time frame of NSE:ALEMBICLTD
Price Action supported by very good volume.
The stock is currently in uptrend making higher highs and higher lows.
One can add this stock into their stocks to buy list and initiate the long trade as per the levels mentioned on the chart
Stop loss will be on a Weekly closing basis.
Trend Analysis :- UP Trend
Chart Pattern :- Bullish flag & pole Chart Pattern
Technical Indicator :- possible Positive MACD Crossover
Disclaimer: This is for educational purpose only.

MMTC | Multiyear Breakout📊 DETAILS
Sector: Trading
Mkt Cap: 8,235 cr
MMTC, a public sector undertaking, was incorporated in 1963, to facilitate foreign trade in India and canalize the export and import of essential minerals and metals. It is under the administrative control of the Ministry of Commerce & Industry, and Government of India and is engaged in trading across minerals, metals, precious metals, agro products, fertilizers & chemicals and coal & hydrocarbons.
TTM PE : 47.33 (High PE)
Sector PE : 104.73
Beta : 1.55
📚 INSIGHTS
Strong Performer
Stock with good financial performance alongside good to expensive valuation, but lacks price momentum as suggested by technical indicators
42.88% away from 52 week high
Underperformer - MMTC down by -6.02% v/s NIFTY 50 up by 7.89% in last 1 month
📈 FINANCIALS
Piotroski Score of 6/9 indicates Average Financials
Disclaimer: This analysis is for educational purposes only, and I'm not a SEBI registered analyst.
If you found this analysis helpful, I encourage you to like and share it. Your observations and comments are also welcomed below. Your support, likes, follows, and comments motivate me to consistently share valuable insights with you.
🔍 More Analysis & Trade Setups 🔍
For more technical analysis and trade setups, make sure to follow me on TradingView: www.tradingview.com


Nice weekly long setup in ICILA bullish flag & pole Chart Pattern Breakout on the Weekly Time frame of NSE:ICIL
Price Action supported by very good volume.
The stock is currently in uptrend making higher highs and higher lows.
One can add this stock into their stocks to buy list and initiate the long trade as per the levels mentioned on the chart
Stop loss will be on a Weekly closing basis.
Trend Analysis :- UP Trend
Chart Pattern :- Bullish flag & pole Chart Pattern
Technical Indicator :- Positive MACD Crossover
Disclaimer: This is for educational purpose only.

weekly bullish patter in BGR EnergyA Inverted Head & Shoulder Chart Pattern Breakout happened on the Weekly Time frame of NSE:BGRENERGY
Price Action supported by volume.
The stock is currently in uptrend making higher highs and higher lows.
One can add this stock into their stocks to buy list.
One can initiate the long trade as per the level mentioned on the chart
Stop loss will be on a Daily closing basis.
Trend Analysis :- UP Trend
Chart Pattern :- Bullish Inverted Head & Shoulder Chart Pattern
Technical Indicator :- Positive MACD Crossover
Disclaimer: This is for Educational Purpose only.

Bullish Breakout in Gokaldas exportsA bullish flag & pole Chart Pattern Breakout on the Weekly Time frame of NSE:GOKEX
Price Action supported by very good volume.
The stock is currently in uptrend making higher highs and higher lows.
One can add this stock into their stocks to buy list and initiate the long trade as per the levels mentioned on the chart
Stop loss will be on a Weekly closing basis.
Trend Analysis :- UP Trend
Chart Pattern :- Bullish flag & pole Chart Pattern
Technical Indicator :- Positive MACD Crossover
Disclaimer: This is for educational purpose only.

Weekly Bullish Pattern in Shalby at life highA bullish flag & pole Chart Pattern Breakout on the Weekly Time frame of NSE:SHALBY
Price Action supported by very good volume.
The stock is currently in uptrend making higher highs and higher lows.
One can add this stock into their stocks to buy list and initiate the long trade as per the levels mentioned on the chart
Stop loss will be on a Weekly closing basis.
Trend Analysis :- UP Trend
Chart Pattern :- Bullish flag & pole Chart Pattern
Technical Indicator :- Positive MACD Crossover
Disclaimer: This is for educational purpose only.

MMTC - Bullish WW PatternBullish Wolfe Wave Pattern in weekly chart
Time Frame - Weekly
Double bottom near 26.50 levels
Invalid below 26
Buy Right, Sit Tight

Multi year Breakouthere, is the chart of multiyear consolidated stocks....
buy above the resistance level... Good return possible, A restest possible before it gone up...

Long setup in Mishra Dhatu NigamA bullish flag & pole Chart Pattern Breakout on the Weekly Time frame of NSE:MIDHANI
Price Action supported by very good volume.
The stock is currently in uptrend making higher highs and higher lows.
One can add this stock into their stocks to buy list and initiate the long trade as per the levels mentioned on the chart
Stop loss will be on a Weekly closing basis.
Trend Analysis :- UP Trend
Chart Pattern :- Bullish flag & pole Chart Pattern
Technical Indicator :- Positive MACD Crossover
Disclaimer: This is for educational purpose only.

MMTC Extremely Bullish BreakoutA bullish flag & pole Chart Pattern Breakout on the Weekly Time frame of NSE:MMTC
Price Action supported by very good volume.
The stock is currently in uptrend making higher highs and higher lows.
One can add this stock into their stocks to buy list and initiate the long trade as per the levels mentioned on the chart
Stop loss will be on a Weekly closing basis.
Trend Analysis :- UP Trend
Chart Pattern :- Bullish flag & pole Chart Pattern
Technical Indicator :- Positive MACD Crossover
Disclaimer: This is for educational purpose only.

MMTC Analysis Diwali 🪔 Pick Stock 1Stock was firtst recommended at levels 38 and made a high of 80 approx, now stock has given long term BO with good volume build up, follow chart for proper support and resistance levels.

Long Setup in AGI Greenpac Ltd.A bullish flag & pole Chart Pattern Breakout on the Daily Time frame of NSE:AGI
Price Action supported by very good volume.
The stock is currently in uptrend making higher highs and higher lows.
One can add this stock into their stocks to buy list and initiate the long trade as per the levels mentioned on the chart
Stop loss will be on a Daily closing basis.
Trend Analysis :- UP Trend
Chart Pattern :- Bullish flag & pole Chart Pattern
Technical Indicator :- Positive MACD Crossover
Disclaimer: This is for educational purpose only.

MMTC 10 Year Breakouts1. **Technical Analysis**:
- The stock has experienced breakouts on multiple time frames: daily, weekly, and monthly. This is generally considered a positive sign in technical analysis, as it indicates strong upward momentum.
2. **Trading Recommendation**:
- The recommendation is to buy NSE:MMTC at around Rs 70.
- The target price (TRG) is set at Rs 100-125, which suggests an expectation of significant price appreciation.
- A stop-loss is placed at Rs 53.50, which is intended to limit potential losses in case the trade goes against the investor.
3. **News Event**:
- The stock's rise is attributed to the Indian government's approval of royalty rates for mining strategic minerals, specifically lithium, niobium, and rare-earth elements.
- This approval allows the government to auction blocks for these minerals in India for the first time.
- The royalty rates are specified as 3% for lithium and niobium and 1% for rare-earth elements.
- Royalty rates are important financial considerations for bidders in the auction of mineral blocks.
- India is currently conducting exploration for critical and strategic minerals.

MMTCMMTC :- The stock has given a breakout after 10 years
Hello traders,
As always, simple and neat charts so everyone can understand and not make it too complicated.
rest details mentioned in the chart.
will be posting more such ideas like this. Until that, like share and follow :)
check my other ideas to get to know about all the successful trades based on price action.
Thanks,
Ajay.
keep learning and keep earning.
