Momentum Patterns in Cryptocurrency MarketsUnderstanding Momentum in Crypto Markets
Momentum refers to the speed and strength of price movement in a particular direction. In crypto markets, momentum is driven by a combination of factors such as liquidity inflows, news events, social media hype, whale activity, derivatives positioning, and macroeconomic sentiment.
Unlike equities, where institutional flows dominate, crypto momentum often begins with retail enthusiasm and is amplified by leverage in futures markets. This creates exaggerated price movements, making momentum patterns more pronounced and more frequent.
Why Momentum Is Stronger in Cryptocurrencies
Cryptocurrency markets exhibit stronger momentum patterns than most traditional assets due to:
High Volatility – Daily moves of 5–15% are common.
Leverage Availability – Futures allow 10x–100x leverage, accelerating trends.
24/7 Trading – No closing bell means trends evolve continuously.
Narrative-Driven Moves – News, tweets, and narratives can trigger instant momentum.
Lower Liquidity in Altcoins – Small capital inflows can cause explosive price action.
These characteristics make momentum trading especially attractive—but also risky.
Major Momentum Patterns in Cryptocurrency Markets
1. Breakout Momentum Pattern
Breakouts occur when price moves beyond a well-defined resistance or support zone with increased volume.
Crypto-specific traits:
Breakouts often happen during low-liquidity periods.
Fake breakouts are common due to stop-hunting.
Volume confirmation is crucial.
Strong breakout signals include:
Expansion in volume
Large candle bodies
Open Interest increasing with price
Breakout momentum works best in high-liquidity coins like Bitcoin, Ethereum, and top-tier altcoins.
2. Trend Continuation Momentum
Once a trend is established, crypto markets often show extended continuation phases.
Common continuation patterns include:
Bull flags
Bear flags
Ascending or descending channels
Consolidation above key moving averages
In strong bull markets, cryptocurrencies can remain overbought for extended periods, making traditional indicators less effective. Traders who wait for “cheap” prices often miss the move entirely.
3. Parabolic Momentum Pattern
Parabolic moves are unique to crypto markets and occur when buying pressure becomes exponential.
Characteristics:
Steep price angle
Increasing candle size
RSI staying above 70 for long periods
Media and social hype at extremes
While parabolic momentum can produce massive gains, it is unsustainable. The end often comes with a sharp vertical drop, trapping late buyers.
4. Momentum Divergence Pattern
Divergences occur when price continues to make higher highs or lower lows while momentum indicators fail to confirm.
Common divergence types:
Bearish divergence (price up, momentum down)
Bullish divergence (price down, momentum up)
In crypto, divergences are early warnings, not immediate reversal signals. Strong trends can ignore divergences for extended periods, especially in Bitcoin during macro-driven cycles.
5. Mean Reversion Momentum Exhaustion
Crypto markets frequently experience momentum exhaustion, where price moves too far too fast.
Signs include:
Long wick candles
Declining volume at highs
Extreme funding rates
Overcrowded long or short positions
This often leads to sharp pullbacks or sideways consolidation rather than immediate trend reversal.
Momentum Indicators Commonly Used in Crypto Trading
Relative Strength Index (RSI)
RSI measures momentum strength but behaves differently in crypto:
RSI above 70 can persist for weeks
RSI below 30 often leads to short-term bounces
RSI mid-range (40–60) signals consolidation
Moving Averages
Momentum traders watch:
20 EMA for short-term momentum
50 EMA for trend confirmation
200 EMA for macro bias
Strong momentum often keeps price above key EMAs with shallow pullbacks.
MACD
MACD works best on higher time frames in crypto. Frequent false signals appear on lower time frames due to volatility.
Volume and Open Interest
True momentum requires participation:
Rising price + rising volume = healthy momentum
Rising price + falling volume = weak momentum
Rising Open Interest confirms leveraged participation
Role of Derivatives in Crypto Momentum
Futures and options markets significantly influence momentum patterns.
Key elements:
Funding rates reflect crowd bias
Liquidations accelerate momentum
Stop-loss cascades amplify moves
Large liquidation events often create forced momentum, leading to exaggerated candles known as “liquidation wicks.”
Momentum Across Market Cycles
Bull Market Momentum
Strong continuation patterns
Shallow pullbacks
Altcoins outperform Bitcoin
Narratives dominate fundamentals
Bear Market Momentum
Sharp relief rallies
Lower highs and lower lows
Momentum fades quickly
Volume dries up
Understanding the broader cycle is critical because the same momentum signal behaves differently depending on market conditions.
Risks of Momentum Trading in Crypto
Momentum trading is not without danger.
Major risks include:
Fake breakouts
Sudden reversals from whale activity
News-driven volatility
High leverage liquidation
Risk management is essential. Stop-loss placement, position sizing, and avoiding emotional entries are more important than indicator selection.
Best Practices for Trading Momentum in Crypto
Trade in the direction of the higher-time-frame trend
Use volume and Open Interest confirmation
Avoid chasing late-stage parabolic moves
Combine price action with momentum indicators
Respect volatility—reduce leverage during high uncertainty
Successful momentum traders focus not on predicting tops or bottoms but on participating in the middle of the move.
Conclusion
Momentum patterns in cryptocurrency markets are powerful, fast-moving, and emotionally charged. They arise from a unique blend of retail behavior, leverage, narrative influence, and structural market features. While momentum can generate outsized profits, it demands discipline, adaptability, and strong risk management.
By understanding breakout momentum, trend continuation, parabolic phases, divergence signals, and exhaustion patterns, traders can better navigate crypto’s volatile landscape. In a market where prices can double or halve in days, mastering momentum is not optional—it is essential.
Momentumindicator

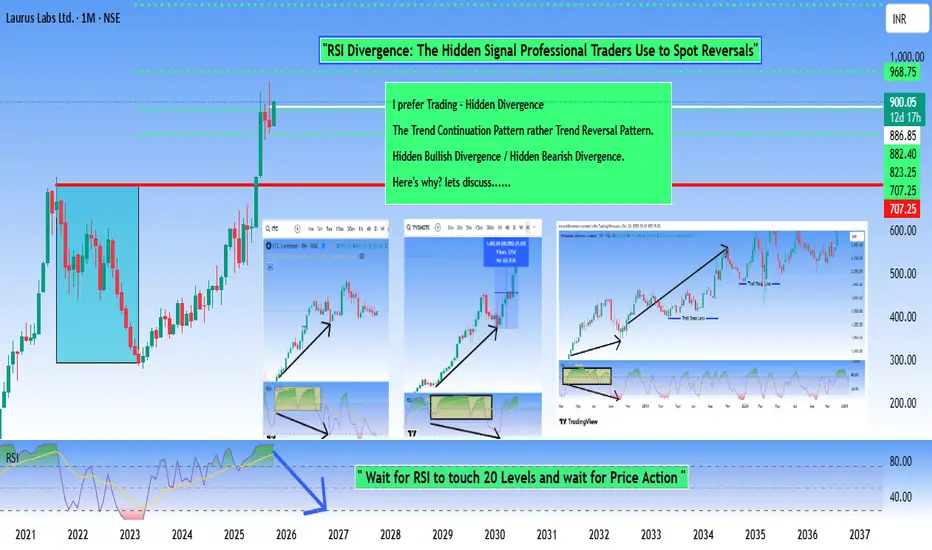
Hidden Signal Professional Traders Use to Spot ReversalsRSI divergence is a technical analysis tool used to identify potential reversals or weakening momentum in price trends.
Here's how it works:
RSI (Relative Strength Index) Divergence occurs when the price of an asset moves in one direction while the RSI indicator moves in the opposite direction.
This disconnect between Price action and Momentum is what traders find significant.
Bullish / Bearish Divergence - This Divergence occurs at the end of a trend, be it Bullish or Bearish Trend.
RSI Hidden Divergence is a more subtle and advanced form of divergence that occurs within trending markets. It's different from regular divergence because it suggests the trend will continue rather than reverse.
Why It's Called "Hidden" ?
Regular divergence is more "obvious" because Price and RSI move in completely opposite directions . Hidden divergence is subtler— It appears within the flow of an existing trend and is easy to miss, hence the name.
Reasons to Prefer Hidden Divergence Rather then Classic Divergence !!!
When we follow Classic Divergence, the possible results are....
False Signals
The biggest issue is that divergences frequently fail to produce reversals. A price may form a lower low while RSI forms a higher low, suggesting a reversal is coming, but the price continues in the original direction anyway. This can lead traders into losing trades if they act on divergence signals prematurely.
Lagging Nature
RSI divergence is a lagging indicator—by the time you spot it clearly, a significant portion of the move may already be complete. You're often trading what's already happened rather than predicting what's about to happen. The reversal might be weeks away, making it difficult for short-term traders.
Subjectivity in Identification
Identifying divergence requires drawing trend lines and choosing which highs and lows to compare. Different traders might draw these lines differently, leading to inconsistent identification of the same divergence. This subjectivity makes it harder to create reliable, mechanical trading rules.
Momentum & Trend Following Strategies in TradingUnderstanding Momentum in Trading
Momentum refers to the rate at which the price of a financial instrument moves in a particular direction. Traders who adopt momentum strategies aim to buy assets showing upward momentum and sell assets showing downward momentum. The underlying assumption is that price trends, once established, tend to persist due to behavioral biases and institutional flows.
Key Concepts in Momentum Trading
Relative Strength: Momentum traders often compare the performance of an asset against its historical performance or a benchmark. Assets outperforming the market are considered candidates for buying, while underperforming assets may be sold or shorted.
Price Rate of Change (ROC): This measures the percentage change in an asset’s price over a specified period, helping traders identify accelerating trends.
Moving Averages & Crossovers: Traders use short-term and long-term moving averages to spot momentum. For instance, if a 20-day moving average crosses above a 50-day moving average, it signals upward momentum.
Breakouts: Momentum traders look for price breakouts from key resistance or support levels, often indicating the start of a strong directional move.
Volume Confirmation: A momentum move accompanied by higher trading volume suggests conviction and increases the probability of trend continuation.
Behavioral Rationale
Momentum is strongly linked to investor psychology. Behavioral biases such as herding, overconfidence, and delayed reaction to news contribute to the persistence of price trends. Market participants tend to chase rising assets, amplifying momentum, while undervalued or declining assets continue to fall as pessimism dominates sentiment.
Momentum Indicators
Several technical indicators are widely used in momentum trading:
Relative Strength Index (RSI): Measures the speed and change of price movements; helps identify overbought or oversold conditions.
Moving Average Convergence Divergence (MACD): Identifies trend direction and momentum strength.
Stochastic Oscillator: Compares a security’s closing price to its price range over a period, indicating momentum shifts.
Rate of Change (ROC): Quantifies the percentage change in price over a specified time frame.
Momentum strategies are typically short-to-medium-term, ranging from a few days to several months, depending on market conditions and the trader’s time horizon.
Understanding Trend Following
Trend following is a broader trading approach based on identifying and riding long-term directional movements in the market. Unlike momentum trading, which focuses on relative performance and price acceleration, trend following emphasizes sustained price movements regardless of speed. Trend followers aim to enter trades in the direction of the prevailing trend and exit when trends reverse.
Core Principles of Trend Following
Markets Trend More Often Than They Mean-Revert: Trend followers operate on the principle that markets, over medium to long-term periods, exhibit trends in response to macroeconomic factors, sentiment shifts, or institutional positioning.
Trading with the Market: Trend following is inherently reactive. Traders wait for clear signals from price movements rather than predicting reversals or tops and bottoms.
Risk Management and Position Sizing: Since trends can reverse unexpectedly, risk management is critical. Trend followers use stop losses, trailing stops, and controlled position sizes to protect capital.
Time Horizon: Trend-following strategies typically have longer holding periods than momentum strategies, ranging from weeks to months or even years in certain markets, such as commodities or forex.
Trend Following Indicators
Trend-following strategies rely heavily on technical indicators to identify the direction and strength of trends:
Moving Averages: Simple Moving Average (SMA) or Exponential Moving Average (EMA) crossovers are common trend signals. For example, a trader may buy when a shorter-term EMA crosses above a longer-term EMA.
Average Directional Index (ADX): Measures the strength of a trend regardless of direction; values above 25 often indicate a strong trend.
Bollinger Bands: Trend followers use bands to confirm price breakouts or sustained trends.
Parabolic SAR: Identifies potential trend reversals and helps with trailing stops.
Practical Implementation
Step 1: Market Selection
Both momentum and trend-following strategies can be applied across multiple markets, including:
Equities: Individual stocks or stock indices.
Forex: Currency pairs exhibiting strong directional movements.
Commodities: Metals, oil, and agricultural products.
Cryptocurrencies: Digital assets with high volatility and clear trends.
Step 2: Identifying Trends or Momentum
For momentum trading, rank assets based on recent performance, RSI, or ROC indicators.
For trend-following, analyze price charts for moving average crossovers, trendlines, or ADX confirmation.
Step 3: Entry and Exit Rules
Momentum Entry: Buy assets showing positive momentum or breaking above resistance; sell or short assets showing negative momentum.
Trend-Following Entry: Enter positions in the direction of the prevailing trend after confirmation from moving averages or trendlines.
Exit Rules: Use stop losses, trailing stops, or reversal signals to exit positions. Trend followers often ride trends until technical indicators signal a reversal.
Step 4: Risk Management
Risk management is critical for both strategies:
Position Sizing: Determine trade size based on account equity and risk tolerance (e.g., risking 1–2% per trade).
Diversification: Spread risk across multiple assets to reduce exposure to a single market.
Stop Losses: Protect capital from unexpected reversals.
Volatility Adjustment: Higher volatility assets may require tighter risk controls or smaller position sizes.
Advanced Strategy Variations
Dual Momentum: Combines relative and absolute momentum. Traders invest in assets with the strongest performance relative to others while ensuring they are positive in absolute terms.
Trend-Momentum Hybrid: Uses momentum indicators for entry and trend-following techniques for position management. For example, enter on RSI breakout but use moving averages to exit.
Sector Rotation: Momentum traders may rotate capital between sectors or asset classes based on relative performance trends.
Algorithmic and Systematic Approaches: Many hedge funds implement algorithmic momentum and trend-following strategies using quantitative models, high-frequency data, and machine learning for signal optimization.
Performance and Market Conditions
Momentum and trend-following strategies tend to perform differently depending on market conditions:
Trending Markets: Both strategies excel in strong, directional trends. Trend followers benefit from sustained moves, while momentum traders profit from short bursts of strong performance.
Choppy or Sideways Markets: Momentum strategies may generate false signals, while trend-following strategies may suffer from whipsaw losses.
Volatile Markets: Momentum strategies can capture rapid gains, but risk management is crucial to avoid large drawdowns.
Empirical studies have shown that momentum strategies often produce short-term outperformance in equities and commodities, while trend-following strategies are particularly effective in commodity, forex, and futures markets over the long term.
Behavioral and Psychological Considerations
Both momentum and trend-following strategies exploit behavioral biases:
Herding: Investors tend to follow recent winners, reinforcing momentum.
Anchoring: Market participants anchor to past prices, creating delayed reactions that trend followers can exploit.
Overreaction: Short-term overreactions create opportunities for momentum trades.
Discipline Requirement: Traders must overcome fear and greed, sticking to systematic rules rather than attempting to time reversals.
Examples of Momentum & Trend Following
Equities: Buying technology stocks outperforming the S&P 500 for the past 3–6 months (momentum) or holding positions until a 50-day moving average crossover signals a reversal (trend-following).
Forex: Trading EUR/USD when it breaks above a recent high with increasing volume (momentum) or following a long-term uptrend using EMA crossovers (trend-following).
Commodities: Entering oil futures when prices break out from a support/resistance zone (momentum) or riding a multi-month trend using ADX to gauge trend strength (trend-following).
Advantages and Limitations
Advantages
Simplicity: Rules-based approach allows systematic trading.
Adaptability: Works across multiple markets and timeframes.
Behavioral Edge: Exploits common psychological biases in trading.
Scalability: Can be applied to both retail and institutional portfolios.
Limitations
False Signals: Particularly in range-bound markets, leading to potential losses.
Drawdowns: Both strategies can experience significant losses during trend reversals.
Market Sensitivity: Performance may degrade in markets with low liquidity or sudden news shocks.
Discipline Required: Traders must follow strict rules, avoiding emotional decision-making.
Conclusion
Momentum and trend-following strategies are pillars of modern trading methodology. While momentum strategies capitalize on short-term price accelerations, trend-following strategies aim to capture long-term directional moves. Both approaches are grounded in behavioral finance principles, technical analysis, and empirical research, making them effective tools for traders seeking systematic, disciplined approaches.
The success of these strategies depends on rigorous market analysis, sound risk management, and psychological discipline. While they are not immune to losses, their adaptability across markets, scalability, and historical efficacy make them indispensable in both retail and institutional trading.
By combining these strategies intelligently, traders can create robust portfolios capable of profiting in multiple market conditions, harnessing both short-term momentum surges and long-term trends for sustained success.
NOVAAGRINOVAAGRI giving classical VCP breakout. Recently given 2 times flag pattern breakout with high volume. And then again consolidation with dried volume. Today again formed a pole of flag with decent volume. Now as long as it is closing above resistance line which is around 51 then I think its good accumulation zone. Up side its open for large space! Track it closely.

PVRINOX Going to Breakout, All details sharedI have been observing an increasing momentum in PVR INOX and Along with this increasing momentum PVR INOX has also closed above a crucial resistance on Thursday, breaking out of a range between 1350 and 1400. This stock has been in this range for a period of 1 month, therefore its breakout indicates a good rally. Defintely buy PVRINOX for short term move.
Entry Price 1400
Stoploss 1380
Target 1480
Happy Trading
Yamini Prabu
NSE, NISM Certified TA
Independent Trader and Trainer

Jamna Auto Industries: Breakout of the Year 🚀Greetings traders! 👋
Today, I'm excited to share my analysis on Jamna Auto Industries #JAMNAAUTO has broken its previous high with significant volume, indicating a potential breakout. This breakout with volume setup suggests strong momentum and presents a compelling swing and positional trading opportunity. Our analysis includes thorough volume analysis, multiple timeframe analysis, and momentum indicator support, pointing towards a bullish trend continuation.
Don't miss out on this breakout opportunity in Jamna Auto Industries!
- Remember to conduct your own analysis and implement proper risk management strategies. Thanks!

INDUSTOWER Momentum Setup 💹Greetings traders! 👋 Today, I'm excited to share my analysis on INDUSTOWER, highlighting a promising positional setup with a breakout supported by volume. Here's what you need to know:
📈 Setup: Positional Breakout With Volume
🔍 Analysis: I've conducted comprehensive analysis across multiple timeframes, confirming the breakout setup.
📊 Indicator Support: Momentum indicators are indicating strong support for the bullish momentum.
Stay tuned for potential upside momentum on INDUSTOWER! Remember to conduct your own analysis and implement proper risk management strategies.
#INDUSTOWER #PositionalSetup #BreakoutAnalysis #VolumeAnalysis #TechnicalAnalysis #TradingView #StockMarket 🚀

ONGC - A Potential multibagger with multiyear breakout Exciting Bullish Pattern Alert! 🐂
📊 Pattern: Head & Shoulder
📌 Symbol/Asset: ONGC
🔍 Description: Stock has given a breakout of the Head & Shoulder pattern.
We can see further upside of 200-300% on months to come !!
Huge upside with momentum possible.
👉 Disclosure: We are not SEBI registered analysts, this is not a buy or sell recommendation.

NYKAA looks good!Why NYKAA Looks Good?
In the recent price action, we have observed a notable bullish trend as the price has surpassed the level it was trading at 10 bars ago. This upward momentum indicates a positive market sentiment and suggests the potential for further price increases.
Furthermore, we have also noticed a significant development in the price crossing above the 21-day moving average. This event suggests a shift in the market dynamics, as the price has moved beyond a key indicator of the average price over the past 21 day. This breakout above the moving average indicates a potential reversal from a previous downtrend to a new uptrend.
Additionally, prior to this breakout, the price appeared to have undergone a period of accumulation near the bottom of the major downtrend. This accumulation phase typically signifies a consolidation or gathering of buying interest, potentially indicating a market bottom. The subsequent breakthrough of resistance further strengthens the case for a reversal in the overall market direction.
In summary, the recent price action and the breakout above the 21-day moving average point towards a shift from a bearish trend to a bullish trend. The market seems to have concluded a phase of accumulation and is now signaling a new uptrend.
Note for everyone who came across this reference:
This chart analysis is only for reference purpose.
This is not buying or selling recommendations.
I am not SEBI registered.
Please consult your financial advisor before taking any trade.

Happiest Minds Analysis 11-3-2023 Buy over 903 closing for 1030 Happiest Minds Analysis 12-3-203 Buy over 903 closing for target of 1030; second target 1131
at buy good to have rate over 20 ema & 3ema cross over 21 ema on rsi.
sl on prv weekly lower break or 21ema cross over 3 ema on rsi.

CESC LONGmest capital indicator has generated an alert of going long in equity for CESC
Timeframe: weekly
Entry : High price of candel
Stoploss: Low price of candel
Happy trading 🙏

CGPOWER LONGmest capital indicator has generated an alert of going long in equity for CGPOWER
Timeframe: weekly
Entry : High price of candel
Stoploss: Low price of candel
Happy trading 🙏

CINELINE LONGmest capital indicator has generated an alert of going long in equity for CINELINE INDIA
Timeframe: weekly
Entry : High price of candel
Stoploss: Low price of candel
Happy trading 🙏

BARC LONGmest capital indicator has generated an alert of going long in equity for BARCCLAYS
Timeframe: weekly
Entry : High price of candel
Stoploss: Low price of candel
Happy trading 🙏

STAN LONGmest capital indicator has generated an alert of going long in equity for STANDARD CHARTERED
Timeframe: weekly
Entry : High price of candel
Stoploss: Low price of candel
Happy trading 🙏

MOMENTUM is a perfect indicator to ANTICIPATE the market!!FAIR value:-3,148.05 / STOCK TRADING ON:-4,401.60, Its's gives us a oppurtunity to SHORT SELLING !!
