INDRAMEDCO breakoutINDRAMEDCO breakout with volume and re-testing, right time to buy but buy small qty as NIFTY is not in a good mood.
Momentumstrategy

#FEDERALBANK Potential breakout for positional betThis banking stock is consolidating forming a potential breakout from a flag kind of pattern.
The momentum on daily also has a a potential reverse divergence that is bullish if it plays out.
The momentum n=and trend indicator are bullish on all time frames. 91 could be
A good support below which could be stop loss for swing/positional trades.caution that the upside moves could
Turn out slow and treacherous since previous resistance at 110 and ash 125 level where appropriate
trailing stop loss could be applied. By the way this is big bull Jhunjhunwala invested stock.

#tatamotors flag pattern breakoutThe stock is seeing flag and pole pattern breakout seen on daily timeframes
Momentum and trend indicators showing bullishness n short medium and long timeframes
weekly showing good volumes too.Daily window Gap support exit at 463 levels that could be
Stop loss for swing/positional or FIB retracement 23 also could be used for same purpose
if aggressive.

#LT Long Swing Trade OpportunityOn the charts, there is a huge volume price-volume breakout from the retracement trendline.
For my entry at 1894 with an SL of 1800 - which is 5% of my buy price - I'm anticipating prices to attain a target of 2094.
It is a 1:2 R:R trade.
The caveat emptor principle applies here, as it does in every trade. Stick to your principles and rules.
Best of luck!

NSE:SONACOMS Captured Whole Momentum !! 42 %NSE:SONACOMS
#SONACOMS traded in a range and gave BO, Post BO to till the Supply Zone, I.e., Resistance, Whole momentum Captured so perfectly !!
Just sharing my experience on this script !!
Happy Trading !!

Shankara momentum tradingStrong trend observed in Shankar building
Long position as mentioned in chart
Trail stop loss after trigger in 'risk multiples'
Trading and risk management as per one's own conviction.
No trading advice, only opinion!

Care rating momentumLong position as mentioned
Strong young stock
Follow stop loss and trail in risk multiples.
Just an opinion, no trading advice.

#sunpharmaceutical cup and handle weakly breakout positionl longThe stock on weekly chart had earlier broken out of a cup and handle pattern and consolidated post to that to further move up
and now has a momentum reverse divergence which is bullish to take it further up if it works out to happen. However caution need to be maintained
with tight stop loss since the ads trend strength has taken a bent on the top which may be indicating a reduced trending move.momentum
is bullish on medium and long term but short term need catch up move and entry need be made only if u see daily momentum rsi > 60.
Positional entries need consider breakout neckline as stop loss while swing trades should consider previous support levels for exit.

dixontechnologies breaking out of a consolidationstock is breaking out of a rectangular consolidation of near 5 months from a triangular/flag pattern
bullish momentum and trend on all timeframes. stop loss for swing trades could
be kept at breakout candle low.

#canfinhomes rounding pattern break out taking out 4 year old reWeekly showing a rounding pattern breakout in progress taking out a 4 year old previous resistance
The last daily candle is wide range bullish . Momentum indicators is bullish on all timeframes short medium and long
while trend indicators are bullish as well with ADX strength of trending seeing rising up on all frames
and therefore continuation of price up move is likely.

ISEC : nice and clean momentum setup11 weeks base - cup n handle on weekly
perfect VCP on daily
also a ascending triangle continuation pattern
volume dry up
> 100% prior move
riped for BO
First entry above 770.

SELF EXPLANATORY SERIES : QUICK ANALYSIS ON ASTRAL.In this self explanatory series I will be posting charts with pure technical analysis only without full length explanations , Traders can ask their doubts in comments section, Happy trading.
Disclaimer : This idea was to just give you an insight about my own view and personal observations. Please do your own research or consult an investment advisor before doing any investment or trading.

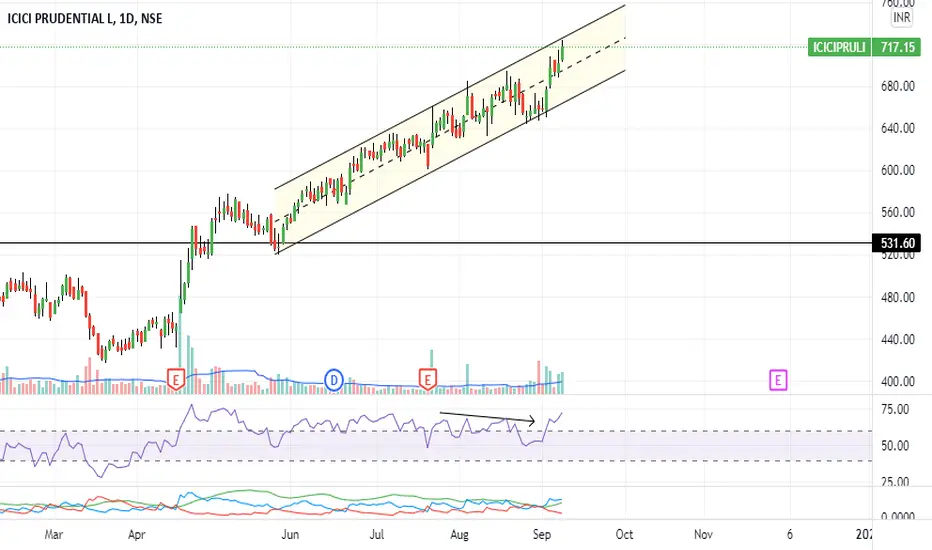
#iciciprudential trending at all time high with volume&momentum#iciciprudential trending with channel at all time high with volume and momentum
weekly has a momentum bullish reverse divergence playing out.
adx trend indicators are also seen rising in strength in all timeframes in bull zones
look like most other stocks in insurance sector also rallying.
#canfinhomes potential multiyear breakout in the making#canfinhomes potential multiyear breakout in the making
a green close above 666 could mean a breakout from a 4 year old resistance
volumes are high and momentum also is in bull zones on all timeframes.
stops need be below breakout candle.

#grasim momentum turned bullish potential breakout candidate#grasim moving up the trendline channel and any green close above 1615 which is previous resistance
Could give opportunities to go long on this.momentum on short term has got into bullish zones
along with all other timeframes with good volumes .Adx trend indicators are also rising on daily
tight stop loss after entry needed as channel swings are large.

BUTTERFLY GANDHIMATI BREAKOUThorizontal breakout in this stock. if anyone uses ichimoku cloud can see it has broken the cloud resistance i.e. SPAN A and is ready for long. volume built up looks decent. targets and stoploss is mentioned in the chart.

#IRTC trendline channel breakout with wide range bullish candle#IRTC Indianrailwaytourcorp trendline channel breakout with wide range bullish candle and volume. Good momentum and trend
on all timeframes. Could wait for a small retracement for entry.

#polycabindia momentum breakout in progress#polycabindia momentum breakout
momentum and trend indicators indicate bullishness on all timeframes.
momentum seen breaking out of a parallel channel with large volumes too.
bullish divergence currently being played out has met the target on last move
and need give some space since diluted momentum divergences exit at the same
time.swing trade and entry only if any retracement comes and 2030
is a resistance zone from where it breakout should be stoploss

#BEL 4 year resistance taken out & Rounding pattern breaking outDaily wide range bullish clear breakout from a 4 year old resistance.
Monthly timeframe rounding pattern breaking out
Momentum and trend indicators showing bullishness on all timeframes.

#marico bullish divergence at resistance potential breakout#marico multiple bullish reverse divergence seen on weekly timeframe and also
a flag kind of pattern that could potential move it up is seen.
daily seen at a 4 times tested zone and therefore not wise to enter until
a green close above it is confirmed.

#SRF flag pattern#SRF bullish divergence met target earlier perfectly and consolidating currently and more steam may be left as a flag pattern seems to be emerging and could attempt a swing long but as long as breakout zone is not breached and momentum does not slip from bull zones.

Metal sector at weekly momentum support make or break Metal sector index last week went bearish following a weekly divergence
It now has a unconfirmed bullish reverse divergence on weekly and could take momentum support and bounce
Daily momentum has touched 40 support. In short any bearish further from here is bearish confirmation and reversal.

TCS weekly W pattern momentum breakoutTCS weekly momentum breakout.tcs weekly W pattern double bottom resistance taken out and broke out of a previous resistance zone that was tested 3 times this year.daily candle is open-low wide range bullish candle. Momentum and trend in all timeframes bullish.
tradable with tight stoploss below last candle. dollar beneficiary trade.
