Why Most Traders Stay Average: The Comfort Trap[ Most traders treat moving averages like magic buy/sell buttons.
That’s not how professionals think .
A moving average is a map of trend + structure, not a trading signal.
❌ The Retail Mistake
Buying when price crosses above
Selling when price crosses below.
Blindly trusting “golden cross” or “death cross.”
👉 Result: Whipsaws, fake entries, frustration.
✅ The Pro Mindset
Trend filter: Are we in uptrend (above MA), downtrend (below MA), or chop (whipsaw around MA)?
Dynamic support/resistance: Does price respect the MA and bounce, or reject and break?
Mean reversion tool: If price stretches too far from the MA, expect it to snap back.
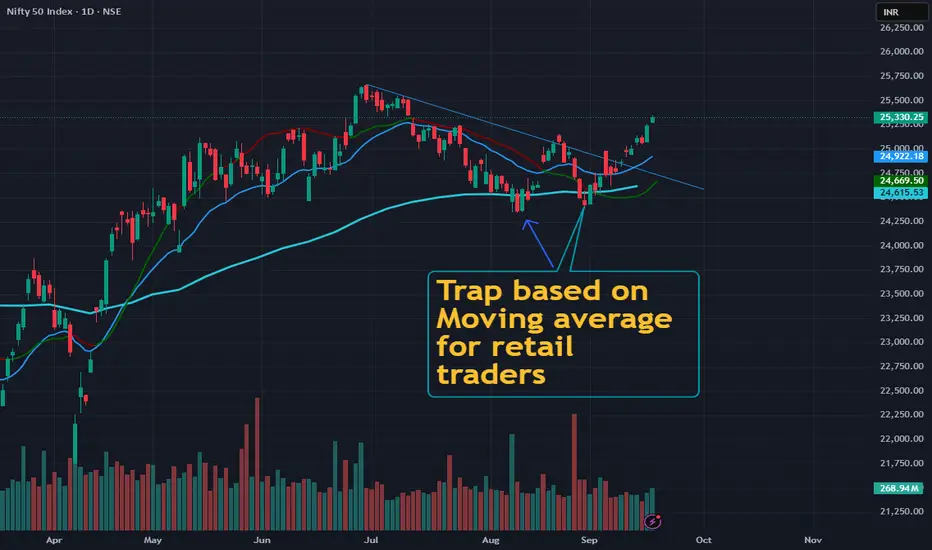
📊 In this NIFTY 50 chart:
April–June → Price rode the 50MA upward (dynamic support).
July–Aug → Price broke below → MA flipped into resistance.
Now → Price reclaiming above → shows buyers regaining control.
🎯 How You Can Use This
Use a 20/50/200 MA to filter trend → trade in the direction of bias.
Use MAs as areas of interest, not entry triggers. Wait for price reaction.
Don’t predict → let context confirm.
👉 Moving averages don’t predict. They contextualize.
Stop asking them for signals. Start using them as maps.
💡 Save this. Follow for daily trader mindset + real education — no fluff.
Moving_average
Falling Knife stocks-How to identify them?I have discussed in previous post about what exactly falling knife stock is with a case study.
The next question would be how would an investor know that stock is a part of falling knife category?
To identify such stocks, I feel you should know about 2 concepts/indicators which are Moving averages and Fibonacci retracement. I will try to make you understand these concepts and also the levels where averaging/investing can be started.
1. Fibonacci(Fib) is a mathematical concept which governs the entire universe, even our stock markets. I can't explain the entire scientific concept here so just sticking to stock market.
Fib retracements help investors identify support and resistance for stock. There are 2 golden ratios which every investor must know, 38.2%(0.382) and 61.8%(0.618).
When a stock is in uptrend, 38.2% is the level where most stocks retrace upto. 61.8% is considered as last ray of hope for bounce in retracement. Any stock which has fallen below 61.8% is considered weak.
2. Moving averages(MA) are indicators which are continuously changing with moving stock market. These are an average of prices over a time period, hence Time frame is important.
There are many types of moving average, we use mostly simple and exponential.
When I say 20 Day EMA, it is Exponential average of 20 days of closing price of stock or when I say 200 week SMA, it is simple average of 200 weeks closing price.
Exponential is more used than Simple moving average which has scientific reason behind it so if you are curious, you can search for it.
200 Week moving average is considered as last ray of hope for investment. A fall below 200 Week moving average or 50 Month EMA indicates strong bearishness.
3. I have seen stocks reach from top to bottom and top again. Tata motors, HDFCAMC being few famous examples. Even, Most of real estate, PSU banks stocks are reversing. So, equity is beautiful, wild and highly unpredictable. However, A stuck investor should wait for monthly closing above 61.8% to start averaging in such stocks. Also, a closing above 200 Week EMA will slightly indicate return of bullishness and that's where reversal traders should think of investing
I feel this much knowledge is enough for now. If you have got some enlightenment from above information, lets apply this knowledge on one stock where I know many many investors are stuck, Rajesh Exports.
How do I know? I saw the shareholding pattern and that's where I was shocked to see the number of shareholders increase from 45000 odd to over 2 lakhs in the past 9 months!
Starting with fundamentals, Rajesh Exports Ltd is 4 decade old manufacturer of Gold and Gold Products available at a PE of around 9 and sales growth of 20% in last 3 years. All the ratios feel nice to me except the operating margin which is below 2% consistently which has led to drop in EPS which is major concern in the stock.
Technically, stock had a 52 week high of 1030 in Feb 2023 and it is now available at 360 odd which is more than 60% wealth destroyed. And as I said, the number of shareholders have grown 5x in the same time. (Note that FII, DII holding has reduced in same period).
If i see now from a non-investors perspective(psychology explains that investor can never see the bearishness), the stock has formed a beautiful double top and broken its neckline which was 61.8% of fib retracement all ready for a further fall and I see no support till 270-300 zone(sorry investors). It is also below 200 week moving average-red wavy line(if you check monthly chart, it is below 200 month moving average as well). A perfect example of Falling knife.
What next? If I were an investor, My last SL would have been 525 which is 50% retracement. Since, the stock is below 61.8% retracement , there is no chance of averaging at this moment. Hence, I feel investors should wait & watch until stock moves above 440 before averaging/entering. Don't jump in it. Wait for a big bullish monthly candle before averaging.
Also....
As promised,, I am sharing you names of stock which i have identified to be part of this unloved category. As an homework, do check fundamentals and reversal levels based on what we have discussed above.
The stocks are GRINFRA, TCNSClothing, Metropolis, Luxindustries, Polyplex, HLEGlasscoat, Deltacorp, Barbequenation.
If you are a curious investor, even you can find such stocks and do let me know in the comments below.
I would like to discuss any doubts regarding the concepts, idea or anything related to stock market so feel free to comment.
Keep investing, keep minting. India has a very big future ahead so these are the best few years to invest in India.Be a smart investor because it is important that you choose the right stock to meet your financial goals.
