Persistent Technical Analysis#Persistent Systems Limited - Technical Analysis
Chart Overview
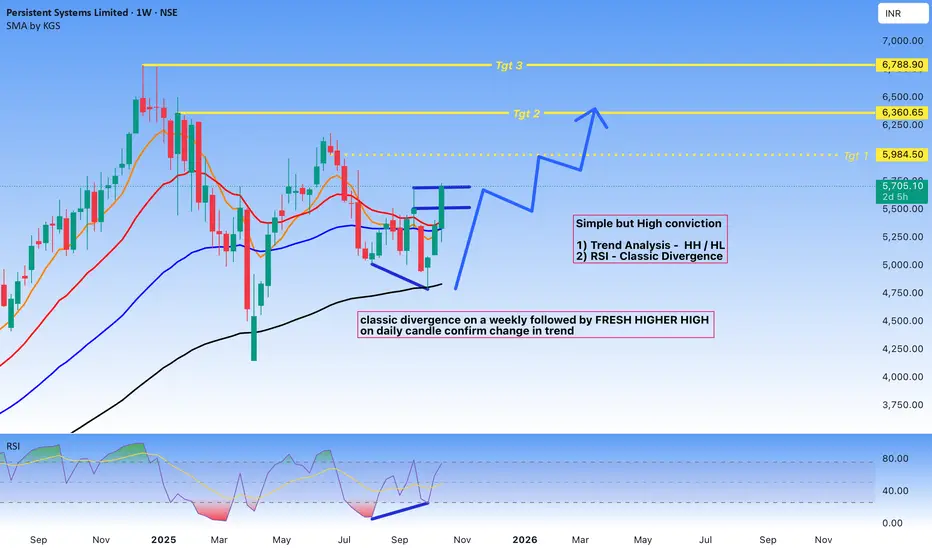
**Timeframe:** Weekly (1W)
**Current Price:** 5,708.20
Technical Setup
Trend Analysis
The chart displays a compelling technical setup based on higher highs and higher lows pattern analysis. After a significant correction from previous highs, the stock has formed a strong base and is showing signs of trend reversal.
Key Observations
RSI Classic Divergence
The Relative Strength Index is displaying a classic bullish divergence pattern. While price action formed lower lows during the correction phase, the RSI formed higher lows, indicating weakening bearish momentum and potential trend reversal. This divergence has been confirmed on the weekly timeframe, adding significant weight to the bullish case.
Fresh Higher High Confirmation:
Following the divergence, price action has broken above the previous swing high on the daily candle, confirming a potential change in trend structure. This break represents a shift from the previous pattern of lower highs and suggests renewed bullish momentum.
Price Targets
The analysis identifies three potential target zones:
- **Target 1:** 5,984.50 (Immediate resistance)
- **Target 2:** 6,360.65 (Medium-term target)
- **Target 3:** 6,788.90 (Extended target)
These targets are derived from previous resistance levels and Fibonacci extension analysis.
Moving Averages:
The chart shows multiple moving averages (likely 50 SMA and 200 SMA based on the red and orange lines). Price is currently attempting to reclaim these key moving averages, which would further validate the bullish thesis.
Risk Considerations
While the technical setup appears favorable, traders should consider:
- Confirmation on higher timeframes for reduced false signal risk
- Volume analysis to validate the breakout
- Proper risk management with stop-loss placement below recent swing lows
## Disclaimer
This is a technical analysis for educational purposes only and should not be considered as financial advice. Always conduct your own research and consult with a qualified financial advisor before making investment decisions. Past performance does not guarantee future results.
Movingaveragestrategy
DHANI : Short Term (1-3 Months) #DHANI #breakout #swingtrade #momentumtrade
DHANI : Weekly Chart
>> Moving Avg Setup
>> Trending Setup
>> Momentum Stock
>> Good Strength & Volumes
>> Good Upside Potential
Swing Traders can lock 10% profit & keep trailing
Best of Setup's can Fail in Current Market Scenario, so Trade Good Setups with Proper Risk Management, position Sizing & logical Stop-loss Rules
Please give a Boost or comment if u r Liking the analysis & Learning from it. Keep showing ur Love by following
Disclaimer : This is not a Trade Recommendations & Charts/ stocks Mentioned are for Learning/Educational Purpose. Do your Own Analysis before Taking positions.
DLong

Morepen Lab - Bullish Flag and Fibonacci RetracementMorepen Lab has formed a bullish flag pattern, and today it has successfully broken out.
The price has retested the Fibonacci level at 38, where it formed a bullish piercing pattern, signaling potential upside momentum.
Price take support of 50 period EMA.
Additionally, this level coincides with a significant demand zone on the chart, suggesting strong buying interest. Keep an eye on this stock for further upward movement

Restaurant Brand AsiaTechnical Analysis:
Over the past year, significant buyer interest has been evident in trading volumes, even as the stock price has been consolidating. The price has consistently maintained support at 90 and is currently fluctuating between 99 and 115, suggesting a phase of accumulation. The positive trading volumes further indicate strong buyer interest.
From a technical standpoint, the MACD on the weekly and monthly charts appears positive, though not particularly robust. However, the key observation is the increasing volume, which highlights sustained buyer interest. Additionally, a trend pattern is gradually forming on the daily and weekly charts.
As always, three resistance levels have been identified. A breakout and sustained movement above the first resistance level (R1) will be crucial in signaling stronger upward momentum in the coming months and years.
Potential Risk:
The primary risk to the stock's upward trajectory is the possibility of a broader market correction, particularly influenced by uncertainty in the Index and geopolitical tensions, such as the ongoing conflict between Israel and Iran.
Disclaimer:
This analysis is intended for educational purposes and is not a recommendation to buy. It is important to learn how to recognize and understand patterns in stock movements.

Paytm : Range Breakout#paytm #swingTrade #Rangebreakout
Paytm : Breakout Candidate
>> Range Breakout soon
>> Trending setup
>> Good Strength & Decent Volumes
>> Low Risk High Reward Trade
Swing Traders can lock 10% profit & keep trailing
Please give a Boost or comment if u r Liking the analysis & Learning from it. Keep showing ur Love by following
Disclaimer : This is not a Trade Recommendations & Charts/ stocks Mentioned are for Learning/Educational Purpose. Do your Own Analysis before Taking positions.

ASKAUTOLTD - 7 Months Consolidation BreakoutASK Automotive Ltd
1) Time Frame - Daily.
2) The Stock has been Consolidating since (November, 2023). Now It has given Consolidation breakout & Closed at it's Life Time High with good volume & good bullish momentum candle in Daily Time Frame.
3) The next resistance would be around the price (390 - 13.90% from the price 342.30).
4) Recommendation - Strong Buy.

CIPLA, Triple Top PatternToday we have an indecisive candle with a high of 1,514,20.
The price has made a triple top pattern.
Tomorrow's candle will clear whether the price has respected the pattern or not.
Trade accordingly.
Disclaimer : This is my pre market analysis and my trading journal. Not a suggestion to buy or sell.

Darvas Box formed in a Pharma Stock (Swing setup for 5 to 6%)Cipla, the price is trading below the long-term group of ema's also we have a bearish cross of ema bands. The degree and nature of separation of both bands indicates price consolidation on these levels. So, we use Darvas Box to trade the instrument.
Short Trade Setup
The breakdown of 1145 will open the lower levels of 1080 which is about 5%
Also we have a confirmation from ema bands.
Long Trade Setup
The breakout of 1200 will open the levels of 1270 which is about 6%
But we need a confirmation from ema bands to trade the uptrend.
Hit the like button!! Show some energy!!
Disclaimer: This is my pre market analysis and my trading journal. Not a suggestion to buy or sell. This material is only for educational purposes.
Thanks
Er. Simranjit Singh Virdi
