#Gold | From Double Top Breakdown to Potential W Reversal#XAUUSD | 4H Chart
Formed an M pattern (Double Top) , broke down, and completed its target ✅
Now taking support at the demand zone, showing early signs of a W-pattern formation (potential bullish reversal).
Support: 3944.43 / 3915.52 / 3892.95-3897.13
Immediate Resistance: 4030.34-4033.87
Key Resistance Levels:
4056.70-4065.52 / 4133.00-4154.79 / 4185.91-4205.12 (previous M-pattern breakdown zone)
Expectation:
If #XAUUSD surpasses 4034 on 4 HCB , price may retest the M-pattern breakdown zone (4185-4205) .
#Gold #XAUUSD #Wpattern #Mpattern #ChartPattern #PriceAction #Commodities
📌 Disclaimer: This analysis is shared for educational purposes only. It is not a buy/sell recommendation. Please do your own research before making any trading decisions.
Mpattern

Gold’s Double Trouble: Will the Bounce Hold or Break Below?#Gold hit a double top after a parabolic rally, topping at 4380.99 and 4381.44 , forming a classic M-pattern . Breakdown below 4185.91 confirmed the bearish structure, and price nearly completed the pattern target by testing the long-term ascending trendline , leading to a technical bounce.
👀 Now, all eyes are on the key zones:
🔸 Critical Resistance: 4185.91 – 4205.12
🔸 Critical Support: 3944.435 (green line)
📉 Break below the support (4HCB) could trigger further bearish continuation .
📈 Break above the resistance zone (4HCB) could open doors to retest All-Time Highs (ATH) .
🧭 These are your trend-deciding levels – stay sharp!
#XAUUSD | #Gold | # TVC:GOLD | #GoldAnalysis | #DoubleTop | #Mpattern | #ChartPatterns | #PriceAction | #TrendDeciderLevels | #KeyLevels | #BullVsBear
📌 Disclaimer: This analysis is shared for educational purposes only. It is not a buy/sell recommendation. Please do your own research before making any trading decisions.

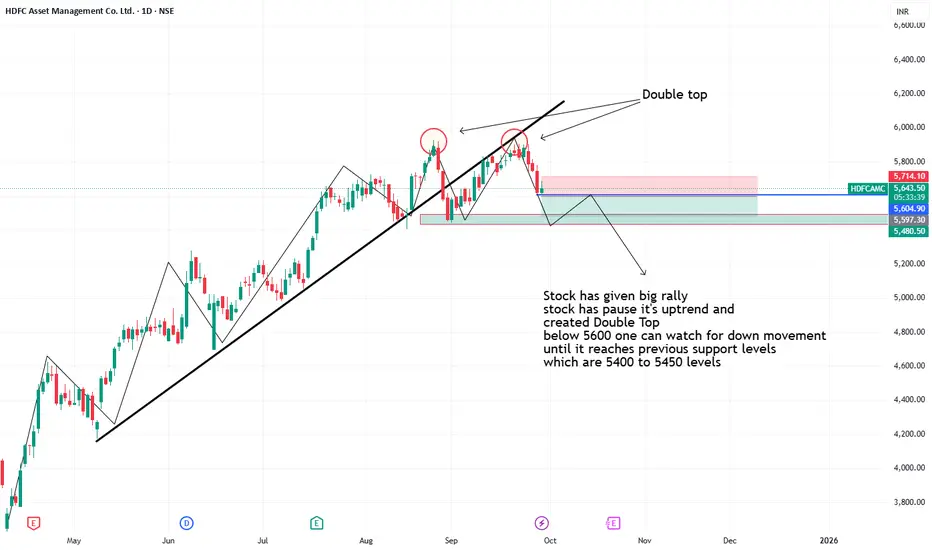
Hdfc created Double Top Formation- Stock has given big rally
- stock has pause it's uptrend and
created Double Top
- below 5600 one can watch for down movement
until it reaches previous support levels
which are 5400 to 5450 levels
Silver (XAGUSD) : M-Pattern completion On a weekly chart, we can see a beautiful M-Structure. Now to complete the M-structure, the price needs to rebound to the neck line and possibly get rejection from the neckline as a resistance and start it move downward.
Keep an eyes on the price action.
Do your own research before taking any trade.

AU Small Finance Bank Analysis! NSE:AUBANK Weekly Analysis!
Double Top Pattern Formation is AUBANK!
Double Top Pattern breakout in AUBANK!
RSI Divergence!
AUBANK crossed 50,100 and 200 EMA, will is leads towards further downtrend?
Analysis:( Only for Pattern Analysis )
NSE:AUBANK formed Double Top Pattern on a Weekly time frame. We can clearly see on the chart that previous trend was uptrend and Double Bottom ideally formed after an uptrend so it's a valid scenario to be move ahead with the Double Bottom or M Pattern. I have done complete analysis on the chart so please have a look on it.
Trade Psychology and Setup:
Entry = Current levels are not good for short(570-580)
Target = 495.70
Stop Loss = 674.95
Disclaimer = All my analysis is for Educational Purposes only.
Before entering into any trade -
1) Educate Yourself
2) Do your research and analysis
3) Define your Risk to Reward ratio
4) Don't trade with full capital

M&M Sell below 1363, Target 1349
M&M Sell below 1363, Target 1349, if breaks 5th June candle low with big volumes then we can see 1318 and 1303. Reason for Trade M pattern formed on Daily Time frame also RSI is looking weak.
Please Note I am not SEBI registered advisor, this is just my view and is for educational purpose. Please consult your financial advisor before taking trade.

GujgasLTD Bearish OpportunityOn 2 hours timeframe it shows double top and max OI call righters. It can be good chance to take entry once it complete full solid red candle today.
GShort

intradayboth side potential
Keep an eye on 200 EMA
avoid first 15min breakout
wait for 15 min candle closing
targets are marked
if the breakout comes after 10:00 am then the probability of winning will be more.
follow risk management
do your own analysis
do workout
do meditation
start reading books

BioCon: Bearish formationNSE:BIOCON made an M pattern. But looking at the volume and the momentum, it seems the more selling will happen.
But if it bounces, then buy is also possible.
So both sides trade:
Trade: Buy above 280, SL: 276, T: 284/286
Sell below 272, SL: 276, T: 269/266

Divergence in 15Mins chart of IEXRecently observed divergence in price and RSI value of 15mins chart. plus it seems like a possible M pattern breakout if the price closes below 162. All targets are mentioned on the chart. Do your own analysis before making financial decision. NSE:IEX

TCS 15 Min ViewIn TCS we are seeing ascending triangle pattern. wait for the proper breakout, at the same time movement is not that much powerful, that's why we are seeing M PATTERN also, so wait for proper breakdown with volumn. This is just a view not a recommendation to trade. Trade at your own risk management.

ICICIGI ICICIGI Corrected 28% from an all-time high, 1200 level act as a strong support zone if 1200 level break it will fall further 10% to 15%, so be cautious

M pattern B/O in Tata Steel I feel to see M pattern in Tata Steel chart shared Below feels like a Big Move Thats couldn’t sustain before.
REFFER
mages.app.goo.gl/UuDKGMyxHYhKA6ZP8


Weekly Chart for Sapphire Food:M PatternBearish Pattern formed On weekly chart.
CMP1140
Target 1070/767
SL1200


M Pattern In Lal Path LabEverything Explained On Chart As Its Making M Pattern Which Is Very Profitable setup and can give good momentum downside as well

#DRREDDY Monthly bullish Weekly bearish#DRREDDY Look at the monthly for the "good" cup and handle pattern with a bullish reverse momentum divergence. Now look the weekly for the bad/ugly where it is forming a double top and approach neckline. To go for long or short depend on your time horizon for the trade.

#hdfcbank heading further south?#hdfcbank heading south. it slid from the year long trendline channel post q1 results and then
M pattern neckline broke off earlier to set loose the slide and now lost the Fibonacci 50 retracement level 61%
also along with a below 40 rsi bearish momentum. Twice of double bottom could take the FII darling till 1360?

Auto Sector M pattern neckline brokenAuto Sector M pattern neckline broken. is it heading to break the weekly one.?

Short eur/usd as soon as trendline breaks and retest As of COT reports, it is very likely to be a bearish move, but taking entry must be precise to take the good risk-reward ratio
PROBABILITY ALWAYS WINS

Double top or M pattern ? - Tata motorsNSE:TATAMOTORS is forming Double Top or you can say M pattern on 15 min chart .. which is considered as extremely bearish.
Levels are mentioned in the chart
To be safe
Short below : 289
Target : 282 or below
P.s : I am still in learning phase ... all the critics are appreciated .. please let me know if i am wrong.
Note : This is for educational purpose only ... and i am not giving any Trade advice.
