Bigger Stoploss wont save you in the markets ? ( Proof ) I have used older than 3 months chart to explain a concept / bias here - keeping bigger stoploss will save your trade ? No , that is a big lie, watch the video to understand .
Mtfanalysis

Unlocking Pure Price Action MasteryHistorical Price action points ( No bias - No Forecasting )
Spot the red supply zone at the top—respected like clockwork on this weekly chart.
That crisp white solid line? It's the monthly high range difference (zoom to the right-hand monthly view to see it clearly)—a subtle gem most miss.
The solid red boundary line proves its strength: over four touches from deep consolidation, holding firm every time.
Enter the green dotted resistance line—a hidden powerhouse between patterns, key for spotting true breakouts historically.
Finally, the dotted white parallel channel (hidden but deadly accurate): price bounces perfectly off the upper resistance and lower support, channelling the action beautifully.
This is price action in its raw form—pure, unfiltered respect for key levels.
Disclaimer: Past performance is not indicative of future results. Trade at your own risk; this is for educational purposes only.

When Price Respects Structure: MTFAThis post is not a forecast and not a trade idea.
It’s simply a visual study of how price behaves when multiple higher-timeframe elements overlap.
Using historical price action only, this chart highlights:
-Monthly Fair Value Gap (Green Zone)
Showing how price reacts, respects, and rebalances inefficiencies over time.
-Monthly Supply Zone (Red Zone)
Clearly defining areas where price historically showed strong selling interest.
-Higher Timeframe Symmetrical Triangle (Green Lines)
Drawn from a broader weekly structure, showcasing compression and balance in price.
-Internal Counter Trend Line (White Line)
Capturing the internal rhythm and reactions within the larger structure.
What stands out is how price continuously respects these elements:
-Multiple reactions at the fair value gap
-Clean interaction with supply
-Price oscillating within structure rather than moving randomly
Disclaimer:
This post is strictly for educational and illustrative purposes only.
It does not represent any buy/sell recommendation, forecast, or financial advice.
All markings are based on historical price data to demonstrate price action behavior.

Difference btw Beginner, Pro and Full time Traders ( Mtfa view )In this Big 20 minutes video, I will try to explain the most beautfull conept of Multi time frame analysis from the perspective of 4 different types of trader .
Charts used are older than 3 months

Price action understanding that will change the way you tradeI make educational content videos for swing trading . In this video I have used concepts like Trendlines, Counter trendlines, zones, Support and Resistance, Market fall, Targets and Exit plan for any trade setup and most importantly use of lines with multi time frame analysis .
Charts used are 3 months or older

This Multi time frame Trick will save you from FAKEOUTSIn this video I am showcasing a daily, weekly and monthly time frame combination - also sharing a trick which can save you a lot of money from those regular sized fakeouts .
Charts used are 3 months old in this video and video is purely educational based .

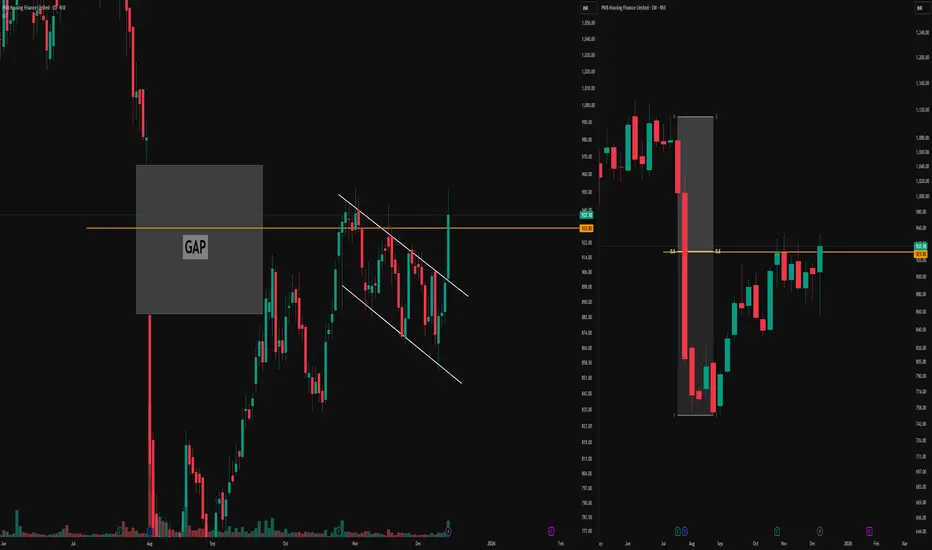
Parallel Channel, Stubborn Gap & 0.5 Equilibrium RejectionDaily Timeframe Details
The left chart on the daily timeframe displays a parallel channel structure forming after an initial one-sided move.
A significant gap emerged within this leg, which price has approached multiple times—first entering the gap area from below but rejecting sharply to form a higher low, then pushing toward a higher high without fully filling it.
This illustrates how gaps often resist easy fills from either direction, acting as persistent reference zones that demand confluence for interaction.
Weekly Timeframe Context
The right chart provides the weekly timeframe for the same instrument, highlighting repeated rejections at the 0.5 equilibrium level.
These weekly rejections align precisely with the daily gap interactions and channel boundaries, demonstrating how higher-timeframe equilibrium can underpin lower-timeframe price behavior without implying direction.
Such multi-timeframe alignment offers educational insight into structural references in market analysis.
This post serves purely educational and observational purposes and does not constitute buy, sell, or investment advice. Always conduct your own research.
Always check the Higher Time frame but WHY ?I make educational content videos and Posts for Swing Trading based ideas - concepts and my full time trading experience .

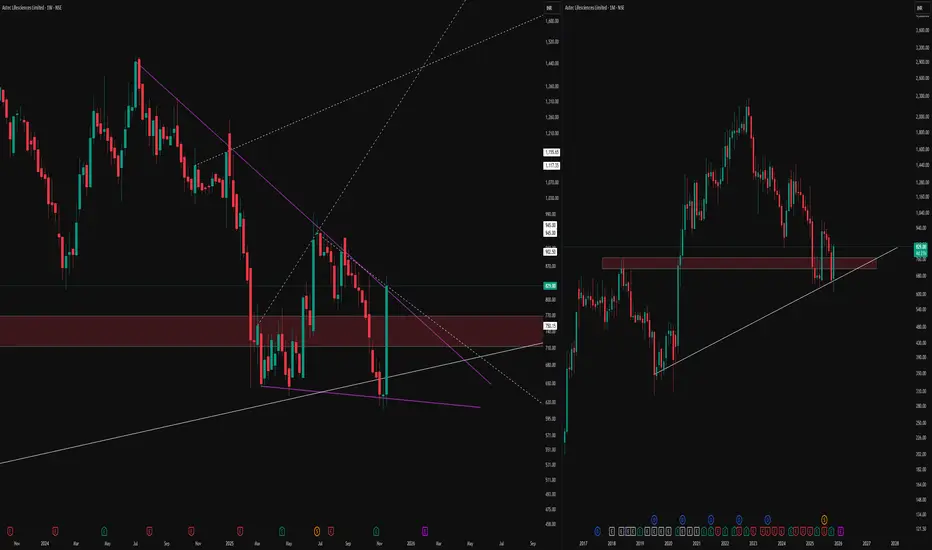
How to Observe Weekly and Monthly Chart StructureThe weekly (left) and monthly (right) timeframes, bringing attention to a confluence zone of technical interest.
On the weekly chart, price has developed a compressing pattern, defined by distinct purple lines, with dotted lines marking hidden channel boundaries and long-term levels for context. The highlighted supply-demand zone reflects previous market activity, where buyers and sellers actively shaped reversals and consolidations.
On the monthly timeframe, the same zone aligns with an established rising trendline support, indicating an area where price has historically responded with high volume and volatility. Multiple timeframe alignment and proximity to major horizontal structures
No forecasts or breakout signals are implied; the focus is on mapping price responses and monitoring structure, not predicting direction. Consistent observation of these overlapping technical factors may help traders build sound trading hypotheses in line with their individual strategies.
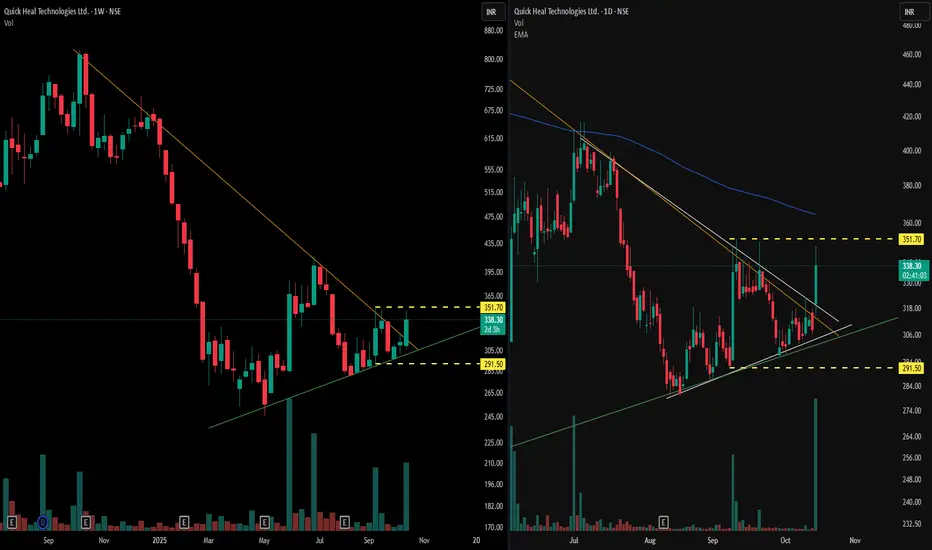
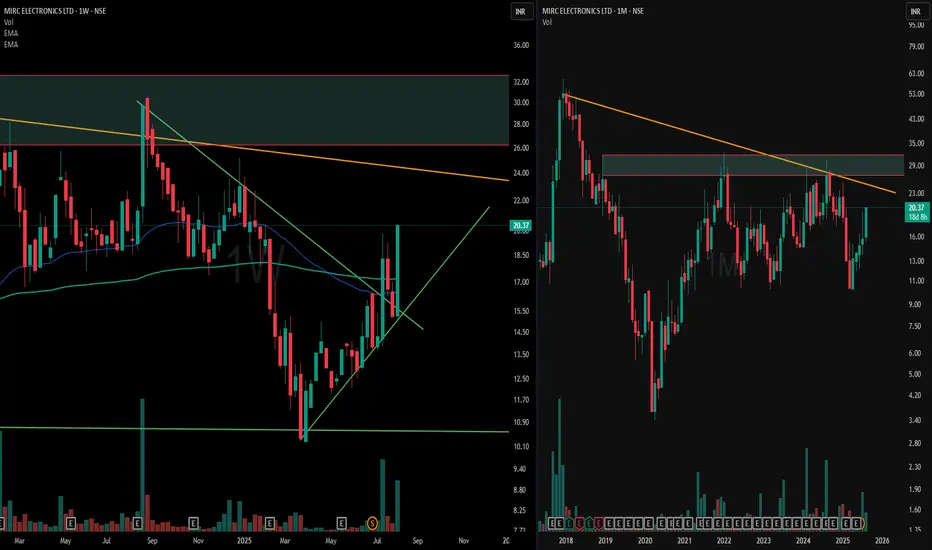
Multi-Timeframe VCP Observations📊 Weekly Time Frame Observations (left panel)
- It displays a visible pattern contraction structure, specifically a Volatility Contraction Pattern (VCP), formed over multiple months
- An orange trendline marking the descending resistance, and a green line depicting the rising support, which together highlight the range contraction of price
- Volume spikes coincide with specific price responses at these zones, denoting heightened activity during volatility periods within the VCP
📈 Daily Time Frame Observations (right panel)
- Presents a more compressed Volatility Contraction Pattern (VCP), mirroring the broader weekly setup but over a shorter time span.
- Below the blue 200-day exponential moving average
❗ Disclaimer: The above post is strictly observational and does not constitute any trading advice or predictions regarding breakout or price direction.
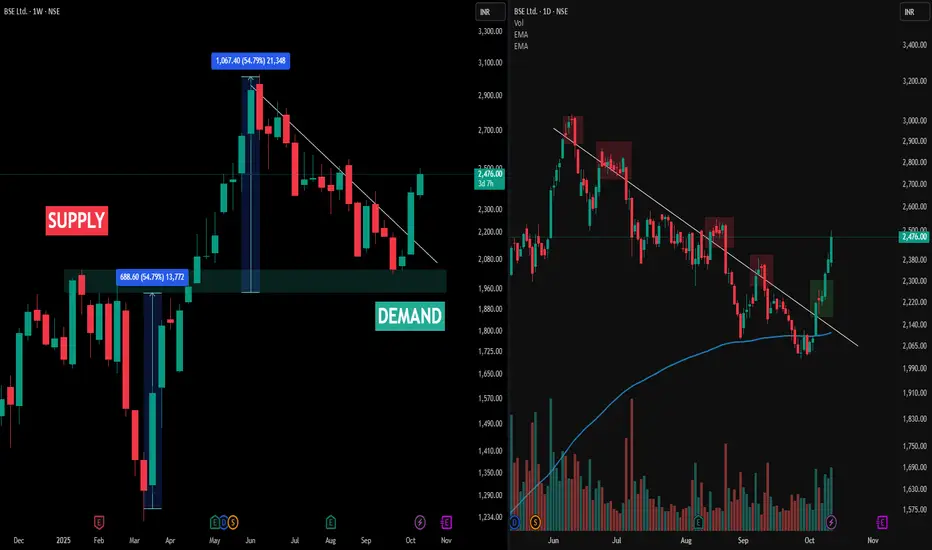
Multi-Timeframe Observation: BSE Ltd• The image above presents a multi-timeframe view of BSE Ltd (NSE), with the left side displaying the Weekly Timeframe (WTF) chart and the right side showing the Daily Timeframe (DTF) chart. The weekly chart highlights the main demand and supply zones, with large upward moves originating from demand and visible percentage swings marked for clarity.
• A key observation is the Change of Trend (CT) line. On the weekly chart (left), price action repeatedly challenged but never closed above the CT, indicating resistance at this structural level. This is confirmed on the daily chart (right), where each significant upward move into the CT region is marked by red boxes—showing failed attempts to sustain above the CT and repeated rejections.
• The green box on the daily chart points to a recent bounce from demand, but the price still faces resistance at the CT as per the weekly structure. Consistent volume activity and price response across both timeframes offer a crystal clear illustration of trend dynamics and supply-demand interplay. The post is strictly an analytical observation of price structure, not a prediction or recommendation.
Disclaimer
This post is intended for observational and educational purposes only. It does not constitute financial advice or recommend any trading action. Please consult a certified financial advisor and conduct your own research before making investment decisions.
From Breakdown to Structure: A Tale of Two Timeframes📊 Left Chart – Weekly Timeframe (WTF)
Price shifted from a series of lower highs/lows to forming a W-bottom entirely below the 200 & 50 EMA. Post-recovery, it moved into a channel consolidation, held by a green ascending support and capped by a green counter-trendline, creating a clean geometric structure.
📈 Right Chart – Monthly Timeframe (MTF)
A broader view reveals multi-fold hindrances, with red & orange trendlines marking a multi-year counter-trend. Each upside push faces historical resistance near the supply zone.
📝 Editorial Note:
Not a forecast — simply a snapshot of evolving structure from compressed weekly action to obstacle-heavy monthly context.
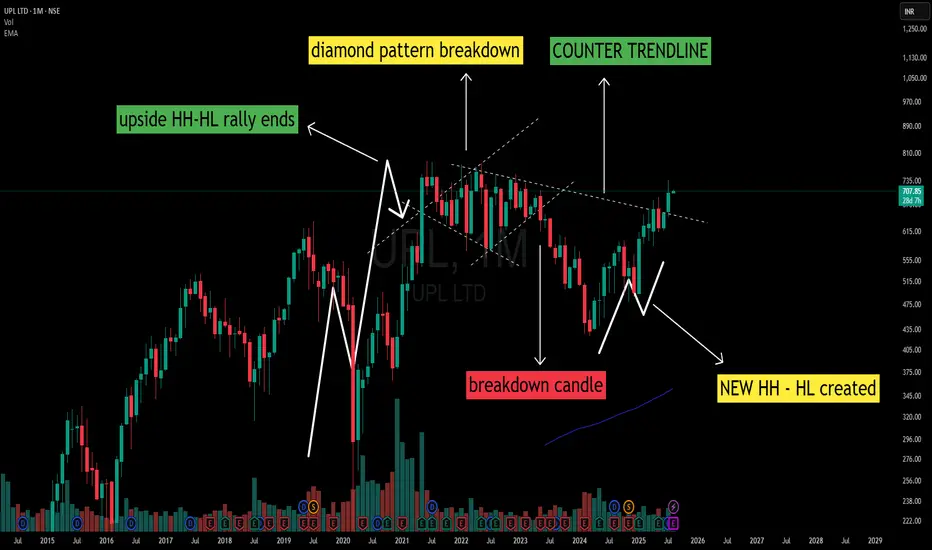
UPL – Diamond Pattern Breakdown to W-Bottom Reversal The monthly chart of UPL reflects a complete structural cycle:
1️⃣ Uptrend Phase:
A clear sequence of Higher Highs – Higher Lows (HH-HL) marked the early rally.
2️⃣ Diamond Pattern at Peak:
A diamond-shaped consolidation developed at the top of the rally, a common occurrence near trend maturity.
3️⃣ Breakdown & Downtrend:
A breakdown candle from the diamond pattern initiated a period of Lower Highs – Lower Lows (LH-LL), establishing a sustained downtrend.
4️⃣ W-Bottom Formation:
At the lower structure, a W-bottom emerged with Higher Low formation followed by a Higher High, indicating a structural shift.
5️⃣ Counter Trendline Interaction:
The earlier diamond pattern boundary has evolved into a counter trendline, now serving as an important structural reference zone.
📌 Observation:
The counter trendline remains a key structural reference on higher timeframes. This is a technical observation and not a directional view.
Mastering Multi Time Frame Analysis | Swing and Intraday TradingWhether you're a price action trader or rely on indicators, mastering Multi Time Frame (MTF) Analysis can transform your swing and intraday trading decisions. In this video, I break down how to use MTF effectively to align your entries, spot fakeouts, and trade with higher conviction.

RTNPOWER – A Classic Price Action Study Around Major Trendlines🟦 Dotted Blue Line
Represents the main counter trendline, stretched over a significant duration. Price has currently pushed above it, but the weekly candle is still open.
⬜ White Line (Hidden CT)
A hidden resistance line, drawn from key lower highs. Price is currently reacting near this line — acting as a logical area where sellers might test control ( for my setups )
🟨 Yellow Zones
These levels highlight higher lows, a sign of evolving structure. These bases often add context to the strength behind a breakout move.
🔴 Red Line (MTF Resistance)
Plotted from historical monthly rejection zones — a crucial area for confluence and reaction.
🛠️ Only sharing my Charting — no recommendations, no forecasting .

Multi time frame charting explained in GEPILI make educational content videos for swing / positional trading
GLong

Support Flips, Trendline Snaps — Weekly Chart Speaks!A counter-trendline breakout (white line) is underway on the Weekly Time Frame (WTF), supported by strong structural confluences:
🔹 Pattern size is substantial, with price consolidating for several months before breakout.
🔹 The yellow zone represents a prior support, which later broke down — now acting as a resistance-turned-breakout zone, a classic supply flip.
🔹 Recent breakout candle shows strength, emerging after taking support from the 200 DEMA, reinforcing the base.
🔹 MTF resistance (dashed yellow line) is marked — remains the next significant obstacle on higher timeframes.
No trading/investment advice. Purely educational .

Miss This Retest and You’ll Miss the Rally – CUPID Setup Explain🔴 A – Supply-Demand Conversion Zone
This is the heart of the setup. When price trades below this zone, we stay cautious or short on weak structures. But if it sustains above this, it becomes the launchpad for longs—provided all system conditions align
🟠 B – Ideal Retest Zone
We anticipate a retracement here. A healthy correction towards A zone to tap into fresh demand. This retest is essential to build a valid higher low before breaking out.
🟣 C – All-Time High (ATH) Supply Zone
The ultimate target and strong resistance zone. If our breakout from E happens cleanly, this becomes the next significant level to watch—potential partial booking zone.
🟡 D – Hidden Resistance (WTF)
Subtle yet powerful. This line isn’t obvious to many but holds weight in our top-down analysis. If price cleanly breaks this, it adds conviction to the momentum.
⚪ E – Weekly CT Line
The main trigger. We want price to pull back (B), form a strong base (A), and then break E with a power candle, backed by strong volume
📊 Current Status:
✅ Price above A (bullish tilt activated)
❌ No proper retest at B yet
🔜 Awaiting clean breakout of E post-retest
📌 Hidden resistance D and supply C remain above as Resistances / Hurdles after our Breakout

Big Bank BREAKOUT! Canara Bank Ready📉 Breakdown of the Setup:
✅ WTF CT (White Lines): 3+ confirmed touches → clean descending counter-trendline.
✅ Hidden Resistance (Dotted White Line): Clear breakout above key hidden level. Historic reaction zone.
✅ MTF Resistance (Yellow Line): Long-term resistance just above; nearing test zone (confluence resistance area ahead).
✅ Green Zone (Support/Resistance Flip):
Acted as strong support in 2024.
Fake breakdown trap ✔️
Price back above = bullish bias reinstated.
✅ Volume Surge: 124M+ on breakout candle ➕ major bullish close.

SBICARD | Monthly Timeframe Analysis🔥 Technical Breakout with a Strong Rejection Wick!
🔸 Parallel Channel Breakout
Price has convincingly broken out of a long-standing parallel descending channel (orange) — a bullish signal indicating a potential trend reversal.
🔸 Counter Trendline Broken
The white counter-trendline was broken earlier, leading to bullish momentum building up gradually. This breakout aligns with classic reversal theory.
🔸 Supply-Demand Flip Zone (Grey Box)
The price action respected the SUPPLY → DEMAND zone beautifully before launching upward, confirming it as a key area of interest.
🔸 Long Wick Rejection Candle
Notice the most recent monthly candle: a long lower wick with a strong body, closing near the highs.
🟠 Parallel Channel
⚪ Counter Trendline
⚫ Grey Supply-Demand Zone
🟥 Top Supply Zone
🟢 Bullish Rejection Candle

Multi time frame Simple analysis on SHKI make educational content videos for swing / positional trading

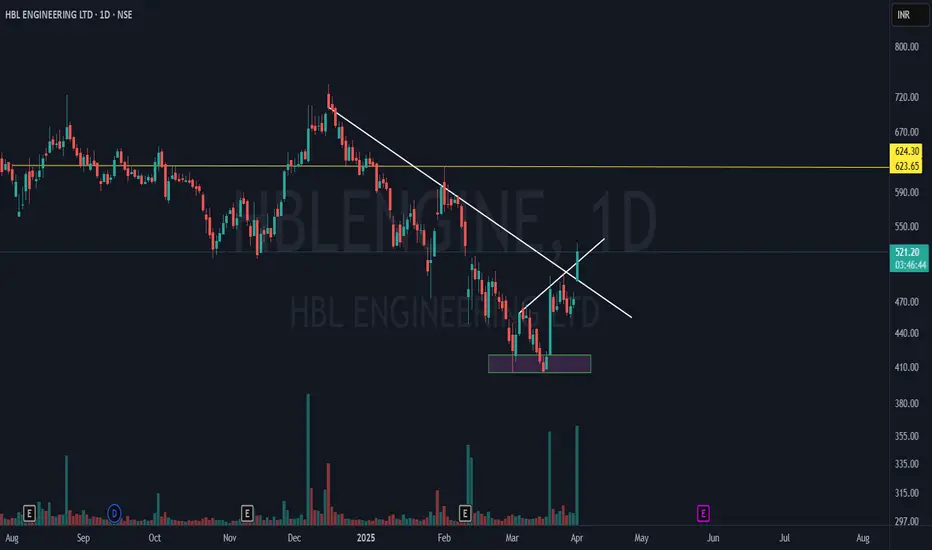
Hbl Engineering | Multi-Timeframe Breakout & Hidden Hurdles📈 Stock: HBL ENGINEERING LTD (NSE)
💰 CMP: ₹520.10 (+10.07%) - While making this Post
Key Highlights:
✅ Breakaway Gap: Opened above Critical Trendline (CT) resistance, confirming strength.
✅ Hidden Hurdle Cleared: The smaller trendline helped identify fakeouts vs. real breakouts.
✅ Strong Volume: High buying interest signals institutional participation.
✅ Next Resistance: ₹624.30 (MTF Hurdle) – a key level to watch.
🚀 Now watch for follow-through! Thoughts? Drop them below! 👇
Mother Candle & Counter Trendline Breakout | NAVA LTD📊 Technical Breakout Overview:
🔹 Mother Candle Breakout on the Weekly Timeframe – Strong bullish momentum!
🔹 Red Line (Weekly Counter Trendline) – Clean breakout, confirming trend reversal.
🔹 Yellow Dotted Line (MTF Resistance Counter Line) – Broken decisively.
🔹 Blue Line (MTF Major Resistance) – Next big target zone at ₹574.70.
