Hindalco BreakoutA beautiful positional breakout seen in Hindalco today along-with volume confirmation. Aluminium stocks in focus. Waiting to see the upcoming trend next week !!!
Nalco

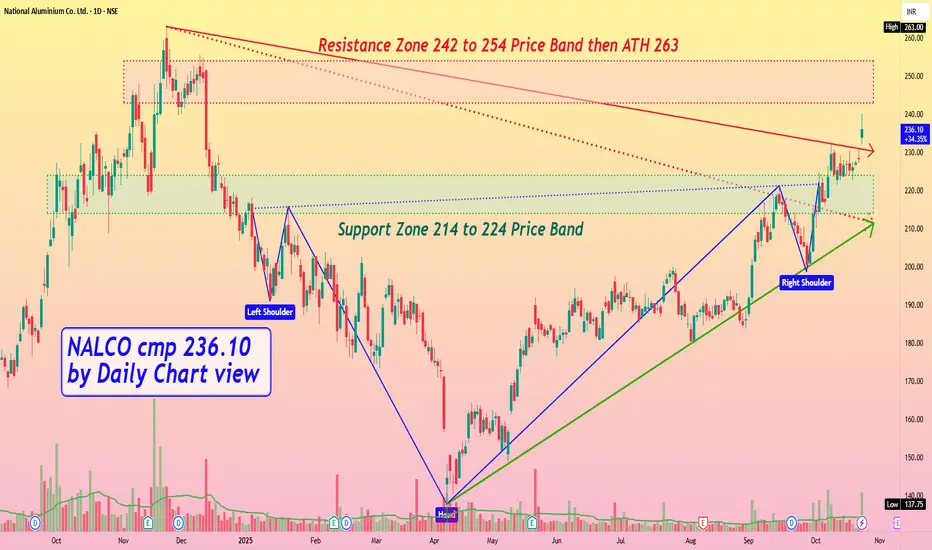
NALCO cmp 236.10 by Daily Chart viewNALCO cmp 236.10 by Daily Chart view
- Support Zone 214 to 224 Price Band
- Resistance Zone 242 to 254 Price Band then ATH 263
- Bullish Head & Shoulders completed by Support Zone neckline
- Dotted Falling Resistance Trendline Breakout has well sustained
- Falling Resistance Trendline Breakout attempted and work in progress
- Volumes spiking intermittently over past few days by close sync with avg traded qty
Two Precision Setups for a Major Move | Breakout vs. ReboundChart: NSE:NALCO | Daily Timeframe
📈 Executive Summary:
Nalco Ltd. is at a technical crossroads, compressed between a massive 12-month descending trendline and a rock-solid multi-touch support zone. This creates two high-probability, well-defined trading opportunities for both momentum and value traders. The key for both setups will be confirmation with above-average volume.
🔥 Scenario 1: The Mega Breakout (Momentum Play)
This setup capitalizes on a decisive shift in long-term trend dynamics.
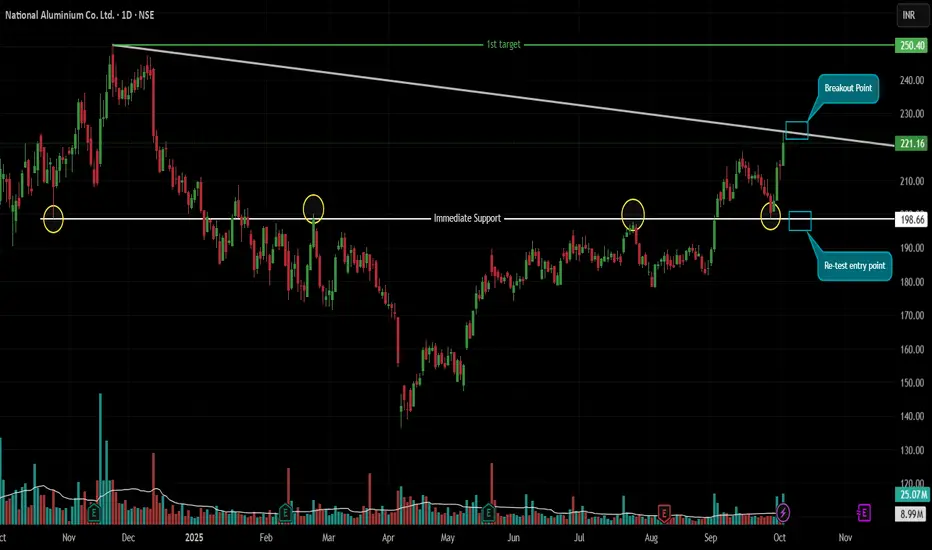
The Structure: A dominant Descending Trendline connects the November 2024 high (₹250) with the recent October 2025 high (₹225). This line has contained all major rallies for nearly a year.
The Trigger & Confirmation: A strong, 'big green' daily candle that closes decisively above ₹225. This move must be supported by above-average volume to confirm genuine buying interest and not a false breakout.
The Logic: A breakout from such a long-standing consolidation has the potential to unleash significant pent-up momentum, targeting the previous major high.
🎯 Trading Plan (Breakout):
🎯 Entry: On a daily close above ₹225, confirmed by above-average volume.
⛔ Stop Loss: Low of the breakout candle. This pragmatic level protects against a false breakout and allows for a tight, logical risk definition.
🎯 Target: ₹250 (The origin point of the trendline, acting as a logical and psychological target).
⚖️ Risk-Reward: Highly favorable, estimated above 1:3.
🛡️ Scenario 2: The Support Bounce (Value Play)
This is a classic "buy low, sell high" strategy at a proven demand zone.
The Structure: The ₹199 level is a historic support and resistance zone, tested multiple times since October 2024. It currently acts as a strong support floor.
The Trigger & Confirmation: The price must retrace and hold the ₹199-202 zone and then form a clear bullish reversal candlestick pattern (e.g., Hammer, Bullish Engulfing) with above-average volume on the daily timeframe.
The Logic: Entering at a proven support level with a candlestick confirmation provides a high-probability entry with an excellent risk-to-reward profile.
🎯 Trading Plan (Support Bounce):
🎯 Entry: On the confirmation of the bullish candlestick pattern (e.g., a close above the high of the pattern's candle) in the ₹199-202 zone, with volume confirmation.
⛔ Stop Loss: Low of the identified reversal candlestick pattern. This minimizes risk by invalidating the setup if the support fails immediately.
🎯 Target 1: 1:1 Risk-Reward Level (e.g., if risk is ₹5, target is Entry + ₹5).
🎯 Target 2: ₹225 (The recent swing high and trendline resistance). Once Target 1 is hit, trail the stop loss to lock in profits and ride the move towards ₹225.
Key Levels At a Glance:
All-Out Resistance: ₹225 (The 12-Month Trendline)
Foundational Support: ₹199 (The Multi-Touch Zone)
Breakout Target: ₹250
Support Bounce Target: ₹210-225
Final Note: Both setups require patience and discipline. Wait for the specific trigger and volume confirmation. Do not pre-empt the trade.
Disclaimer: This idea represents a technical analysis perspective and is not financial advice. All trading decisions carry risk. Please perform your own due diligence.
NALCO (D) - Challenges Major Resistance with Strong MomentumNational Aluminium is making a powerful attempt to break through a major resistance level that has previously thwarted several breakout attempts. The stock surged +4.88% today, closing at ₹213.87 on the back of exceptionally high trading volume, signaling strong buyer interest at this critical juncture.
This move is part of a broader uptrend that began in April 2025, which itself was a reversal from a downtrend following the stock's All-Time High in November 2024.
Broad-Based Bullish Signals Building 👍
The underlying technical picture is strong and showing signs of further improvement:
- Confirmed Long-Term Strength: The short-term Exponential Moving Averages (EMAs) are in a bullish crossover state on both the monthly and weekly charts. The Relative Strength Index (RSI) also confirms a bullish crossover on the weekly chart.
- Developing Daily Momentum: On the daily chart, both the EMAs and RSI are on the verge of a bullish crossover , which would provide immediate-term confirmation. The monthly RSI is in a similar poised-to-cross state.
- Volume Thrust: Today's price surge was driven by massive volume , indicating a high level of conviction from buyers.
Outlook: Awaiting a Decisive Breakout
The stock is at a pivotal point. While the indicators are overwhelmingly bullish, a confirmed close above the current resistance is necessary.
- Bullish Case 📈: If the stock successfully breaks and sustains its position above the key resistance, especially on good volume, the next potential price target is the ₹245 level.
- Bearish Case 📉: If it is rejected at this resistance once again and momentum fades, the stock could pull back to find support near the ₹195 level.

NALCO all set to touch 260 soon
CUP formation complete & consolidation at the resistance.
RSI has begun to show strength.
CMP: 192.41, TGT 260 SL: 170

NALCO all set for a 10% upside soonCUP formation complete in W
Resistance at 200.
Inside a channel pattern.
RSI strength with divergence.
MA supports.
TGT:250, CMP: 192, SL: 180

NALCO Breaking Major Key LevelsNSE:NATIONALUM is Breaking Major Key Levels today with rising Volumes in the Past Few Days.
Keep in Radar.
Check out my other stock ideas below until this trade gets activated, I would love your feedback.
Disclaimer: This analysis is intended solely for informational and educational purposes and should not be interpreted as financial advice. It is advisable to consult a qualified financial advisor or conduct thorough research before making investment decisions.

Technical Analysis of LME INDEX Based on Elliott WavesTechnical Analysis of LME INDEX Based on Elliott Waves
The information provided in this response is based on the analysis of the Elliott Wave chart and does not constitute financial advice. The author is not responsible for any investment gains or losses incurred by individuals who rely on this information.
Elliott Wave Theory is a technical analysis method that identifies recurring patterns in financial markets. These patterns, known as Elliott Waves, are based on the idea that human psychology and behavior drive market movements.
Key Elliott Wave Principles:
Five-Wave Impulse: A five-wave pattern that represents an uptrend or downtrend.
Three-Wave Correction: A three-wave pattern that represents a pause or reversal in the trend.
Fibonacci Relationships: Numerical relationships between different waves, often expressed as ratios (e.g., 0.618, 1.618).
Analysis of the LME INDEX Chart:
Based on the provided Elliott Wave chart, it appears that the LME INDEX is currently in the early stages of an impulse wave structure. This suggests a strong uptrend is underway.
Specific Observations:
Wave 1: The initial upwave has likely been completed.
Wave 2: A corrective pullback also looking done.
Wave 3: The next wave is expected to be a powerful extension of the uptrend.
Impact on Commodities and Indian Metal Stocks:
The LME INDEX is a crucial benchmark for the metals market. Its price movements can significantly impact the prices of individual metals and related commodities. Indian metal stocks, such as Vedanta, NALCO, and Hindustan Zinc, are directly influenced by the LME INDEX.
Educational Purpose:
It's important to emphasize that this analysis is for educational purposes only and should not be considered as trading advice. The financial markets are volatile, and past performance does not guarantee future results. Investors should conduct their own research and consult with financial advisors before making any investment decisions.
I am not sebi registered analyst. My studies are for educational purpose only. Please Consult your financial advisor before trading or investing. I am not responsible for any kinds of your profits and your losses.
Most investors treat trading as a hobby because they have a full-time job doing something else.
However, If you treat trading like a business, it will pay you like a business.
If you treat like a hobby, hobbies don't pay, they cost you...!
Hope this post is helpful to community
Thanks
RK💕
Disclaimer and Risk Warning.
The analysis and discussion provided on in.tradingview.com is intended for educational purposes only and should not be relied upon for trading decisions. RK_Charts is not an investment adviser and the information provided here should not be taken as professional investment advice. Before buying or selling any investments, securities, or precious metals, it is recommended that you conduct your own due diligence. RK_Charts does not share in your profits and will not take responsibility for any losses you may incur. So Please Consult your financial advisor before trading or investing.

*National Aluminum cmp 207.04 by Monthly Chart since listed**National Aluminum cmp 207.04 by Monthly Chart view since listed*
- Weekly basis Support at 192 > 169 > 143 with Resistance only at ATH 212.40
- Volumes steady over past few weeks and supportive for more beyond ATH 212.40 done today
- *Stock chart has formed back to back Bullish Rounding Bottoms with the neckline at Support Zone*

National aluminium multi pattern trade idea National Aluminium trades within a broader rising wedge pattern, marked by the red lines. A counter-trendline (solid white line) also comes into play, indicating a shorter-term resistance zone. The stock recently broke through one of the dotted hidden lines, but it's still facing resistance from the upper hidden trendline, keeping it just below a key breakout point. The formation of higher lows, highlighted by the yellow circles, signifies strength in price action and building momentum.
Today's volume surge, notably higher than average, adds weight to the bullish sentiment. However, a significant breakout could only be confirmed once the price clears the last hidden line of resistance. Watching closely for this potential move

NALCO retested earlier BO NALCO a PSU CMP 184 retested the 170 zone after touching 206.Seems ready to touch the earlier high and break the ATH levels. Can be held for long term and add more if comes back to 165-170 levels.
Please check with ur financial adviser before investing.

Short Term Trading Idea in National Aluminum for > 20% UpHi,
NSE:NATIONALUM has given a Bullish Flag Breakout on Daily charts with very good volume.
MACD is also on the bullish side on daily, weekly and Monthly time frames. RSI is also on the bullish side on daily and weekly time frames.
In the current market scenario, I am expecting that the bullish momentum will continue.
Complete price projection like entry, stop loss on Daily Closing basis and targets mentioned on the charts for educational purpose.
Don't Forget to Follow me to get all the updates.
Please share your feedback or any queries on the study.
Disclaimer: Please consult your financial advisor before making any investment decision.

DO NOT MISS THIS PRE BREAKOUT TRADE!We have seen in past how consolidation breakouts always give rocket moves.
One such pre breakout consolidation trade is NALCO
If this stock manages to sustain above 140, we will enter mad bull run in this stock.
It is always safe to enter before breakout since we get an option to partially book and trail SL post breakout.
Levels mentioned on chart. I hope you all can get to ride this share with me if this breaks out.

Nifty Metal: Metal stocks ready to flyMetal sector: Nifty metals has not shown much rally but as per time cycle this sector seems to be ready to fly in next few days/weeks. My Preferred picks are: Jsw steel, Nalco, jspl.

National Aluminium looking bullish ahead as per wave structureHello Friends,
Here we had shared possible Elliott wave counts of National Aluminium chart, on daily time frame, which is clearly indicating that above 66.95 major support level it is purely in an impulsive phase.
According to the Elliott wave structure, the price chart has exhibited the following patterns:
The initial phase consisted of an upward impulse movement, representing a larger wave marked as ((1)). Subsequently, a significant correction took place, forming wave 5 within wave (C) of the larger wave ((2)). This correction reached its lowest point in July 2022 at a price level of 66.95.
Currently, there are indications that we have entered and started the larger wave ((3)). Within this wave, we are currently witnessing the development of wave (1), which is expected to unfold in five sub-waves. The first two sub-waves, 1 and 2, have already been completed.
Looking ahead, we anticipate a northward movement as wave 3 within wave (1) of the larger wave ((3)). We have already experienced sub-waves (i) and (ii) within wave 3, and we are now potentially prepared for an upward surge as wave (iii) of 3, within wave 1 of the larger wave ((3)).
Elliott wave structure mentioned on chart shared below
Breakout with very good intensity of Volumes
My studies are for educational purpose only. Please Consult your financial advisor before trading or investing. I an not Sebi registered analyst, and I am not responsible for any kinds of your profits and your losses.
Thanks
RK💕
Most investors treat trading as a hobby because they have a full-time job doing something else.
However, If you treat trading like a business, it will pay you like a business.
If you treat like a hobby, hobbies don't pay, they cost you...!
Disclaimer and Risk Warning.
The analysis and discussion provided on in.tradingview.com/u/RK_Charts/ is intended for educational purposes only and should not be relied upon for trading decisions. RK_Charts is not an investment adviser and the information provided here should not be taken as professional investment advice. Before buying or selling any investments, securities, or precious metals, it is recommended that you conduct your own due diligence. RK_Charts does not share in your profits and will not take responsibility for any losses you may incur. So Please Consult your financial advisor before trading or investing.

Metal Index Above 6000 other metals should come out 4 good moveMetal Index Above 6000 other metals should come out for good move
Jindal Steel
JSW Steel
Vedanta
Nalco
Sail
Hindalco
Vedanta
Do teen attempt hogaya one more time 🤞this time it may break the zone

"NATIONALUM" crossing crucial Fibonacci levels.NSE:NATIONALUM has been above 0.50 Fibonacci levels and MACD and STOC RSI also are in the positive note.
TARGET 1 : 84.25
TARGET 2: 86.75
STOP LOSS : 78.55
Disclaimer: The following information is for educational and informational purposes only and should not be construed as financial advice or a recommendation to buy, sell or hold any stock or investment. Technical analysis is a method of evaluating securities by analyzing statistics generated by market activity, such as past prices and volume. However, the future performance of a stock or investment cannot be guaranteed based on technical analysis alone, and other factors, such as economic conditions and company fundamentals, should be considered when making investment decisions. Before making any investment decisions, please consult with a licensed financial advisor and conduct your own research to determine if an investment is suitable for your individual circumstances and risk tolerance. Past performance is not indicative of future results, and investing involves risk, including the possible loss of principal.

National Aluminum, NALCO (Long)NALCO for long-term.
Stock near 52WK low in price bound range (67-81) since June 22.
Fundamentals: Good
Technical: Cup formation
Target: 81/88/98
Resistance: 67
If held for more than 1 year, then a target of 111 also possible.
Remark: Growth + Dividend Stock

NALCO nearing- breakoutthe script is growing steadily with a upward trend lines and now looking for a breakout at 103. once its crossed 103 short time traders can jump in and for long term . just wait and watch the show.#Nalco #bearkout.
**Only for educational purpose**

NATIONALUM / NALCO has broken out1. important close above trendline
2. closed above 61 EMA
3. Higher low and Higher high confirmed
As metals are moving up this will also add momentum to NALCO
Use discretion!

Watch for resistance breakoutThe stock is testing its resistance for a while.
Good to go after a Breakout.
It looks good above 74 on closing basis.
The expected targets are 80 & 86

Firmly in Bears' Grip?Weekend Study No. 2 #NATIONALUM
Stock has already given bearish flag break down on weekly time frame. 61-66 is great demand zone and stock technically should reach there in coming days. For any positive bias, stock needs to stay above 80 on WCB. Below 60, I'd be worried about investors!
