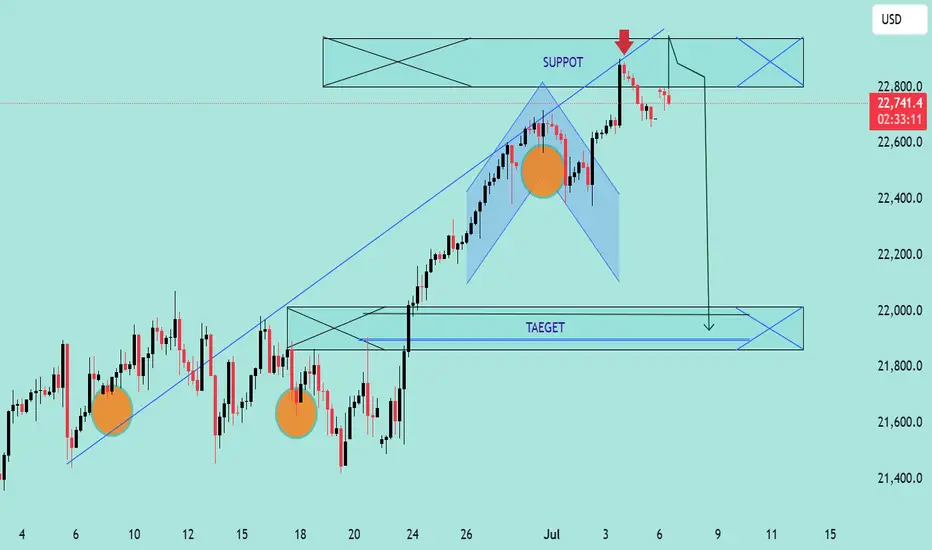
NASDAQ Potential Bearish Reversal Analysis NASDAQ Potential Bearish Reversal Analysis 🧠🔻
The chart illustrates a potential bearish setup forming after a recent uptrend in NASDAQ. Let's break it down professionally:
🔍 Technical Overview:
Ascending Trendline Break ✅
Price had been respecting a steady ascending trendline.
A break below this trendline indicates a possible momentum shift from bullish to bearish.
Bearish Pattern Formation 🔷
A bearish flag/pennant-like formation can be observed after the sharp rise.
This consolidation followed by a breakdown could be a continuation pattern, hinting at further downside.
Resistance Rejection 🔴
A red arrow marks a clear rejection from the resistance zone near 22,800 USD.
Strong wick rejections and bearish candles suggest selling pressure at that level.
Support Turned Resistance (SUPPOT 🛑)
The previously broken support zone is now acting as resistance (note: "SUPPOT" appears misspelled—should be "SUPPORT").
Bearish Target Zone 🎯
The chart marks a "TAEGET" zone (should be "TARGET") near the 21,900 – 22,000 USD range.
This aligns with prior consolidation and demand zones, making it a likely area for price to retrace.
📌 Key Zones:
Resistance (Rejection Area): 22,800 USD
Current Price: 22,739.7 USD
Bearish Target Zone: 21,900 – 22,000 USD
⚠️ Conclusion:
The market shows signs of a bearish reversal with a confirmed trendline break, resistance rejection, and bearish pattern formation. If the price fails to reclaim the 22,800 level, there’s a high probability of downward continuation toward the 22,000 target.
🧠🔻
The chart illustrates a potential bearish setup forming after a recent uptrend in NASDAQ. Let's break it down professionally:
🔍 Technical Overview:
Ascending Trendline Break ✅
Price had been respecting a steady ascending trendline.
A break below this trendline indicates a possible momentum shift from bullish to bearish.
Bearish Pattern Formation 🔷
A bearish flag/pennant-like formation can be observed after the sharp rise.
This consolidation followed by a breakdown could be a continuation pattern, hinting at further downside.
Resistance Rejection 🔴
A red arrow marks a clear rejection from the resistance zone near 22,800 USD.
Strong wick rejections and bearish candles suggest selling pressure at that level.
Support Turned Resistance (SUPPOT 🛑)
The previously broken support zone is now acting as resistance (note: "SUPPOT" appears misspelled—should be "SUPPORT").
Bearish Target Zone 🎯
The chart marks a "TAEGET" zone (should be "TARGET") near the 21,900 – 22,000 USD range.
This aligns with prior consolidation and demand zones, making it a likely area for price to retrace.
📌 Key Zones:
Resistance (Rejection Area): 22,800 USD
Current Price: 22,739.7 USD
Bearish Target Zone: 21,900 – 22,000 USD
⚠️ Conclusion:
The market shows signs of a bearish reversal with a confirmed trendline break, resistance rejection, and bearish pattern formation. If the price fails to reclaim the 22,800 level, there’s a high probability of downward continuation toward the 22,000 target.
Nas100usdidea
NAS100 Bullish Breakout SetupNAS100 Bullish Breakout Setup 🚀
🧠 Chart Analysis (H4 timeframe)
🔹 Ascending Channel:
Price has been trending inside a clear ascending channel (blue zone), supported by higher highs and higher lows.
🔹 Support & Resistance:
Support: Around 21,635.32 – tested multiple times (highlighted by 🔵 arrows).
Resistance: Around 22,265.19 – recent highs and psychological barrier.
🔹 Double Bottom Formation 👣:
Near support zone, a potential double bottom (bullish reversal pattern) is visible. The neckline has been challenged.
🔹 Breakout Confirmation 🟢:
Price has broken above the descending neckline of the double bottom and is hovering near 21,644, indicating potential bullish continuation if sustained.
🔹 Target 🎯:
Projected breakout target lies at 22,265.19, aligning with the previous resistance zone.
🔹 Volume & Momentum 📊:
While not shown, a breakout above the neckline generally needs strong volume confirmation to validate the move.
📌 Conclusion:
If price sustains above the 21,635 – 21,644 area and gains momentum, the path to 22,265 looks likely ✅. However, a false breakout could drag the price back into the channel.

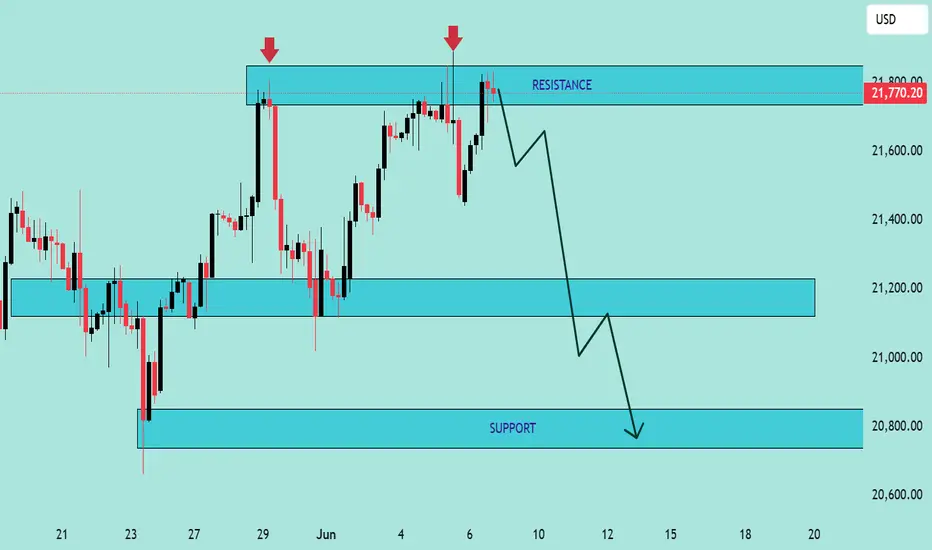
NAS100 Technical Analysis – Bearish Rejection at Resistance NAS100 Technical Analysis – Bearish Rejection at Resistance 🚨
📅 Date: June 6, 2025
📈 Instrument: NAS100 (US Tech 100 Index)
🔍 Chart Overview:
The price action shows a clear rejection from the 21,800 USD resistance zone, marked by two strong bearish wicks (indicated by red arrows 🔴). This level has proven to be a strong supply zone, as sellers repeatedly step in to push prices lower.
🔵 Key Zones:
🔺 Resistance Zone: 21,750 – 21,800 USD
✅ Multiple rejections and bearish pressure.
🔻 Support Zone 1: 21,100 – 21,200 USD
📍 Acts as a mid-range demand zone and a potential take-profit level for short positions.
📉 Support Zone 2 (Major): 20,700 – 20,850 USD
📦 High-probability bounce area due to historical demand.
🔄 Price Action Insight:
The chart outlines a bearish double rejection pattern at the resistance level.
The current candlestick setup suggests bearish momentum, with a potential drop toward the mid-support zone.
If the price breaks below the mid-support, it could cascade down toward the major support near 20,800 USD.
📌 Projected Move:
🔻 From current levels (~21,750), expect:
Pullback from resistance,
Target 1️⃣: 21,100 USD zone,
Target 2️⃣: 20,800 USD major support.
🚫 A clean break and close above 21,800 invalidates the bearish outlook and may trigger a bullish continuation.
✅ Conclusion:
The chart favors a short bias below the resistance zone. Patience is key—wait for confirmation (like a bearish engulfing or break of structure 📉) before entering positions.
📊 Always use risk management. Set stop-loss above resistance in case of reversal
NASDAQ100 Analysis – Key S/R Zones & Price Reaction Incoming NASDAQ100 Analysis – Key S/R Zones & Price Reaction Incoming! 🚨
🔍 Chart Breakdown:
This is a technical chart analysis of NASDAQ100 (NAS100) with defined Support and Resistance zones. The price is currently at 21,314.50, sitting below a critical decision area.
🧱 Key Zones:
🔵 Resistance Zone:
‣ 21,640 – 21,800
‣ Strong supply area where price sharply reversed previously.
‣ If price breaks above the mid resistance zone, a bullish move towards this level is likely.
🟩 Support + Resistance Flip Zone:
‣ 21,280 – 21,420
‣ Former support, now acting as resistance.
‣ Price is struggling to reclaim this zone.
‣ Acts as a key decision level.
🟢 Support Zone:
‣ 20,630 – 20,750
‣ Strong demand zone from which previous rallies initiated.
‣ Target if bearish rejection continues.
🔄 Price Action Insight:
Price is currently rejecting the Support-turned-Resistance zone.
There’s a clear bearish rejection at the mid-zone (S/R flip), forming a lower high structure.
📉 A breakdown from current levels could lead to a retest of the support zone at 20,700 area.
🟢 However, a successful reclaim and bullish confirmation above 21,420 could see price target the upper resistance at 21,800.
📌 Outlook:
🔽 Bearish Bias if price fails to break above 21,420 – possible drop to 20,700.
🔼 Bullish Reversal above 21,420 could drive price to 21,800.
📅 Date: June 1, 2025
🕒 Timeframe: Likely 1H or 4H chart
💬 “Respect the levels, not the noise.”
Trade safe! ✅

NAS100 SHOWING A GOOD UP MOVE WITH 1:10 RISK REWARDNAS100 SHOWING A GOOD UP MOVE WITH 1:10 RISK REWARD
DUE TO THESE REASON
A. its following a rectangle pattern that stocked the market
which preventing the market to move any one direction now it trying to break the strong resistant lable
B. after the break of this rectangle it will boost the market potential for break
C. also its resisting from a strong neckline the neckline also got weeker ald the price is ready to break in the outer region
all of these reason are indicating the same thing its ready for breakout BREAKOUT trading are follws good risk reward
please dont use more than one percentage of your capitalfollow risk reward and tradeing rules
that will help you to to become a bettertrader
thank you

NAS100 SHOWING A GOOD DOWN MOVE WITH 1:8 RISK REWARD NAS100 SHOWING A GOOD DOWN MOVE WITH 1:8 RISK REWARD
DUE TO THESE REASON
A. its following a rectangle pattern that stocked the market
which preventing the market to move any one direction now it trying to break the strong resistant lable
B. after the break of this rectangle it will boost the market potential for break
C. also its resisting from a strong neckline the neckline also got weeker ald the price is ready to break in the outer region
all of these reason are indicating the same thing its ready for breakout BREAKOUT trading are follws good risk reward
please dont use more than one percentage of your capitalfollow risk reward and tradeing rules
that will help you to to become a bettertrader
thank you

NAS100!! I want to mention that NAS100 together with GOLD have the highest accuracy in my analyzes in the last 6 months
As I said last weeks...as I appreciated last week NAS has started a retracement move ... and even if it goes down a bit around 13140 I will keep looking for BUY!
I will give BUY directly and in case of a closure over 13975 for at least 1 day
...as I appreciated last week ... NAS 100 went down and tested the 13140 area from where it rejected very strongly from the Fibonacci 618 area!
this week, even if maybe that area will be tested once again, I think it will go up again to area 13853 and from there even higher ....
...as I appreciated NASA100 rejected strongly from the area fibonacci 618 and climbed again strong! my target for the next period is still 13853 and from there ... with a little retracement I think the NAS will continue to climb!
THIS WEEK ... NAS100 has reached and even exceeded the historical maximum as I said in recent weeks ....
from this area I think he will retest the 13850 area once again and after ... he will look for new limits!
Any shutdown even for 1 day over 14120 ... will open a new black hole for the NAS100
NOTE: Please, give a LIKE if you find this idea useful!
GREAT ATTENTION:
*This information is not a Financial Advice.
