Wave A completed and Wave B unfolding in NASDAQ 100 Index?Wave A completed and now Wave B is about to start. Information at chart
Nasdaq100

Nasadaq Index Analysis - Harmonic Pattern Dow Jones and Nasdaq have given a clear positive outlook. Nasdaq has formed a perfect ABCD pattern and has given clear break out at 61.8 Fib level.
This indicates that the US market looks positive and hence i see an up-move in the Indian indices as well.
The targets are as mentioned on the chart.
This is for educational Purpose only.

NAS100 Looking LongRussia-Ukraine war has brought some whipsaws in the markets
The Oil Markets and Gold markets are going up
The stocks markets is going down and hence the indices are also going down
Since Thursday last week thae indices closed positive with the US indices closing with an inverted head and shoulder pattern
The 3 main US indices; NAS 100, WS30 and S&P500 are looking Bullish with NAS100 targeting 15000 region

Nasdaq 100#NDX
Main Trend seen completed in Nasdaq.
If the current downtrend is only Profit Booking then Yellow Wave (ABC) structure is possible.
If Nasdaq turns to Bear Market (If 2009-2021 Wave complete) then 1st Downtrend Wave may be like Red Wave (ABC).

US100 - will it find support ?Final Support for Nasdaq is at 15510 below which it will breakdown until next support at 15280

NASDAQ 100My nasdaq target is around 18110 for upside then there will be some pull back until it break 14900 levels in the downside.

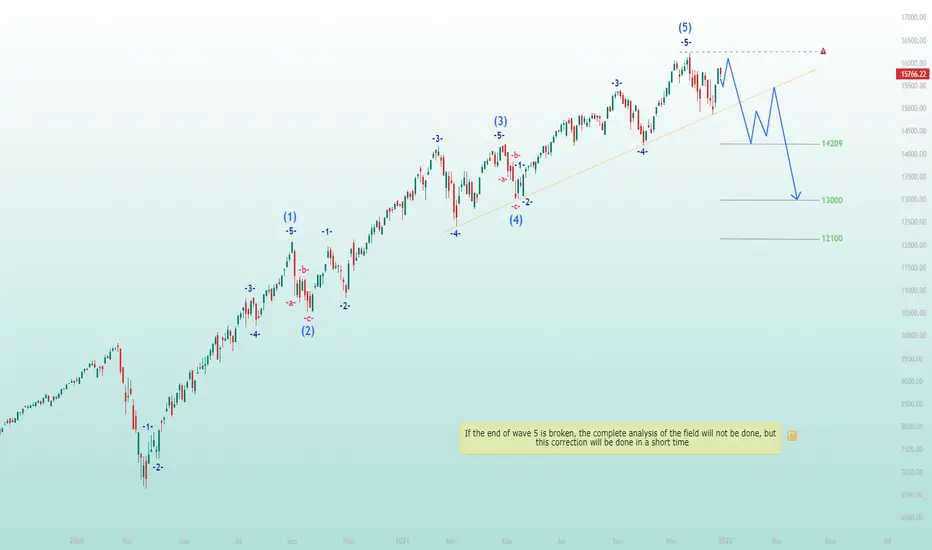
Nasdaq (IXIC) | The best scenario for the fallHello traders, Nasdaq (IXIC) in daily timeframe , this analysis has been prepared in daily timeframe but has been published for a better view in 2 day timeframe.
By looking at the waves, the weekly times 1 and 2 are probably over, and this analysis and this wave count is part of wave 3.
Wave 3 in the weekly time is not on the Fibonacci that can be returned, and only we can make this correction with the wave count we considered in the daily time.
In daily time, waves 1 and 2 are complete and wave 3 is in excellent condition in terms of appearance, but it is not in good shape relative to wave 1.
Waves 2 and 4 are very similar both in appearance and correction and have caused the wave count to not be normal.
However, there are exceptions in the waves.
We make the possibility of correction provided that the trend line is broken downwards and the price will move up to the specified targets.
If the end of wave 5 is broken, the complete analysis of the field will not be done, but this correction will be done in a short time.
🙏If you have an idea that helps me provide a better analysis, I will be happy to write in the comments🙏
❤️Please, support this idea with a like and comment!❤️
Nasdaq on the huge downside don't miss itNow the cmp is 15877. date:2/12/2021
Nasdaq will fall upto this fall
one can short boldly.
Definietly if will fall no proper zones / level to support
You can buy within the specified limit
If you will to go long. we can expect short pullback at this point

NASDAQ Primed for a BounceUnless the Evergrande Crisis and/or the US Debt Ceiling issue ends up blowing in everybody's face, NASDAQ (IXIC) is looking primed for a bounce here.

US100 Nasdaqbounced back strongly from support zone. need to watch 15k levels if sustains this level then new all time high soon.

Nasdaq Next Target ??Now as per Dynamic Square of Nine
We are expecting 15750 - 15800 Target
Mostly We Expect Before Oct 15

NASDAQ | SHORT IDEANasdaq may face resistance at the upper trend line and one can take the sell Trade in that zone for lower targets.
To motivate me, Please like the idea If you agree with the analysis.
Happy Trading!
InvestPro India Team

NASDAQ--> Short term top is near?The above references an opinion and is for information purposes only. It is not intended to be investment advice. Seek a duly licensed professional for investment advice

Looking for possible short on NASDAQ NAS100Breakout of Rising Wedge, Must look for price action before going long from 13200 area

N100 Entry point for investorsN100 is approaching for support at 938. price may reverse from here. keep a close eye !!!

Bullish signs on Nasdaq !Bullish signs on Nasdaq !
i m bullish on nasdaq ! which will impact on nifty also.

NASDAQ Alternate Elliott Wave analysis - 2Om Namah Shivay
Trying an alternate count fitting to NASDAQ Index Wave analysis.
This is for educational purpose only. There are no trading suggestions.
Om Namah Shivay

NASDAQ Alternate Elliott Wave analysisOm Namah Shivay
Trying an alternate count fitting to NASDAQ Index Wave analysis.
This is for educational purpose only. There are no trading suggestions.
Om Namah Shivay

Nasdaq100Tracking Nasdaq 100, one can buy on the breakout and sell on the breakdown of the pattern.
To motivate me, Please like the idea If you agree with the analysis.
Happy Trading!
InvestPro India Team

Head & Shoulder in SGX NiftyAs per the chart, SGX Nifty is showing a Head & Shoulder Pattern on its hourly charts.
Breakout is awaited.
Once a valid Breakout comes above the level of 13800, we may see SGX Nifty go to the levels of 14000 - 14100.
As of now one can keep it on his radar, and wait for the breakout to enter into the trade.

Dow Jones Flag and Rising WedgeThe US benchmark index Dow Jones has formed a Flag pattern along with a Rising Wedge pattern.
With both the patterns happening at the same time one should stay neutral and wait for breakout above or below the wedge pattern,
to get confirmation of the next move. Though the overall trend is still bullish but in the current scenario, its prudent to have patience.
So keep calm as its wait and watch till we get conclusive evidence.

Rounding Pattern Breakout In Dow JonesThe US benchmark index has given a rounding pattern breakout on hourly chart.
Though the breakout was given just an hour before market close on 4th Dec 2020, but today's gap up has continued the upside.
As per the bullish breakout of the pattern, dow jones can touch app 30850 - 31000.
And as per the current chart scenario one can buy with a stop loss below 30100.
Current price 30,225.

Cup & Handle Formation in Dow Jones HourlyThe US index Dow Jones has formed a Cup & Handle pattern on hourly charts.
Breakout is awaited.
A valid upside breakout will lead to further upside but previous swing high may act as a supply zone.
