US100 | 15MNarrative Overview:
Following an aggressive sell-side liquidity raid, price delivered a reactive displacement from a higher-timeframe demand cluster, signaling the presence of institutional buy orders defending discount pricing. The rejection wick into the demand zone suggests a classic liquidity engineering event rather than genuine bearish continuation.
Market Structure:
The broader intraday flow remains rotational; however, the recent reaction establishes a potential short-term structure shift. The failure to achieve sustained acceptance below the demand zone implies seller exhaustion and the likelihood of a mean reversion toward premium.
Liquidity Map:
Sell-Side Liquidity: Resting below 25,250, now partially mitigated after the sweep.
Internal Liquidity: Compression above current price indicates stop accumulation from early longs.
Buy-Side Targets: 25,380 to 25,420 aligns with prior distribution and inefficient pricing.
Imbalance & Order Flow:
The impulsive bullish candle emerging from the zone created a micro fair value gap, reinforcing the probability of algorithmic repricing higher. When displacement originates from discount, it often signals smart money transitioning from accumulation to expansion.
Trade Logic:
The optimal execution model favors continuation toward premium, provided price maintains acceptance above the reclaimed demand.
Bullish Path:
A controlled retracement into the imbalance or the upper boundary of demand could offer refined entries targeting external liquidity. This would complete a discount-to-premium delivery cycle.
Risk Scenario:
A decisive break with displacement below the demand zone would invalidate the accumulation thesis and expose deeper sell-side liquidity, likely inviting bearish continuation.
Key Insight:
What appears to be a simple bounce is structurally more significant; institutions rarely defend a level without intent. Monitor how price behaves during pullbacks. Strong markets do not revisit deeply mitigated demand unless distribution is underway.
Nasdaqidea

NASDAQ SHOWING A GOOD UP MOVE WITH 1:8 RISK REWARD NASDAQ SHOWING A GOOD UP MOVE WITH 1:8 RISK REWARD
DUE TO THESE REASON
A. its following a rectangle pattern that stocked the market
which preventing the market to move any one direction now it trying to break the strong resistant lable
B. after the break of this rectangle it will boost the market potential for break
C. also its resisting from a strong neckline the neckline also got weeker ald the price is ready to break in the outer region
all of these reason are indicating the same thing its ready for breakout BREAKOUT trading are follws good risk reward
please dont use more than one percentage of your capitalfollow risk reward and tradeing rules
that will help you to to become a bettertrader
thank you

#NAS100 Sell Trade Setup.Here’s an up-to-date NAS100/USD Sell trade outlook (technical + fundamental) to help you assess whether positioning for a Downside makes sense right now.
Thank You......

NASDAQ Potential Bearish Reversal Analysis NASDAQ Potential Bearish Reversal Analysis 🧠🔻
The chart illustrates a potential bearish setup forming after a recent uptrend in NASDAQ. Let's break it down professionally:
🔍 Technical Overview:
Ascending Trendline Break ✅
Price had been respecting a steady ascending trendline.
A break below this trendline indicates a possible momentum shift from bullish to bearish.
Bearish Pattern Formation 🔷
A bearish flag/pennant-like formation can be observed after the sharp rise.
This consolidation followed by a breakdown could be a continuation pattern, hinting at further downside.
Resistance Rejection 🔴
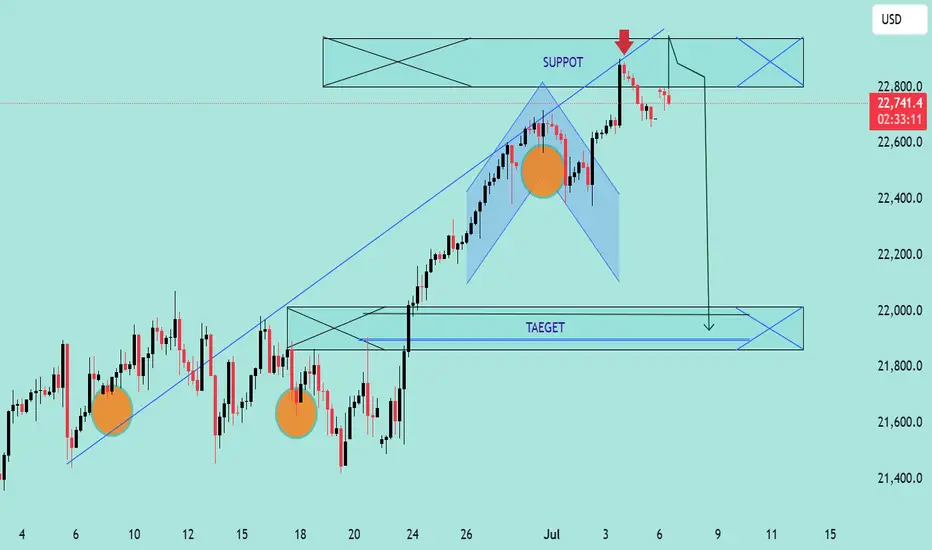
A red arrow marks a clear rejection from the resistance zone near 22,800 USD.
Strong wick rejections and bearish candles suggest selling pressure at that level.
Support Turned Resistance (SUPPOT 🛑)
The previously broken support zone is now acting as resistance (note: "SUPPOT" appears misspelled—should be "SUPPORT").
Bearish Target Zone 🎯
The chart marks a "TAEGET" zone (should be "TARGET") near the 21,900 – 22,000 USD range.
This aligns with prior consolidation and demand zones, making it a likely area for price to retrace.
📌 Key Zones:
Resistance (Rejection Area): 22,800 USD
Current Price: 22,739.7 USD
Bearish Target Zone: 21,900 – 22,000 USD
⚠️ Conclusion:
The market shows signs of a bearish reversal with a confirmed trendline break, resistance rejection, and bearish pattern formation. If the price fails to reclaim the 22,800 level, there’s a high probability of downward continuation toward the 22,000 target.
🧠🔻
The chart illustrates a potential bearish setup forming after a recent uptrend in NASDAQ. Let's break it down professionally:
🔍 Technical Overview:
Ascending Trendline Break ✅
Price had been respecting a steady ascending trendline.
A break below this trendline indicates a possible momentum shift from bullish to bearish.
Bearish Pattern Formation 🔷
A bearish flag/pennant-like formation can be observed after the sharp rise.
This consolidation followed by a breakdown could be a continuation pattern, hinting at further downside.
Resistance Rejection 🔴
A red arrow marks a clear rejection from the resistance zone near 22,800 USD.
Strong wick rejections and bearish candles suggest selling pressure at that level.
Support Turned Resistance (SUPPOT 🛑)
The previously broken support zone is now acting as resistance (note: "SUPPOT" appears misspelled—should be "SUPPORT").
Bearish Target Zone 🎯
The chart marks a "TAEGET" zone (should be "TARGET") near the 21,900 – 22,000 USD range.
This aligns with prior consolidation and demand zones, making it a likely area for price to retrace.
📌 Key Zones:
Resistance (Rejection Area): 22,800 USD
Current Price: 22,739.7 USD
Bearish Target Zone: 21,900 – 22,000 USD
⚠️ Conclusion:
The market shows signs of a bearish reversal with a confirmed trendline break, resistance rejection, and bearish pattern formation. If the price fails to reclaim the 22,800 level, there’s a high probability of downward continuation toward the 22,000 target.
NAS100 Bullish Breakout SetupNAS100 Bullish Breakout Setup 🚀
🧠 Chart Analysis (H4 timeframe)
🔹 Ascending Channel:
Price has been trending inside a clear ascending channel (blue zone), supported by higher highs and higher lows.
🔹 Support & Resistance:
Support: Around 21,635.32 – tested multiple times (highlighted by 🔵 arrows).
Resistance: Around 22,265.19 – recent highs and psychological barrier.
🔹 Double Bottom Formation 👣:
Near support zone, a potential double bottom (bullish reversal pattern) is visible. The neckline has been challenged.
🔹 Breakout Confirmation 🟢:
Price has broken above the descending neckline of the double bottom and is hovering near 21,644, indicating potential bullish continuation if sustained.
🔹 Target 🎯:
Projected breakout target lies at 22,265.19, aligning with the previous resistance zone.
🔹 Volume & Momentum 📊:
While not shown, a breakout above the neckline generally needs strong volume confirmation to validate the move.
📌 Conclusion:
If price sustains above the 21,635 – 21,644 area and gains momentum, the path to 22,265 looks likely ✅. However, a false breakout could drag the price back into the channel.

NAS100 Technical Analysis – Bearish Rejection at Resistance NAS100 Technical Analysis – Bearish Rejection at Resistance 🚨
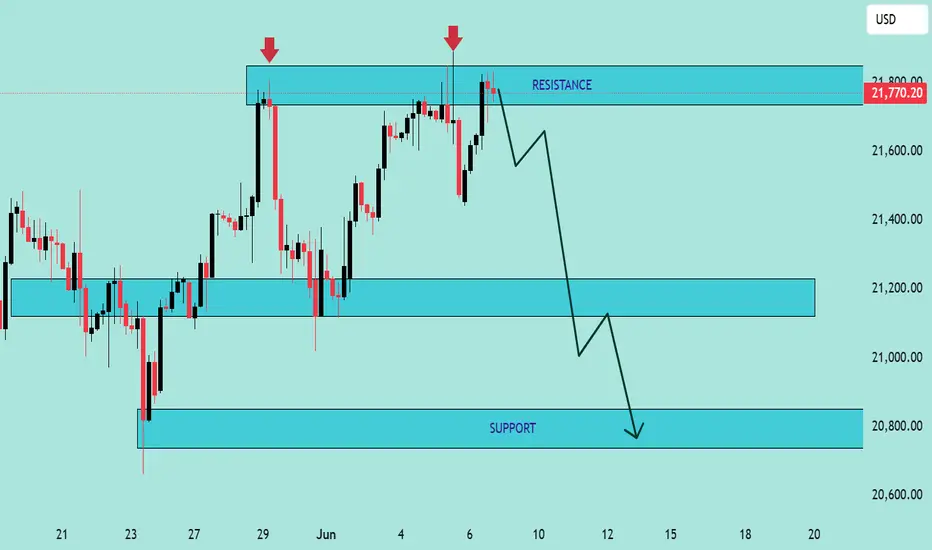
📅 Date: June 6, 2025
📈 Instrument: NAS100 (US Tech 100 Index)
🔍 Chart Overview:
The price action shows a clear rejection from the 21,800 USD resistance zone, marked by two strong bearish wicks (indicated by red arrows 🔴). This level has proven to be a strong supply zone, as sellers repeatedly step in to push prices lower.
🔵 Key Zones:
🔺 Resistance Zone: 21,750 – 21,800 USD
✅ Multiple rejections and bearish pressure.
🔻 Support Zone 1: 21,100 – 21,200 USD
📍 Acts as a mid-range demand zone and a potential take-profit level for short positions.
📉 Support Zone 2 (Major): 20,700 – 20,850 USD
📦 High-probability bounce area due to historical demand.
🔄 Price Action Insight:
The chart outlines a bearish double rejection pattern at the resistance level.
The current candlestick setup suggests bearish momentum, with a potential drop toward the mid-support zone.
If the price breaks below the mid-support, it could cascade down toward the major support near 20,800 USD.
📌 Projected Move:
🔻 From current levels (~21,750), expect:
Pullback from resistance,
Target 1️⃣: 21,100 USD zone,
Target 2️⃣: 20,800 USD major support.
🚫 A clean break and close above 21,800 invalidates the bearish outlook and may trigger a bullish continuation.
✅ Conclusion:
The chart favors a short bias below the resistance zone. Patience is key—wait for confirmation (like a bearish engulfing or break of structure 📉) before entering positions.
📊 Always use risk management. Set stop-loss above resistance in case of reversal
NASDAQ100 Analysis – Key S/R Zones & Price Reaction Incoming NASDAQ100 Analysis – Key S/R Zones & Price Reaction Incoming! 🚨
🔍 Chart Breakdown:
This is a technical chart analysis of NASDAQ100 (NAS100) with defined Support and Resistance zones. The price is currently at 21,314.50, sitting below a critical decision area.
🧱 Key Zones:
🔵 Resistance Zone:
‣ 21,640 – 21,800
‣ Strong supply area where price sharply reversed previously.
‣ If price breaks above the mid resistance zone, a bullish move towards this level is likely.
🟩 Support + Resistance Flip Zone:
‣ 21,280 – 21,420
‣ Former support, now acting as resistance.
‣ Price is struggling to reclaim this zone.
‣ Acts as a key decision level.
🟢 Support Zone:
‣ 20,630 – 20,750
‣ Strong demand zone from which previous rallies initiated.
‣ Target if bearish rejection continues.
🔄 Price Action Insight:
Price is currently rejecting the Support-turned-Resistance zone.
There’s a clear bearish rejection at the mid-zone (S/R flip), forming a lower high structure.
📉 A breakdown from current levels could lead to a retest of the support zone at 20,700 area.
🟢 However, a successful reclaim and bullish confirmation above 21,420 could see price target the upper resistance at 21,800.
📌 Outlook:
🔽 Bearish Bias if price fails to break above 21,420 – possible drop to 20,700.
🔼 Bullish Reversal above 21,420 could drive price to 21,800.
📅 Date: June 1, 2025
🕒 Timeframe: Likely 1H or 4H chart
💬 “Respect the levels, not the noise.”
Trade safe! ✅

Best Buy Swing IdeaPrice has tapped into weekly and daily demand zone
Price is at 50 Ema
There is shift in 4HR structure from bearish to bullish
note: this is not financial advise and not to be treated as financial advise,.solely your decision and responsibility. Just my public journal.

Dow analysis for the week starting 29th july 2024.Dow on daily chart looks bearish. Sell on close below 39800.
On one hour chart it is bullish but being resisted at 40750 levels.
for Monday
Buy above 40775 . book profit at 50/100 points depending on your risk reward levels or trail with stop loss.
Sell on close of one hour candle below 40370 .
Ramakrishnan

BULLISH FLAG IN MAKING IN NASDAQALERT : BULLISH FLAG IN MAKING IN NASDAQ
Will Activate If Give Weekly Close Above 13715
SL - Breakout Candle's Low
Target - 18000

NASDAQ - ABCDABCD pattern,
1. Correction levels are drawn with green horizontal lines.
2. The next 1-2 months are going to be crucial.
3. Indecision between the 17800 and 18400 levels

NASDAQ 1 HR ANALYSISTHERS A bullish ob
that marked with rectangle
this is a bullish ob because the last candel that takes all liq
marked zone is my entry zone

Nas100 Short TradeNasdaq has been Diverging on the Daily MACD since January 26th. Momentum is finally signaling towards the down side. Failing to make Higher Highs on the 4 Hour Time Frame, rejecting perfectly off of the upper Trend Line. Confirming that there is a Trend Change coming. Stop Loss placed above the Trend Line at 18092.26.

NASDAQThe NASDAQ appears to be following Elliott Wave Theory, where it's currently situated in what's projected to be Wave 5 of Primary Degree. Within this wave, it's believed to be in Wave 3, which typically signifies a strong upward movement in prices we are seeing now.
This suggests that we may see a bit more upward momentum in the NASDAQ before a correction phase begins. The expected correction is anticipated to be quite substantial, potentially leading to a range of 13,000 to 12,500. This correction would encompass the entire Primary Degree, marking a significant and extended market trend reversal.

Bullish Bat In NasdaqBullish Bat In Nasdaq
Buy At Cmp 13037
SL - 12950 ( Day Closing Basis )
Target - 13270/13400

Bullish Bat In NasdaqBullish Bat In Nasdaq
Buy PRZ - 12212-12173
SL - 11790 ( Day Closing Basis )
Target - 12925/13160/13400


Bullish Harmonic In NasdaqNasdaq may fall 1.2-2% from Cmp
Bullish Shark PRZ - 12952/12969
Bullish Alt Shark PRZ - 12848
SL - 12760
Target - 13108/ 13160

Bearish Harmonics In NasdaqBearish Shark
Sell PRZ - 14625/14791
SL - 15275
Target - 13125/12600
If Breaks 15275
Bearish Alt Shark
Sell PRZ - 15765/15826
SL - 16400
Target - 13765/13100

Sell NASDAQ Target 12500 and 12300Bearish trend is similar to that of S&P500 and Dow after the Feb data and meeting indicating a clear sell in equity with bearish sentiment for 2023.

NASDAQ COMPOSITE (Signals) [June 14]IXIC to the Ground
IXIC is making a Momentum to maintain the Volatility
Candle Stick patterns shows that there are more buyers in the market. Large Body Candles.
There are some levels marked in the chart.
These levels are considered as Pivot Points and S&R.
14,072 and 14,009 and 14,016 and 14,048. The Crucial Levels for June 14 mark it on your chart.
The Overall Strength is Bearish.
Expecting a +17 Points Up from the Opening and -39 Points Down from +17 Points.
Thanks for using your Valuable time. Leave a like which helps me to do better. Follow me for Daily Signals,
Get updates on, FOREX, Stocks, INDICES, Crypto, #--CFD's to be expected soon. (Share to your Market Friends)

