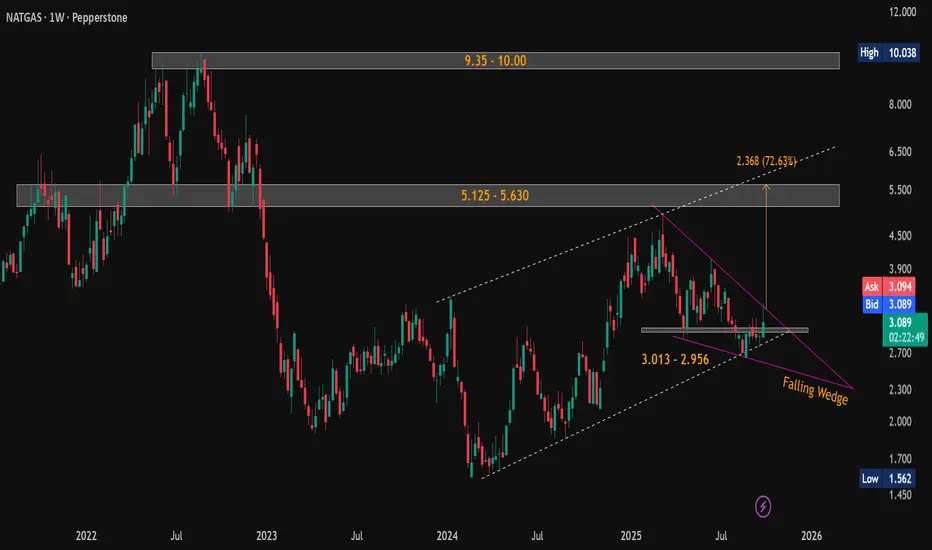
Natural Gas (NG) Weekly Breakout Brewing — 80% Upside Potential!Current Price: $3.090
Technical View (Weekly Timeframe):
Natural Gas has formed a classic falling wedge pattern on the weekly chart - a strong bullish reversal setup. Price action is currently on the verge of breakout , with increasing volume and narrowing range suggesting imminent movement.
🟢 Strong Support Zones:
$3.013 – $2.956
$2.692 – $2.643
🔺 Key Resistance / Upside Targets:
Short-term: $5.125 – $5.630 (Pattern target: $5.625 )
Long-term: $9.35 – $10.00
📈 The pattern breakout target of $5.625 aligns closely with the major resistance zone of $5.125 – $5.630, representing a potential ~80% upside from current levels.
Look for confirmed breakout above the wedge resistance with strong volume for trend continuation.
#NaturalGas | #NG | #FallingWedge | #ChartPatterns | #TechnicalAnalysis | #PriceAction
📌 Disclaimer: This analysis is shared for educational purposes only. It is not a buy/sell recommendation. Please do your own research before making any trading decisions.
NATURAL GAS
NATURAL GAS 1D TIMEFRAME PROJECTIONNATURAL GAS 1D TIMEFRAME PROJECTION
it’s bullish because of russia - Ukraine Conflict.
russia has worlds highest natural gas resources. something big happen with russia.

natural gas longNatural gas has been in an uptrend on the daily charts for a while and after some correction on the daily time frame it has broken put from a head and shoulder reversal pattern on the hourly time frame. It is now re-testing the neckline support. This is a great entry point for a long in the commodity to capture the trend on the longer term time frame with a reasonable stop loss at the low below the right shoulder.

Natural Gas Long Trade Setup !TREND ANALYSIS & TRADE SETUP !
WAVE ANALYSIS !!
Follow Chart Instruction.
Do not be Hurry for entry.
Wait for Proper Entry Setup.
Buy/Sell with Best Risk Reward.
Educational Chart Only.
Wait for ENTRY CONFIRMATION !
Risk : Reward: 5-6 times.

Long natural gas Natural Gas has broken out from the head and shoulder reversal pattern on the hourly timeframe. On the daily as well it seems to be forming a reversal pattern and hence the longs have a good chance of succeeding in this environment. Moreover it looks like the previous move was more of a correction rather than an impulse move down. Stops below the right shoulder with the target being the depth of the head from the neckline breakout.

A possible long trade in Natural GasNatural gas has been rallying over the last week and it has broken above some key pivot levels, in this video I discuss the key level and what the potential entry point can be for the commodity when it corrects further and the potential upside target. Coupled with the fact that this commodity is also below the long term mean prices mean that the long trade has a higher probability of being right. The trade has a potential 20% upside based on the charts and perhaps it will be easier if we as traders look at holding the mini lots. Of course every trader will make a different decision based on the capital in the account.

NATURAL GAS S/R ZINES FROM 278 TO 129MCX:NATURALGAS1! NATURAL GAS is at yearly to minthly buying / support zones, can commense major trend reversal on monthly, quarerly and yearly time frame, major s/r levels till 278 targets have been marked along with s/r level till 129 if doeas go downside.
respect the zones and trade only if you know how to trade the support/resistance areas effectively.

NG1!2.198 at Level 1, 1.522 at Level 2.
Natural GAS still little fall can be excepted before to big move, very less chance to recover in this February month contracts, all call options may become zero again like December and January CALL options. So, the March futures contract is the best choice for long-term holdings.

NATURAL GAS FUTURESNATURAL GAS FUTURES
An ascending triangle is a technical analysis chart pattern that occurs when the price of an asset fluctuates between a horizontal upper trendline and an upward-sloping lower trendline.

Natural Gas Trade Setup NATURAL GAS is now trading near 6.3 level which has acted as a strong support multiple times. The support has been highlighted in the Image in red circles.
If NG makes a rejection from 6.370 level and then gives a close above 6.840 we can initiate a BUY/LONG position with FIRST TARGET as 7.190, SECOND TARGET as 8.090 and THIRD TARGET as 9.630. STOPLOSS can be kept at 6.290. The Long position if initiated can give good R:R Ratio.
In other case if NG breaks the Key SUPPORT LEVEL OF 6.380 and manages to give a close below 6.210 we can look forward for SHORT side entry with a TARGET at 5.750. STOPLOSS can be kept at 6.600 .
( For the short side entry it is better to wait for a pullback or retracement).
Remaining Technical Analysis can be seen in the IMAGE

Natural Gas Possible Elliot wave countsNatural Gas, wave 2 of some lower degree is possible completed now, and now at same degree wave 3 may unfold next, with invalidation level of wave 1's low, which is pegged at $ 6.426
If it breaks low of wave 1 ($ 6.426) then it may be invalidate our current bias.
Most investors treat trading as a hobby because they have a full-time job doing something else.
However, If you treat trading like a business, it will pay you like a business.
If you treat like a hobby, hobbies don't pay, they cost you...!
Disclaimer.
I am not sebi registered analyst.
My studies are for educational purpose only.
Please Consult your financial advisor before trading or investing.
I am not responsible for any kinds of your profits and your losses.
NLong

Natural Gas Looking good to go longNatural Gas is looking good to go long as per wave structures suggesting impulse to unfold, with invalidation levels of $ 6.725.
RK's mass psychological cloud is also suggesting positive ahead, along with macd positive support.
Natural gas had given trendline breakout along with good intensity of volumes on hourly chart.
After positive divergence, breakout with good intensity of volume
Overall wave counts
Double positive Divergences
MACD in hourly positive and now above zero line
MACD in 4 hourly positive crossover and uptick.
RSI in hourly above 60.
Most investors treat trading as a hobby because they have a full-time job doing something else.
However, If you treat trading like a business, it will pay you like a business. If you treat like a hobby, hobbies don't pay, they cost you...!
Disclaimer.
I am not sebi registered analyst.
My studies are for educational purpose only.
Please Consult your financial advisor before trading or investing.
I am not responsible for any kinds of your profits and your losses.
NLong

NATURALGAS ELLIOT WAVE COUNTSNATURALGAS has almost completed wave B of wave 2, possibly next wave C is ready to start unfolding soon, which can be confirmed by breaking support trendline, which could be aa good trigger point, Once it breaks support trendline then it can slide towards south directions near $ 7.500 zones, where wave C can complete equality with wave A.
Negative divergence in both rsi and macd on hourly time frame
Most investors treat trading as a hobby because they have a full-time job doing something else.
However, If you treat trading like a business, it will pay you like a business.
If you treat like a hobby, hobbies don't pay, they cost you...!
Disclaimer.
I am not sebi registered analyst.
My studies are for educational purpose only.
Please Consult your financial advisor before trading or investing.
I am not responsible for any kinds of your profits and your losses.

NaturalGas Pull-back is to start as per Elliot Wave AnalysisAfter sharp fall from top of the wave 5 or we can say top of June month, it has fallen in five subdivided pattern as a wave A, which clearly shows that correction is in zigzag pattern, we all know some basic rules for zig-zag correction, that it comes in three subdivisions like A-B-C, and wave A always subdivides into an impulse or leading diagonal, and wave B always subdivides into a zigzag, flat, triangle or combinations, so here we are assuming that wave A has almost at the wedge of completion, and possibly wave B his ready to start as a A-B-C towards north directions, which can lead towards 61.8% of recent fall (wave A), which is near $7.571 or more towards $7.976, on the way down $5.30 is a support area to watchout for. However, pullback will just be a counter trend rally and once wave B rally is completed, then wave C will unfold, and decline of wave C should probably be equal to wave A.
Overall scenario
Sub divisions in wave A
Fibonacci retracement levels
Trigger point
Can be like this as per rules
Most investors treat trading as a hobby because they have a full-time job doing something else.
However, If you treat trading like a business, it will pay you like a business. If you treat like a hobby, hobbies don't pay, they cost you...!
Disclaimer.
I am not sebi registered analyst.
My studies are for educational purpose only.
Please Consult your financial advisor before trading or investing.
I am not responsible for any kinds of your profits and your losses.
N

Natural Gas Analysis: Commodity TradingNatural Gas go hand in hand both in international market as well as Indian market. Here we present natural gas Elliott Wave Analysis. It is showing a 5 wave decline as wave A and again will go up for a three wave B, then again come down in a C wave.
You can correlate this chart with MCX Natural gas. Both are the same. Hope it will enlighten your commodity trading.
:) Please like and share our ideas.
:) For any query comment please.
NShort

NShort

Natural Gas for short term Shorting Since 06-OCt Natural Gas is in a corrective move and is forming a Flat In Black ((A)) ((B)) ((C)).
It seems in formation of Last leg (5) Blue down as indicated in chart this will complete correction and one can look for BUYING opportunity for long term.
However to encash the smaller move in Wave (5) blue we have initiated a sell position with stop loss @ 4.045 in international market. MCX will follow same trend and corresponding trade can be initiated in MCX.
And after completion of Wave (5) in Blue we will be entering for a Long position for Higher Targets
Disclaimer:
These are personal views for academic purpose , if anyone wants to trade please access your risk and consult with your financial advisor
NShort

Natural gas ( Bullish View)NG break above 5.221 can give breakout from the current level in short term trade according to the given level .
NLong

Natural GasStrategy : Sell on rise near green price line...
Bears active below red price line....
trading levels marked and well defined...
Happy Trading.....
Like......... Share........ Follow.........
NShort

Natural GasFull on bullish...
buy at the trend lines drawn on any pull back
important levels given in the attached study below
NLong

Natural Gas Big BreakoutBuy Natural Gas
Closing Price - 238.9
Buy 1 Lot At Cmp
Add Another Lot If Price Drop To 230-232
Strict SL - 219.7 (Day Closing Basis)
Target 1 - 278-280

NATURAL GAS SWING SHORT LEVELSSWING SHORT NATURAL GAS IF IT BREAKS THIS INVERSE FLAG PATTERN ON THE DOWNSIDE FOR THE TARGET OF 2.645
NShort

NATURAL GAS TAKING OUT RETAILERS AND MOVING TO DAILY LIQUIDITYAs a retailer you would have been probably stopped out below the support that i have marked below as a blue line.
In reality it was a well planned move to the upside.
N
