Natural Gas Analysis in Daily TFNatural Gas completed in Leading Diagonal Pattern wave 1 cycle degree completed now in correction phase so don't go long immediately wait up to fib retrace 61.8% and wave ((4)) sweep then go long target Cycle degree wave 1 and 2 extension of 161.8 level may be reach in 2026 or 2027
Naturalgasanalysis

Natural Gas Levels For October 2025Important support and Resistance Levels For Natural Gas.
When Market touches the level, the price action plays important roles.
For More Learning Reach out to us.
Natural Gas Futures (INR) Weekly Chart pattern analysisNatural Gas Futures (INR) Weekly Chart pattern analysis.
For the students, We will include chart structure, patterns, demand-supply zones, and precise support/resistance levels based on what is seen on the charts :
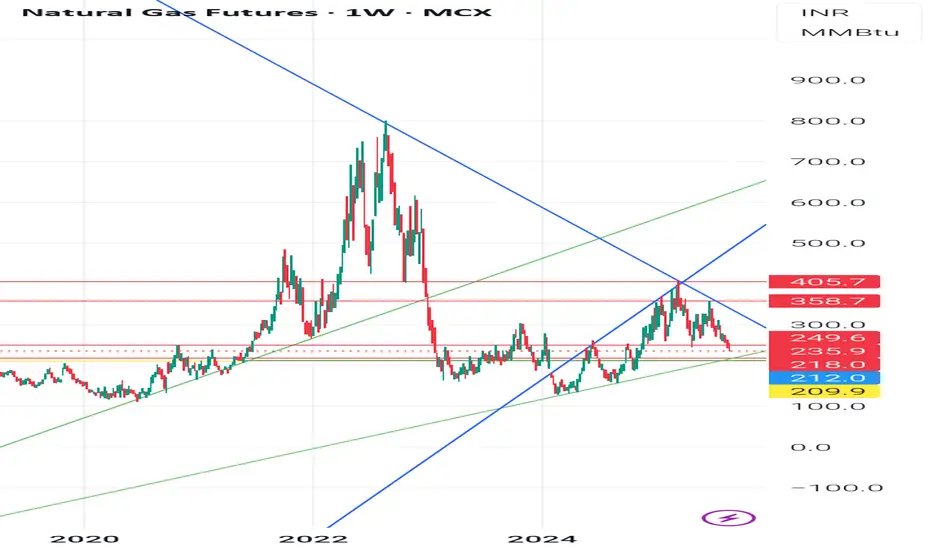
- Chart OverviewTimeframe: Weekly (1W)Current Price: 244.7 (down -5.30%)Price is near an important ascending trendline support (green line) after a strong correction from recent highs. Structure shows earlier breakout above descending trendline (blue) followed by a retest and rejection.
🧭 1. Trend Analysis- Long-Term Trend:From 2022 highs (900+), Natural Gas was in a sharp downtrend (blue descending trendline).Downtrend broke in late 2023, initiating a mid-term uptrend within an ascending channel.
Short-Term Trend:Since the 405.7 high (early 2025), prices are in a correction phase.Price now testing demand zone near 244-212.
📈 2. Chart Patterns,Ascending Channel: Price has been moving between parallel green lines since late 2023.Breakdown Risk: Price is testing the lower channel line; breakdown could trigger more downside.Head & Shoulders Possibility: The highs around 405-358 resemble a left shoulder-head-right shoulder formation, with neckline near 249-244. A confirmed break below could accelerate selling.
Supply Zone Rejection: Strong selling emerged from 358-405, marking it as a supply zone.
3. Key Technical Levels: Rejection Level: High Significance 405.7
-Major Supply 2025 high, strong rejection point 358.7
Secondary Supplying- Recent swing high before sell-off
249.6-244.7
- Current Zone - Channel support & neckline zone
218.0 - Demand Zone Past consolidation & buying interest
212.0 - Strong Support Historical demand zone floor
209.9
- Critical Support
If broken, opens path to 180-160⚖ 4. Demand & Supply ZonesDemand Zones:218-212 (weekly accumulation area)180-160 (last major base before rally)
Supply Zones:358-405 (heavy selling area)280-300 (minor supply if bounce occurs)
5. Possible ScenariosScenario
1 Support Holds:If 244-212 holds, expect a bounce towards 280 and 300.A close above 300 could re-test 358.
Scenario
2 - Breakdown:A close below 212 could lead to a quick drop towards 180-160.
👉 Disclaimer:
This is for educational purposes only, not trading advice. Futures & commodities are highly volatile; manage risk and consult a registered financial advisor.
#naturalgas #technicallevels #chartpatternabalysis #commoditytrading
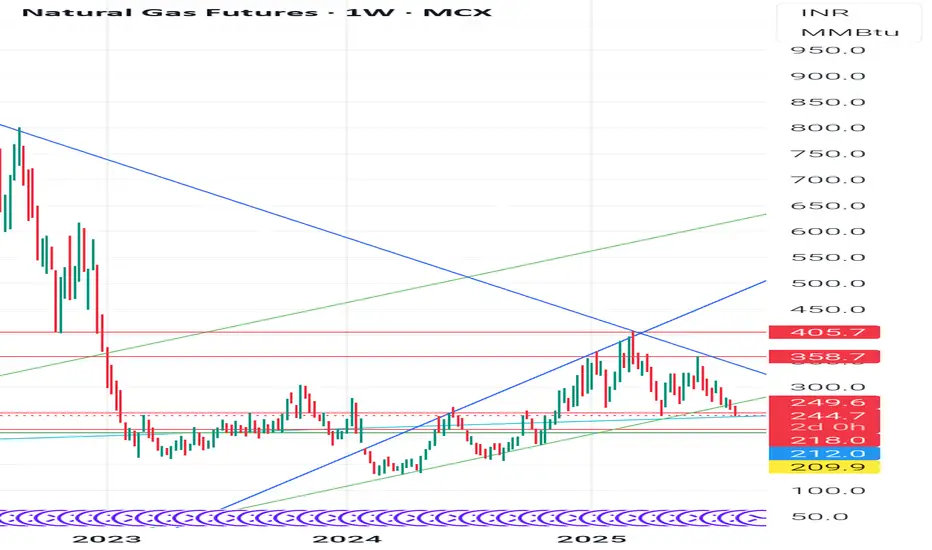
Natural gas: Chart AnalysisLet’s break down the Natural Gas Futures (INR) Weekly Chart step-by-step.
This will include chart structure, patterns, demand–supply zones, and precise support/resistance levels based on what I can see on the charts :
🔍Chart OverviewTimeframe: Weekly (1W)Current Price: ₹244.7 (down -5.30%)Price is near an important ascending trendline support (green line) after a strong correction from recent highs. Structure shows earlier breakout above descending trendline (blue) followed by a retest and rejection.
🧭 1. Trend AnalysisLong-Term Trend:From 2022 highs (₹900+), Natural Gas was in a sharp downtrend (blue descending trendline).Downtrend broke in late 2023, initiating a mid-term uptrend within an ascending channel.
Short-Term Trend:Since the ₹405.7 high (early 2025), prices are in a correction phase.Price now testing demand zone near ₹244–₹212.
📈 2. Chart Patterns,Ascending Channel: Price has been moving between parallel green lines since late 2023.Breakdown Risk: Price is testing the lower channel line; breakdown could trigger more downside.Head & Shoulders Possibility: The highs around ₹405–₹358 resemble a left shoulder–head–right shoulder formation, with neckline near ₹249–₹244. A confirmed break below could accelerate selling.
Supply Zone Rejection: Strong selling emerged from ₹358–₹405, marking it as a supply zone.📍
3. Key Technical LevelsLevel (₹) nType the:Significance 405.7
🔺 Major Supply 2025 high, strong rejection point 358.7
Secondary Supplying- Recent swing high before sell-off
249.6–244.7
⚠️ Current Zone Channel support & neckline zone
218.0 🛑 Demand Zone Past consolidation & buying interest
212.0 🛑 Strong Support Historical demand zone floor
209.9
🔻 Critical Support
If broken, opens path to ₹180–₹160⚖ 4. Demand & Supply ZonesDemand Zones:₹218–₹212 (weekly accumulation area)₹180–₹160 (last major base before rally)
Supply Zones:₹358–₹405 (heavy selling area)₹280–₹300 (minor supply if bounce occurs)
5. Possible ScenariosScenario
1 Support Holds:If ₹244–₹212 holds, expect a bounce towards ₹280 and ₹300.A close above ₹300 could re-test ₹358.
Scenario
2 – Breakdown:A close below ₹212 could lead to a quick drop towards ₹180–₹160.
⚠ Disclaimer:
This is for educational purposes only, not trading advice. Futures & commodities are highly volatile; manage risk and consult a registered financial advisor.
Naturalgas downtrend Movement upto 3.2Symbol Naturalgas
Timeframe 1 hour
Analysis Breakout Below the suport line
can expect a downtrend movement upto 3.2
We hope our analysis is adding value to your trading journey.
Please note: Published ideas are for educational purposes only. Trade at your own risk.
Also, please respect the risk - stop loss (SL) should not be more than 2% of the capital.
DISCLAIMER: We are not SEBI registered. All the ideas uploaded in this channel are solely for educational purposes."

Naturalgas Uptrend Movement Expected upto 4.0Symbol Naturalgas
Timeframe 4 Hrs
A
Analysis : Breakout from the W Pattern.. Target expected is T1 = 3.7, T2= 4.0, T3= 4.6
We hope our analysis is adding value to your trading journey.
Please note: Published ideas are for educational purposes only. Trade at your own risk.
Also, please respect the risk - stop loss (SL) should not be more than 2% of the capital.
DISCLAIMER: We are not SEBI registered. All the videos uploaded in this channel are solely for educational purposes."

NATURAL GAS - CAPPED UPSIDE & MORE DOWNSIDE?Symbol - XNGUSD
Natural Gas has recently been trading within a wedge pattern, which has now broken to the downside. This technical development suggests that the upside potential appears capped for the time being. The market is currently testing critical levels, and the broader outlook seems to be more focused on downward movement in the short to medium term.
There is a possibility of a breakdown retest around the 3.25 - 3.30 area, which could act as a key resistance zone. If this level holds, we could see a sell-off, confirming further downside pressure. The outlook for Natural Gas, in this context, leans bearish, with the price potentially targeting the 2.80 - 2.70 range in extension.
The market is closely watching weather forecasts and energy inventories, with any cold weather or supply disruptions potentially offering temporary support. However, unless these fundamentals change significantly, the technical breakdown suggests limited upside potential and further downside risks.
Resistance levels: 3.28, 3.20
Support levels: 3.00, 2.80
Technically, the current outlook favors a move lower, with further downside expected if the price fails to reclaim the 3.25 - 3.30 resistance. Should the retest of these levels hold, we could see a sell-off towards the 2.80 - 2.70 area. A failure to hold above the 3.10 support would reinforce the bearish sentiment and suggest further declines.

Naturalgas uptrend Movement expected upto 3.6730Symbol Naturalgas or XNGUSD
TImeframe 30 minutes
ANalyis Value of the Natural gas is above resistance line and we can expect the target uptp 3.6730
Target 3.6730

Natural Gas - January, 2025 month analysis.Two important key levels for the January month are $ 3.13 and $ 4.34 level.
We can look for buy side Opportunities from $ 3.13.
Disclaimer: We are not SEBI registered. All the content (videos, comments, posts, community posts, live streaming, etc) is for educational and informational purposes only, Conduct your own due diligence, or consult a licensed financial advisor or broker before making any and all investment decisions.

NATURAL GAS - REVRSAL TRADE ON SHORT SIDESymbol - NATURALGAS!
NATURALGAS! is currently trading at 320
I'm seeing a trading opportunity on sell side.
Shorting NATURALGAS! Futures at CMP 320
I will be adding more position at 330, if comes.
Holding with SL 335
Targets I'm expecting are 295 - 282 & beyond.
Disclaimer - Do not consider this as a buy/sell recommendation. I'm sharing my analysis & my trading position. You can track it for educational purposes. Thanks!

Bullish Trade In Natural Gas - Dont Miss This !Natural gas has given a good breakout above 180.5 with a sl of 179 target minimum target of 183.5 and 185.
A low sl with good risk to reward of 1:3 is a must take trade for new traders

BEARISHNESS IN NATURALGASNatural gas is looking weaker and can make a new days low soon with the first target of 168

Long Position in Natural GasNatural Gas has broken important support zone of 160-165 this week & now trading at 135.
Natural gas is approaching its next major support zone of 128-120
CMP is 135 & I'm opening long position in futures. I'll add more position if 125-126 comes.
SL would be below 119
Targets I'm expecting are 158 and 167 which was support zone before & now a resistance.
Disclaimer - Do not consider this as a buy/sell recommendation. I'm sharing my analysis & my trading position. You can track it for educational purposes. Thanks!

Natural Gas AnalysisI am expecting Natural Gas to touch 300 in next couple of months. And if 300 breakout happen, it may reach 400.
(Pure Price Action Analysis)

Natural Gas important levels to watchNatural Gas important levels to watch are as follows
#Support: 214
Sell below: 214 only on 15 minute candle closure below the level.
Target 1: 211
Target 2: 206
#Resistance: 218.8
Buy Above: 218.8 only on 15 minute candle closure Above the level.
Target 1: 221.8
Target 2: 226.9
=> # Remember each level will act as a support and resistance individually so there is a probability of reversal and a pullback on either side so its better to make an habit to book profits at each targets and re-enter again after a breakout from the same with a proper stoploss as per your own risk appetite.
=> # Please do your own research before initiating any trade. Always use stoploss in order to protect your capital.
=> # Please refer our Indicators published on tradingview if you find it useful give it a like.
=> # Follow us for more such information and educational ideas and Indicators. Give it a like if you appreciate the idea. Queries will be answered in comment section.
#Disclaimer: This is just a view and published here only for educational purpose, this should not be considered as a buy or sell signal. Trading in stock market may involve financial risk therefore, do your own research before taking any position.

Natural Gas Mini Intraday Prediction Levels for 5 Dec 2023Natural Gas Mini Intraday Prediction Levels for 5 Dec 2023
The chart indicates 15 min time frame. These Levels act as Support and Resistance according to position of price . They are strictly for Intraday Trading only. Execution only after break out and close above the Resistance zone/Line or after break down and close below the Support zone/Line.
These levels act as support and resistance. You have to trade according to level breakout or breakdown.
If You are a new trader then just watch (No Trade) these levels for some days.
Happy trading.
Disclaimer:
I am not a SEBI Registered Analyst. Anything posted here is my own analysis and views. This is created for educational purposes only. Always consult your Financial Advisor before taking any decision or trade.

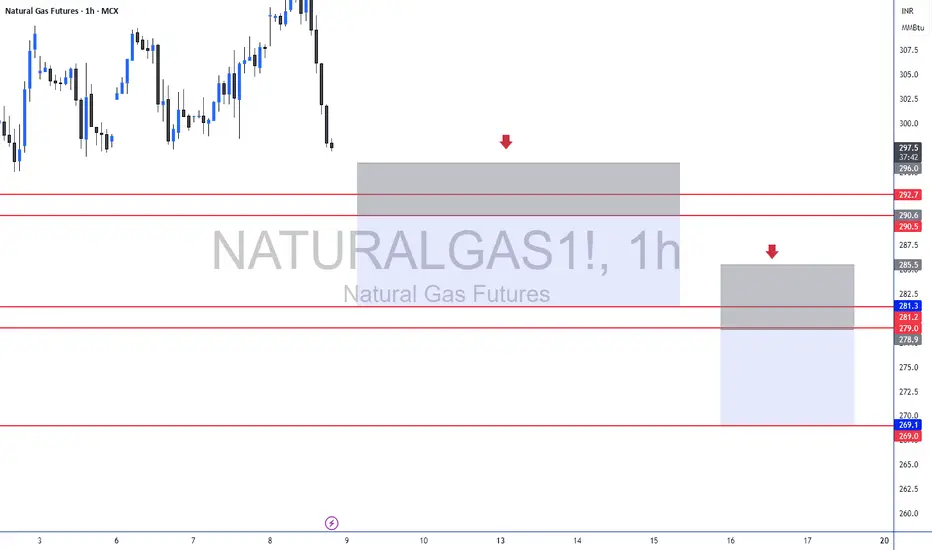
Natural Gas Important Levels to watch !Natural Gas important levels to watch are as follows
#Support: 282.1
Sell below: 282.1 only on 15 minute candle closure below the level.
Target 1: 279.1
Target 2: 276.9
Target 3: 274.2
#Resistance: 287
Buy Above: 287 only on 15 minute candle closure Above the level.
Target 1: 290
Target 2: 294.9
Target 3: 301.9
=> # Remember each level will act as a support and resistance individually so there is a probability of reversal and a pullback on either side so its better to make an habit to book profits at each targets and re-enter again after a breakout from the same with a proper stoploss as per your own risk appetite.
=> # Please do your own research before initiating any trade. Always use stoploss in order to protect your capital.
=> #If you are Unable to trade properly and dissatisfied with your manual trading results due to psychological disadvantages or busy schedule or "Fear & Greed" emotions, then Algorithmic trading can be the most useful solution to overcome such problems. Kindly follow us and join us using details mentioned below the idea.
=> # Please refer our swing based support and resistance indicator if you find it useful give it a like.
=> # Follow us for more such information and educational ideas and Indicators. Give it a like if you appreciate the idea. Queries will be answered in comment section.
#Disclaimer: This is just a view and published here only for educational purpose, this should not be considered as a buy or sell signal. Trading in stock market may involve financial risk therefore, do your own research before taking any position.

Natural Gas important levels to watch !Natural Gas important levels to watch are as follows
#Support: 247.6
Sell below: 247.6 only on 15 minute candle closure below the level.
Target 1: 246
Target 2: 243
#Resistance: 250.5
Buy Above: 250.5 only on 15 minute candle closure Above the level.
Target 1: 252.3
Target 2: 255.2
Target 3: 258.6
=> # Remember each level will act as a support and resistance individually so there is a probability of reversal and a pullback on either side so its better to make an habit to book profits at each targets and re-enter again after a breakout from the same with a proper stoploss as per your own risk appetite.
=> # Please do your own research before initiating any trade. Always use stoploss in order to protect your capital.
=> #If you are Unable to trade properly and dissatisfied with your manual trading results due to psychological disadvantages or busy schedule or "Fear & Greed" emotions, then Algorithmic trading can be the most useful solution to overcome such problems. Kindly follow us and join us using details mentioned below the idea.
=> # Please refer our swing based support and resistance indicator if you find it useful give it a like.
=> # Follow us for more such information and educational ideas and Indicators. Give it a like if you appreciate the idea. Queries will be answered in comment section.
#Disclaimer: This is just a view and published here only for educational purpose, this should not be considered as a buy or sell signal. Trading in stock market may involve financial risk therefore, do your own research before taking any position.

Natural Gas Important Levels to watch !Natural Gas important levels to watch are as follows
#Support: 244
Sell below: 244 only on 15 minute candle closure below the level.
Target 1: 242
Target 2: 239
#Resistance: 247
Buy Above: 247 only on 15 minute candle closure Above the level.
Target 1: 249
Target 2: 252
=> # Remember each level will act as a support and resistance individually so there is a probability of reversal and a pullback on either side so its better to make an habit to book profits at each targets and re-enter again after a breakout from the same with a proper stoploss as per your own risk appetite.
=> # Please do your own research before initiating any trade. Always use stoploss in order to protect your capital.
=> #If you are Unable to trade properly and dissatisfied with your manual trading results due to psychological disadvantages or busy schedule or "Fear & Greed" emotions, then Algorithmic trading can be the most useful solution to overcome such problems. Kindly follow us and join us using details mentioned below the idea.
=> # Please refer our swing based support and resistance indicator if you find it useful give it a like.
=> # Follow us for more such information and educational ideas and Indicators. Give it a like if you appreciate the idea. Queries will be answered in comment section.
#Disclaimer: This is just a view and published here only for educational purpose, this should not be considered as a buy or sell signal. Trading in stock market may involve financial risk therefore, do your own research before taking any position.

Natural Gas Important levels to watch! Natural Gas important levels to watch are as follows
#Support: 266.1
Sell below: 266 only on 15 minute candle closure below the level.
Target 1: 263
Target 2: 259
#Resistance: 270
Buy Above: 270 only on 15 minute candle closure Above the level.
Target 1: 272.5
Target 2: 276.5
=> # Remember each level will act as a support and resistance individually so there is a probability of reversal and a pullback on either side so its better to make an habit to book profits at each targets and re-enter again after a breakout from the same with a proper stoploss as per your own risk appetite.
=> # Please do your own research before initiating any trade. Always use stoploss in order to protect your capital.
=> #If you are Unable to trade properly and dissatisfied with your manual trading results due to psychological disadvantages or busy schedule or "Fear & Greed" emotions, then Algorithmic trading can be the most useful solution to overcome such problems. Kindly follow us and join us using details mentioned below the idea.
=> # Please refer our swing based support and resistance indicator if you find it useful give it a like.
=> # Follow us for more such information and educational ideas and Indicators. Give it a like if you appreciate the idea. Queries will be answered in comment section.
#Disclaimer: This is just a view and published here only for educational purpose, this should not be considered as a buy or sell signal. Trading in stock market may involve financial risk therefore, do your own research before taking any position.


Bearish Crab In Natural GasBearish Crab In Natural Gas
Sell PRZ - 223.6/224.3
SL - 229.1
Target - 214/208

MCX Natural Gas – Impulsive Wave SetupA new impulsive structure has emerged from the low of 265.5 in natural gas. Price has accomplished wave (5) and started the zigzag correction at 801.
Currently, Natural gas is forming sub-wave 5 of impulsive wave C. Natural gas has also broken down 200 EMA and the base channel of 2 – 4 wave, which signals bearish momentum. It has faced strong support of 515 , but the price didn’t respect the level and ended up losing bullish momentum.
Wave C has traveled the same distance as wave A. Hence, Wave A = Wave C. If the price sustains below 516, traders can trade for the following targets: 486 – 462 – 440 .
I will update further information soon.
