Natural Gas Futures (INR) Weekly Chart pattern analysisNatural Gas Futures (INR) Weekly Chart pattern analysis.
For the students, We will include chart structure, patterns, demand-supply zones, and precise support/resistance levels based on what is seen on the charts :
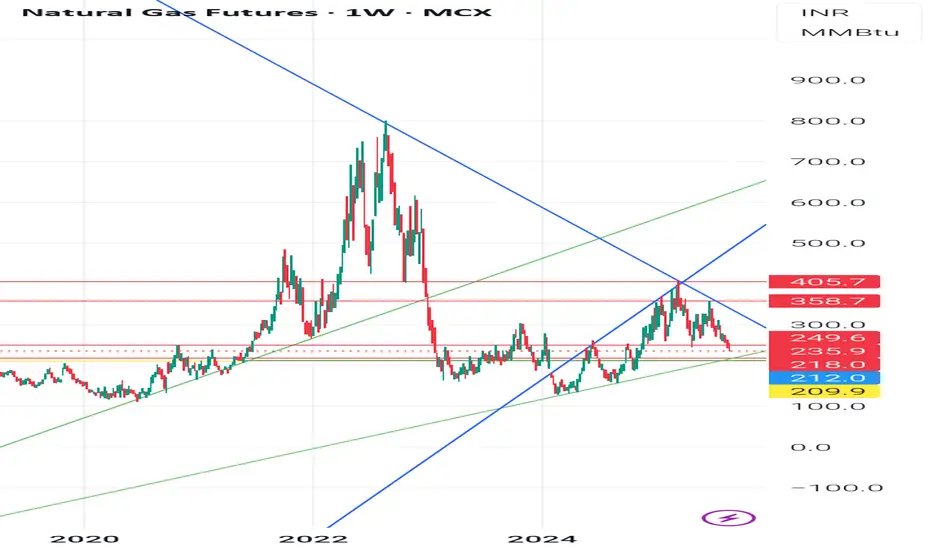
- Chart OverviewTimeframe: Weekly (1W)Current Price: 244.7 (down -5.30%)Price is near an important ascending trendline support (green line) after a strong correction from recent highs. Structure shows earlier breakout above descending trendline (blue) followed by a retest and rejection.
🧭 1. Trend Analysis- Long-Term Trend:From 2022 highs (900+), Natural Gas was in a sharp downtrend (blue descending trendline).Downtrend broke in late 2023, initiating a mid-term uptrend within an ascending channel.
Short-Term Trend:Since the 405.7 high (early 2025), prices are in a correction phase.Price now testing demand zone near 244-212.
📈 2. Chart Patterns,Ascending Channel: Price has been moving between parallel green lines since late 2023.Breakdown Risk: Price is testing the lower channel line; breakdown could trigger more downside.Head & Shoulders Possibility: The highs around 405-358 resemble a left shoulder-head-right shoulder formation, with neckline near 249-244. A confirmed break below could accelerate selling.
Supply Zone Rejection: Strong selling emerged from 358-405, marking it as a supply zone.
3. Key Technical Levels: Rejection Level: High Significance 405.7
-Major Supply 2025 high, strong rejection point 358.7
Secondary Supplying- Recent swing high before sell-off
249.6-244.7
- Current Zone - Channel support & neckline zone
218.0 - Demand Zone Past consolidation & buying interest
212.0 - Strong Support Historical demand zone floor
209.9
- Critical Support
If broken, opens path to 180-160⚖ 4. Demand & Supply ZonesDemand Zones:218-212 (weekly accumulation area)180-160 (last major base before rally)
Supply Zones:358-405 (heavy selling area)280-300 (minor supply if bounce occurs)
5. Possible ScenariosScenario
1 Support Holds:If 244-212 holds, expect a bounce towards 280 and 300.A close above 300 could re-test 358.
Scenario
2 - Breakdown:A close below 212 could lead to a quick drop towards 180-160.
👉 Disclaimer:
This is for educational purposes only, not trading advice. Futures & commodities are highly volatile; manage risk and consult a registered financial advisor.
#naturalgas #technicallevels #chartpatternabalysis #commoditytrading
Naturalgasforcast
Naturalgas downtrend Movement upto 3.2Symbol Naturalgas
Timeframe 1 hour
Analysis Breakout Below the suport line
can expect a downtrend movement upto 3.2
We hope our analysis is adding value to your trading journey.
Please note: Published ideas are for educational purposes only. Trade at your own risk.
Also, please respect the risk - stop loss (SL) should not be more than 2% of the capital.
DISCLAIMER: We are not SEBI registered. All the ideas uploaded in this channel are solely for educational purposes."

NATURAL GAS - CAPPED UPSIDE & MORE DOWNSIDE?Symbol - XNGUSD
Natural Gas has recently been trading within a wedge pattern, which has now broken to the downside. This technical development suggests that the upside potential appears capped for the time being. The market is currently testing critical levels, and the broader outlook seems to be more focused on downward movement in the short to medium term.
There is a possibility of a breakdown retest around the 3.25 - 3.30 area, which could act as a key resistance zone. If this level holds, we could see a sell-off, confirming further downside pressure. The outlook for Natural Gas, in this context, leans bearish, with the price potentially targeting the 2.80 - 2.70 range in extension.
The market is closely watching weather forecasts and energy inventories, with any cold weather or supply disruptions potentially offering temporary support. However, unless these fundamentals change significantly, the technical breakdown suggests limited upside potential and further downside risks.
Resistance levels: 3.28, 3.20
Support levels: 3.00, 2.80
Technically, the current outlook favors a move lower, with further downside expected if the price fails to reclaim the 3.25 - 3.30 resistance. Should the retest of these levels hold, we could see a sell-off towards the 2.80 - 2.70 area. A failure to hold above the 3.10 support would reinforce the bearish sentiment and suggest further declines.

NATURAL GAS - REVRSAL TRADE ON SHORT SIDESymbol - NATURALGAS!
NATURALGAS! is currently trading at 320
I'm seeing a trading opportunity on sell side.
Shorting NATURALGAS! Futures at CMP 320
I will be adding more position at 330, if comes.
Holding with SL 335
Targets I'm expecting are 295 - 282 & beyond.
Disclaimer - Do not consider this as a buy/sell recommendation. I'm sharing my analysis & my trading position. You can track it for educational purposes. Thanks!

Natural Gas Important Levels to watch !Natural Gas important levels to watch are as follows
#Support: 282.1
Sell below: 282.1 only on 15 minute candle closure below the level.
Target 1: 279.1
Target 2: 276.9
Target 3: 274.2
#Resistance: 287
Buy Above: 287 only on 15 minute candle closure Above the level.
Target 1: 290
Target 2: 294.9
Target 3: 301.9
=> # Remember each level will act as a support and resistance individually so there is a probability of reversal and a pullback on either side so its better to make an habit to book profits at each targets and re-enter again after a breakout from the same with a proper stoploss as per your own risk appetite.
=> # Please do your own research before initiating any trade. Always use stoploss in order to protect your capital.
=> #If you are Unable to trade properly and dissatisfied with your manual trading results due to psychological disadvantages or busy schedule or "Fear & Greed" emotions, then Algorithmic trading can be the most useful solution to overcome such problems. Kindly follow us and join us using details mentioned below the idea.
=> # Please refer our swing based support and resistance indicator if you find it useful give it a like.
=> # Follow us for more such information and educational ideas and Indicators. Give it a like if you appreciate the idea. Queries will be answered in comment section.
#Disclaimer: This is just a view and published here only for educational purpose, this should not be considered as a buy or sell signal. Trading in stock market may involve financial risk therefore, do your own research before taking any position.

Natural Gas Important Levels to watch !Natural Gas important levels to watch are as follows
#Support: 244
Sell below: 244 only on 15 minute candle closure below the level.
Target 1: 242
Target 2: 239
#Resistance: 247
Buy Above: 247 only on 15 minute candle closure Above the level.
Target 1: 249
Target 2: 252
=> # Remember each level will act as a support and resistance individually so there is a probability of reversal and a pullback on either side so its better to make an habit to book profits at each targets and re-enter again after a breakout from the same with a proper stoploss as per your own risk appetite.
=> # Please do your own research before initiating any trade. Always use stoploss in order to protect your capital.
=> #If you are Unable to trade properly and dissatisfied with your manual trading results due to psychological disadvantages or busy schedule or "Fear & Greed" emotions, then Algorithmic trading can be the most useful solution to overcome such problems. Kindly follow us and join us using details mentioned below the idea.
=> # Please refer our swing based support and resistance indicator if you find it useful give it a like.
=> # Follow us for more such information and educational ideas and Indicators. Give it a like if you appreciate the idea. Queries will be answered in comment section.
#Disclaimer: This is just a view and published here only for educational purpose, this should not be considered as a buy or sell signal. Trading in stock market may involve financial risk therefore, do your own research before taking any position.

Natural Gas Important levels to watch! Natural Gas important levels to watch are as follows
#Support: 266.1
Sell below: 266 only on 15 minute candle closure below the level.
Target 1: 263
Target 2: 259
#Resistance: 270
Buy Above: 270 only on 15 minute candle closure Above the level.
Target 1: 272.5
Target 2: 276.5
=> # Remember each level will act as a support and resistance individually so there is a probability of reversal and a pullback on either side so its better to make an habit to book profits at each targets and re-enter again after a breakout from the same with a proper stoploss as per your own risk appetite.
=> # Please do your own research before initiating any trade. Always use stoploss in order to protect your capital.
=> #If you are Unable to trade properly and dissatisfied with your manual trading results due to psychological disadvantages or busy schedule or "Fear & Greed" emotions, then Algorithmic trading can be the most useful solution to overcome such problems. Kindly follow us and join us using details mentioned below the idea.
=> # Please refer our swing based support and resistance indicator if you find it useful give it a like.
=> # Follow us for more such information and educational ideas and Indicators. Give it a like if you appreciate the idea. Queries will be answered in comment section.
#Disclaimer: This is just a view and published here only for educational purpose, this should not be considered as a buy or sell signal. Trading in stock market may involve financial risk therefore, do your own research before taking any position.

Bearish Crab In Natural GasBearish Crab In Natural Gas
Sell PRZ - 223.6/224.3
SL - 229.1
Target - 214/208

Bearish Gartley In Natural GasBearish Gartley In Natural Gas
Sell PRZ - 194.8/195
SL - 200.1
Target - 189/188

NaturalGas downtrend Movement potential with target 2.280Symbol: Natural gas
Time frame : 15 minutes
Analysis: Breakout of the support line. Natural gas downtrend movement potential.
Sell at 2.350 with stop loss 2.380 and we can expect the target up to 2.280.
HOPE our analysis is adding value to your Trading Journey.
NOTE: Published Ideas are for ‘’EDUCATIONAL PURPOSE ONLY’’ trade at your own risk.
NOTE: RESPECT The risk. SL should not be more than 2% of the capital.

Naturalgas reversal zones 11-5-2023Note: Always try to find a good price action patterns or any candle stick patterns in marked zones in smaller timeframe to take entry with small stop loss. Or can take entry based on one 5 min candle close below or above the zone with SL previous candles high or low (*try to avoid big candles).
(Color code for Support & Resistance zones: Red - Sell, Green - Buy, Price once cross above resistance it is obvious it will work as support, vis versa price cross below support zone ). Please understand that market can break all the support and resistance anytime. If any doubt for take entry in price action patterns, please ask in comment box, i will try to help.
Disclaimer: Im not tip provider and this chart is not indented to take trade in my levels, It is shared here for learning purpose. Trading in this pattern is all your own risk. #NG, #Naturalgas

Naturalgas downtrend movement potential with risk:reward 2.9 Naturalgas downtrend movement potential with risk:reward 2.9
Symbol:Natural gas
Time frame:15 minutes
Analysis: After breaking out from the range, the natural gas price rallied up, and now the price is again coming inside the range. So, we can expect downtrend movement of natural gas if and only if MACD value crosses below zero. SELL at 2.13 with stop loss of 2.30 and the target is 1.860 .
HOPE our analysis is adding value to your Trading Journey.
NOTE: Published Ideas are for ‘’EDUCATIONAL PURPOSE ONLY’’ trade at your own risk.
NOTE: RESPECT The risk. SL should not be more than 2% of the capital.
Happy Trading

NATURALGAS UPWARD MOVEMENT POTENTIAL with RISK:REWARD 2.1Natural gas analysis what is the analysis
time frame Taken 2 hours
Upward moment potential
There is a break out from the downtrend movement and we can observe two times rejections at the trend line and a third time it's rallying upside. So, we can consider the BUY call above the candle closes with RISK:reward=2.
BUY at 2.24 wit stop loss 2.08 and the target at 2.48.
NOTE: Published Ideas are for ‘’EDUCATIONAL PURPOSE ONLY’’ trade at your own risk.
NOTE: RESPECT The risk. SL should not be more than 2% of the capital.
Happy Trading

Natural Gas Support and resistance level for 24.08.2022Plot the the levels in your chart. Draw fib level from support and resistance . Please refer chart for fib level. Fib level range should be 9 am to 11:30 PM.
If price crosses fib trendline(Dash line) will consider as upside break out. If price reject from there will consider to fall below.
if one support or resistance line broken maximum target will be 1.272 or 1.1618 fib level. Moving above 1.618 fib level is very rare scenario.

Natural Gas 50% Upmove Coming ???Explosive Move Coming In Natural Gas
7 Years Long Trend Line Breakout On Monthly TF
If NG Get Close Above 4$ This July Month End
Than Buy It
Add More If Price Drops To 3.5-3.6
SL - 3.40 (Weekly Closing Basis)
Target - 6$
NLong

Natural Gas Big BreakoutBuy Natural Gas
Closing Price - 238.9
Buy 1 Lot At Cmp
Add Another Lot If Price Drop To 230-232
Strict SL - 219.7 (Day Closing Basis)
Target 1 - 278-280

Natural Gas Intraday Support and Resistance For 20/05/2021Intraday Support (1) For 20/05/2021 218.20
Intraday Support (2) For 20/05/2021 217
Intraday trading range For 20/05/2021 214-222

Natural Gas Intraday Support - Resistance Levels For 18/05/2021Intra Day Support (1) for 18/05/2021 226
Intra Day Support (2) for 18/05/2021 222.90
Intra Day Support (3)for 18/05/2021 222
Trading Range for 18/05/2021 is 232-217

Natural Gas Intraday Support - Resistance Levels For 17/05/2021Intra Day Resistance (1) for 17/05/2021 219
Intra Day Resistance (2) for 17/05/2021 217.70
Intra Day Resistance (3)for 17/05/2021 216.80
Trading Range for 17/05/2021 is 222-215

Natural Gas Intraday Support - Resistance Levels For 14/05/2021Intra Day Suppoet (1) for 13/05/2021 218.40
Intra Day Support (2) for 13/05/2021 218
Intra Day Support (3)for 13/05/2021 217.40
Trading Range for 14/05/2021 is 215-221

Natural Gas Intraday Support - Resistance Levels For 13/05/2021Intra Day Suppoet (1) for 13/05/2021 217.60
Intra Day Support (2) for 13/05/2021 216.50
Intra Day Support (3)for 13/05/2021 215.90
Trading Range for 13/05/2021 is 214-219

Natural Gas Intraday Support - Resistance Levels For 12/05/2021Intra Day Support (1) for 12/05/2021 215.70
Intra Day Support (2) for 12/05/2021 214.10
Trading Range for 12/05/2021 is 220-211

Natural Gas Intraday Support - Resistance Levels For 11/05/2021
Intra Day Resistance (1) for 11/05/2021 215.60
Intra Day Resistance (2)for 11/05/2021 216.10
Intra Day Resistance (3) for 11/05/2021 216.90
Trading Range for 11/05/2021 is 219-212
