Natural Gas Futures (INR) Weekly Chart pattern analysisNatural Gas Futures (INR) Weekly Chart pattern analysis.
For the students, We will include chart structure, patterns, demand-supply zones, and precise support/resistance levels based on what is seen on the charts :
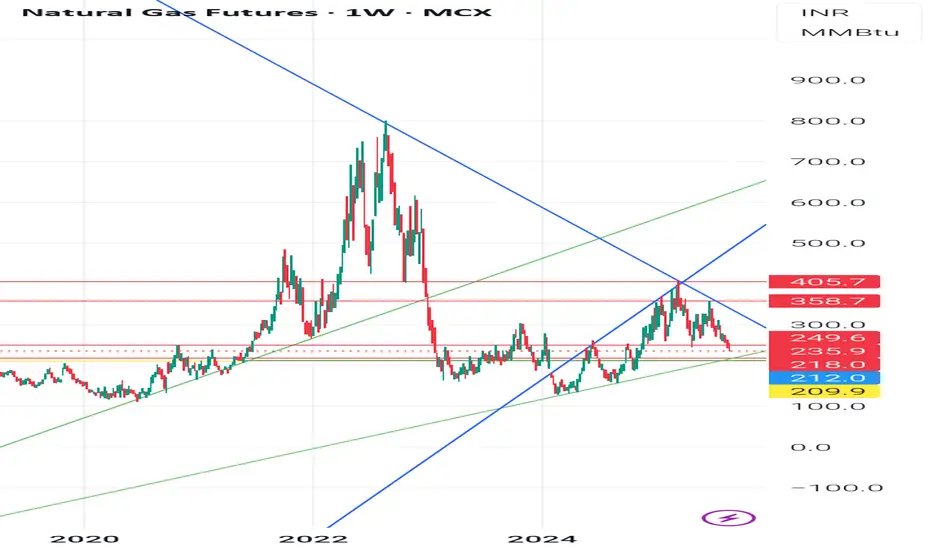
- Chart OverviewTimeframe: Weekly (1W)Current Price: 244.7 (down -5.30%)Price is near an important ascending trendline support (green line) after a strong correction from recent highs. Structure shows earlier breakout above descending trendline (blue) followed by a retest and rejection.
🧭 1. Trend Analysis- Long-Term Trend:From 2022 highs (900+), Natural Gas was in a sharp downtrend (blue descending trendline).Downtrend broke in late 2023, initiating a mid-term uptrend within an ascending channel.
Short-Term Trend:Since the 405.7 high (early 2025), prices are in a correction phase.Price now testing demand zone near 244-212.
📈 2. Chart Patterns,Ascending Channel: Price has been moving between parallel green lines since late 2023.Breakdown Risk: Price is testing the lower channel line; breakdown could trigger more downside.Head & Shoulders Possibility: The highs around 405-358 resemble a left shoulder-head-right shoulder formation, with neckline near 249-244. A confirmed break below could accelerate selling.
Supply Zone Rejection: Strong selling emerged from 358-405, marking it as a supply zone.
3. Key Technical Levels: Rejection Level: High Significance 405.7
-Major Supply 2025 high, strong rejection point 358.7
Secondary Supplying- Recent swing high before sell-off
249.6-244.7
- Current Zone - Channel support & neckline zone
218.0 - Demand Zone Past consolidation & buying interest
212.0 - Strong Support Historical demand zone floor
209.9
- Critical Support
If broken, opens path to 180-160⚖ 4. Demand & Supply ZonesDemand Zones:218-212 (weekly accumulation area)180-160 (last major base before rally)
Supply Zones:358-405 (heavy selling area)280-300 (minor supply if bounce occurs)
5. Possible ScenariosScenario
1 Support Holds:If 244-212 holds, expect a bounce towards 280 and 300.A close above 300 could re-test 358.
Scenario
2 - Breakdown:A close below 212 could lead to a quick drop towards 180-160.
👉 Disclaimer:
This is for educational purposes only, not trading advice. Futures & commodities are highly volatile; manage risk and consult a registered financial advisor.
#naturalgas #technicallevels #chartpatternabalysis #commoditytrading
Naturalgasfutures
NATURAL GAS - REVRSAL TRADE ON SHORT SIDESymbol - NATURALGAS!
NATURALGAS! is currently trading at 320
I'm seeing a trading opportunity on sell side.
Shorting NATURALGAS! Futures at CMP 320
I will be adding more position at 330, if comes.
Holding with SL 335
Targets I'm expecting are 295 - 282 & beyond.
Disclaimer - Do not consider this as a buy/sell recommendation. I'm sharing my analysis & my trading position. You can track it for educational purposes. Thanks!

NAUTRAL GAS TIME CYCLE AND HARMONICS 10-08-2023Natural Gas seen a major decline in past now Harmonics pattern...indicating (Small and Large Circle) Same pattern in Natural gas Expecting a huge rally in NG in Coming Months.
Trade in Future With SL & Carry Forward can be done.
:)
A boost is for Appreciation and Support

Natural Gas: Positional ViewExpanding wedge pattern formation, similar to crude in 2008, i'm looking to short positionally for half the price... Any news developments to support these charts?
#commodities #energy #ng

NATURAL GAS FUTURES ANALYSISHello, natural gas futures analysis & mid-term swing trade buy: 414 targets: 485/576 stoploss: 346.
LOGIC BEHIND TRADE: Natural gas futures 1w chart has formed W pattern & given breakout of resistance (targets identified from harmonic abcd/xabcd pattern level 1.414) stoploss is taken low of resistance candle if sustains above al time high can go upto 576. MCX:NATURALGAS1!

Natural GasWe have nice EQL in natural gas below that we have H1 Demand zone, though i have buy bias at H1 demand zone, we also have GAP below that demand zone which is need to be considered.
Look for LTF BOS before taking trade

Natural Gas Intraday Support and Resistance For 20/05/2021Intraday Support (1) For 20/05/2021 218.20
Intraday Support (2) For 20/05/2021 217
Intraday trading range For 20/05/2021 214-222

Natural Gas Intraday Support - Resistance Levels For 18/05/2021Intra Day Support (1) for 18/05/2021 226
Intra Day Support (2) for 18/05/2021 222.90
Intra Day Support (3)for 18/05/2021 222
Trading Range for 18/05/2021 is 232-217

Natural Gas Intraday Support - Resistance Levels For 17/05/2021Intra Day Resistance (1) for 17/05/2021 219
Intra Day Resistance (2) for 17/05/2021 217.70
Intra Day Resistance (3)for 17/05/2021 216.80
Trading Range for 17/05/2021 is 222-215

Natural Gas Intraday Support - Resistance Levels For 13/05/2021Intra Day Suppoet (1) for 13/05/2021 217.60
Intra Day Support (2) for 13/05/2021 216.50
Intra Day Support (3)for 13/05/2021 215.90
Trading Range for 13/05/2021 is 214-219

Natural Gas Intraday Support - Resistance Levels For 12/05/2021Intra Day Support (1) for 12/05/2021 215.70
Intra Day Support (2) for 12/05/2021 214.10
Trading Range for 12/05/2021 is 220-211

Natural Gas Intraday Support - Resistance Levels For 11/05/2021
Intra Day Resistance (1) for 11/05/2021 215.60
Intra Day Resistance (2)for 11/05/2021 216.10
Intra Day Resistance (3) for 11/05/2021 216.90
Trading Range for 11/05/2021 is 219-212

Natural Gas Intraday Support - Resistance For 07/05/2021 Natural Gas Intraday Support - Resistance Levels and trading Range For 07/05/2021
Intra Day Resistance (1) for 07/05/2021 216.30
Intra Day Resistance (2)for 07/05/2021 217.60
Trading Range for 07/05/2021 is 221-214

#naturalgas #commodities #mcx natural gas long as per trade setup for swing trade stop loss current swing low.
******whatever charts or levels sharing here are just for educational purpose only not a recommendation. please do your own analysis before taking any trade on them. we are not SEBI registered.
