This Stupid Simple Strategy will help you become a better traderI make educational content videos for swing trading
Charts used are 3 months or older .
NAVA

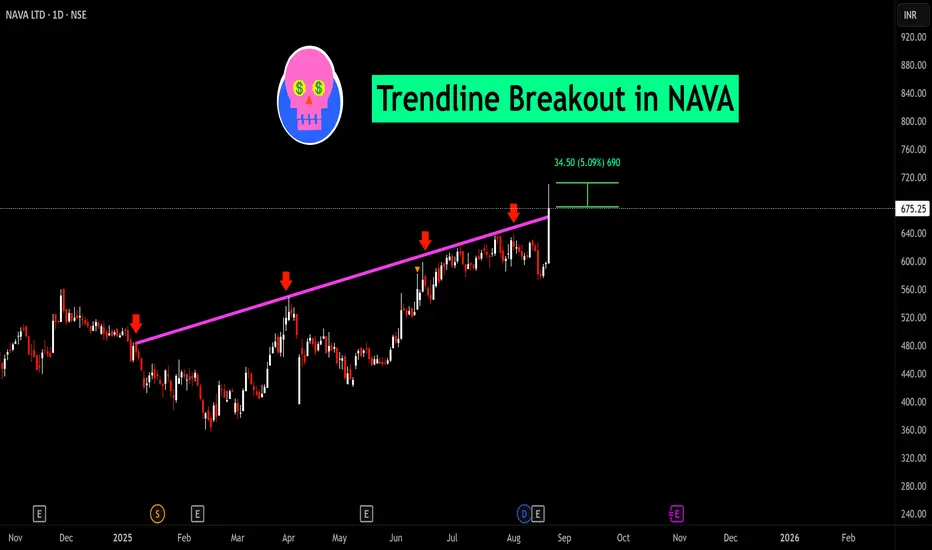
BUY TODAY SELL TOMORROW for 5%DON’T HAVE TIME TO MANAGE YOUR TRADES?
- Take BTST trades at 3:25 pm every day
- Try to exit by taking 4-7% profit of each trade
- SL can also be maintained as closing below the low of the breakout candle
Now, why do I prefer BTST over swing trades? The primary reason is that I have observed that 90% of the stocks give most of the movement in just 1-2 days and the rest of the time they either consolidate or fall
Trendline Breakout in NAVA
BUY TODAY SELL TOMORROW for 5%
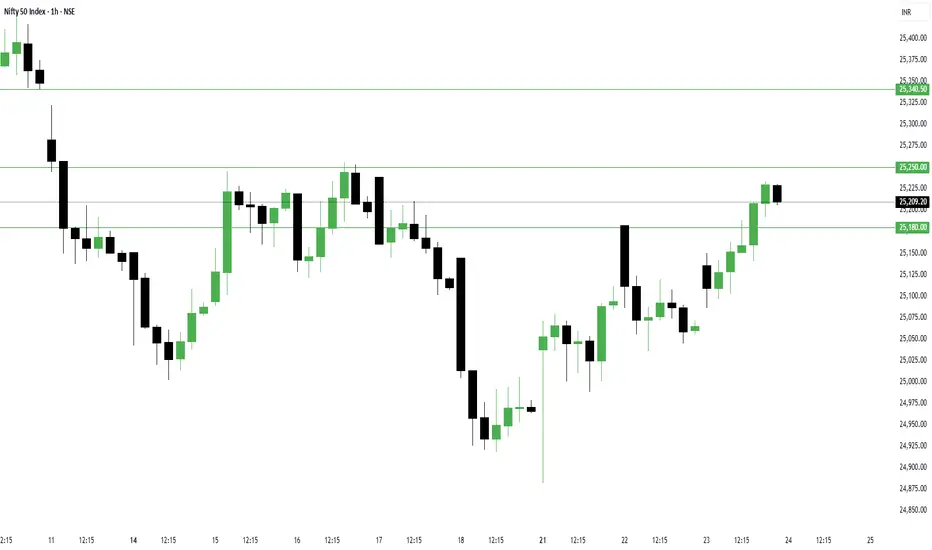
Nifty Data Suggests Next Month is Bullish!The market finally gave traders what they were waiting for – NSE:NIFTY closed above the much-watched 25200 resistance level.
But let’s not celebrate just yet; today’s move was largely driven by short covering.
Sellers still outnumber buyers by nearly 25 million volume, a sign that genuine buying interest hasn’t fully stepped in.
That said, the weakness we saw in the previous sell-off is clearly fading, and momentum is gradually returning to the market.
Today’s candle on Nifty forms a classic liquid bar, suggesting increased participation and possible continuation.
Putting these pieces together, tomorrow could play out as a sideways-to-bullish session.
But the bigger story lies ahead – rollover data hints at a bullish bias for the next series. If the current data holds, we might be looking at Nifty testing 26000 in the coming month.
My broader market view remains bullish.
For tomorrow, Nifty’s range is likely to remain tight:
Support around 25180, Resistance near 25250. A sustained move above 25250 can push us towards 25350.
Sector-wise, I continue to keep a close eye on textiles, NSE:CNXPHARMA , and Auto Components. For now, my capital remains parked in NSE:CNXENERGY , but I’m ready to rotate funds the moment a structural shift emerges in these priority sectors.
NSE:BANKNIFTY , on the other hand, seems far more decisive. Buyers dominated today with 10 million more volume than sellers, and the candle too is a liquid bar – a clear sign of strength. A new high appears just around the corner.
Expected range: Support near 56930 and Resistance around 57275.
As for the trades I got into earlier, they worked out beautifully:
NSE:OLECTRA closed 4.39% higher
NSE:NAVA gained 3.23%
NSE:GODREJAGRO rallied 4.72%
NSE:PARADEEP surged 5.56%
That’s it for today. take care, trade with discipline, and let’s prepare tonight for another profitable session tomorrow.
NAVA LTD – Breakout Retest Done, Ready for Next Leg!🚀 NSE:NAVA – Breakout Retest Done, Ready for Next Leg!
📍 CMP: ₹580.15
📊 Breakout Zone: ₹550–565 (retested successfully)
🎯 Target: ₹735.95 (🔼 +30%)
🛡️ Stoploss: ₹545 (below recent retest support)
📈 Strong breakout followed by clean retest and bullish candle
🔥 Volume trend remains elevated – signs of accumulation
🔋 Multiyear high breakout + Energy sector exposure = strong momentum setup

NAVA LTDNAVA - Nava Limited exhibits strong technical indicators with a bullish bias,
If the stock price manages to break through the 500 level, it could potentially reach targets of around 533 and then 565.

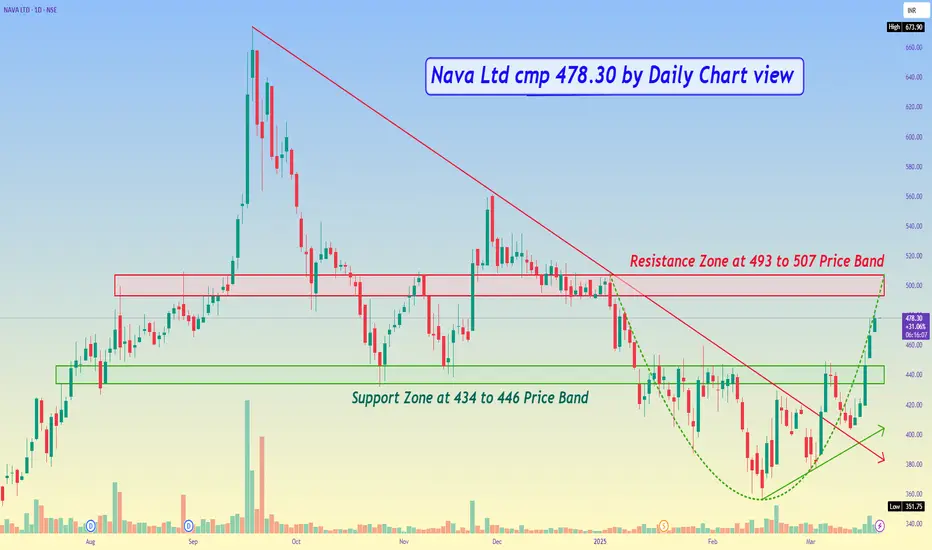
Nava Ltd cmp 478.30 by Daily Chart viewNava Ltd cmp 478.30 by Daily Chart view
- Support Zone at 434 to 446 Price Band
- Resistance Zone at 493 to 507 Price Band
- Bullish Cup & Handle done with the Support Zone neckline
- Bullish Rounding Bottom in completion stage with Resistance Zone neckline
- Falling Resistance Trendline is broken and well sustained by Price Volumes Momentum
Mother Candle & Counter Trendline Breakout | NAVA LTD📊 Technical Breakout Overview:
🔹 Mother Candle Breakout on the Weekly Timeframe – Strong bullish momentum!
🔹 Red Line (Weekly Counter Trendline) – Clean breakout, confirming trend reversal.
🔹 Yellow Dotted Line (MTF Resistance Counter Line) – Broken decisively.
🔹 Blue Line (MTF Major Resistance) – Next big target zone at ₹574.70.

NAVA LTD FOR SWING - MOMENTUM STOCKNAVA LTD looking good for Swing.
Momentum Indicators Showing Bullish Strength.
Already in a very Good Uptrend.
Now Ready for upside 1400-1600-1800+
Weak below 1190 on closing Basis.

Nava Limited - Breakout Setup, Move is ON...#NAVA trading above Resistance of 1032
Next Resistance is at 1245
Support is at 867
Here are previous charts:
Chart is self explanatory. Levels of breakout, possible up-moves (where stock may find resistances) and support (close below which, setup will be invalidated) are clearly defined.
Disclaimer: This is for demonstration and educational purpose only. This is not buying or selling recommendations. I am not SEBI registered. Please consult your financial advisor before taking any trade.

Nava Limited - Breakout Setup, Move is ON...#NAVA trading above Resistance of 867
Next Resistance is at 1032
Support is at 673
Here are previous charts:
Chart is self explanatory. Levels of breakout, possible up-moves (where stock may find resistances) and support (close below which, setup will be invalidated) are clearly defined.
Disclaimer: This is for demonstration and educational purpose only. This is not buying or selling recommendations. I am not SEBI registered. Please consult your financial advisor before taking any trade.

Nava Limited - Breakout Setup, Move is ON...#NAVA trading above Resistance of 673
Next Resistance is at 867
Support is at 537
Here are previous charts:
Chart is self explanatory. Levels of breakout, possible up-moves (where stock may find resistances) and support (close below which, setup will be invalidated) are clearly defined.
Disclaimer: This is for demonstration and educational purpose only. This is not buying or selling recommendations. I am not SEBI registered. Please consult your financial advisor before taking any trade.

Nava Limited - Breakout Setup, Move is ON...#NAVA trading above Resistance of 583
Next Resistance is at 673
Support is at 431
Here are previous charts:
Chart is self explanatory. Levels of breakout, possible up-moves (where stock may find resistances) and support (close below which, setup will be invalidated) are clearly defined.
Disclaimer: This is for demonstration and educational purpose only. This is not buying or selling recommendations. I am not SEBI registered. Please consult your financial advisor before taking any trade.

Nava Limited - Long Setup, Move is ON...#NAVA trading above Resistance of 431
Next Resistance is at 583
Support is at 277
Here is previous chart:
Chart is self explanatory. Entry, Resistances and Support are mentioned on the chart.
Disclaimer: This is for demonstration and educational purpose only. This is not buying or selling recommendations. I am not SEBI registered. Please consult your financial advisor before taking any trade.

NAVA LtdNava Ltd CMP 501 available at PE of 8 only. Market Cap only 7280 cr on the sales of 3778 Cr. Seems very cheap fundamentally even though it ATH.
Nava Bharat Ventures Ltd was established in 1972 as an Indian ferro alloys manufacturer, Nava Bharat is now a multinational company, operating in India, South East Asia and Africa with businesses in metals manufacturing, power, mining, agribusiness and healthcare.
Can be added on every dip.

NAVA for a swing short term Value undervalued company having very great financial figures
after a great rally from 250 to 450 now again taking support at 200EMA .
A Good Reward/Risk = 4:1 can be a great swing trade.

Nava Ltd - Galloping towards 600#NAVALTD
CMP ₹.450/-
Stock from power sector, looking good. Breakout happened in 2.5 year long and 1 year long resistance trend line. Technically looking good but due to the overall blood bath in market recently, it is very difficult for the stock to survive and keep the trend. Some fall can be expected with prevailing market trends. But if it can outlive the whole market trend then a 40% - 50% move can be expected from here.

Nava surges 13%, hits record highNava surges 13%, hits record high in weak market on heavy volumes
In past four months, the stock price of Nava has appreciated by 84 per cent after the company recorded a remarkable financial performance for June quarter (Q1FY24).
Shares of Nava (formerly Nava Bharat Ventures Limited) hit a record high of Rs 465.65, as they rallied 13 per cent on the BSE in Thursday’s intra-day trade on the back of heavy volumes in an otherwise weak market. The trading volumes on the counter jumped over three-fold with a combined around 3.6 million equity shares of the company changing hands on the NSE and BSE till 11:11 AM. In comparison, the S&P BSE Sensex was down 0.66 per cent at 66,366.

Nava- Some Big thing is cooking , preparing to blastUpdated Idea - Near 52 week high with significant volumes and highest recovery from 52 week high. Profit booking can happen soon .Expecting 20% movement nearer to 360 levels within a short span of time.Reducing debt is also a positive sign.

Wings to NavaChart -> Nava Daily
All time high breakout with volume and cup & handle pattern can give wings to Nava.
CMP: 292
Good Range: 280 to 290
Target: 340, 380
SL: 270 Daily Close
Disclaimer: This is for educational purposes only, not any recommendations to buy or sell. As I am not SEBI registered, please consult your financial advisor before taking any action.

Nava- Cup & Handle PatternA small cup & handle formation is seen in the charts with good price volume deal. The stock also surpassed its long term resistance line. Now trying to break 10 months band and its 10 months old parallel channel.If this price volume movement repeats , definitely it will move a 100 points more within a short time span.

Nava LtdBullish on Nava Ltd
CMP 244. SL 232, Target1 260 Target2 270
RSI 52. Taking support on 55SMA
Stock has been corrected after breakout . Good volumes on green candles.
Analysis based on trendline.
Disclaimer :- This is not any buy or sell recommendation, it is just for educational purpose. Take any buy or sell call only after consulting with your financial expert. Keep learning, keep growing.

NAVA Ltd - Consolidation going on for last one yearOnly for educational purpose.Not a recommendation . No big movement is expecting.
Stock from power sector . Fundamentals are also moderate with fair momentum. Immediete resistance @255 and support @ 227 . No high movement expected .10-20 points can be moved from here in a 6 month run.

