NAZARA TECH LTD ANALYSISFOR LEARNING PURPOSE
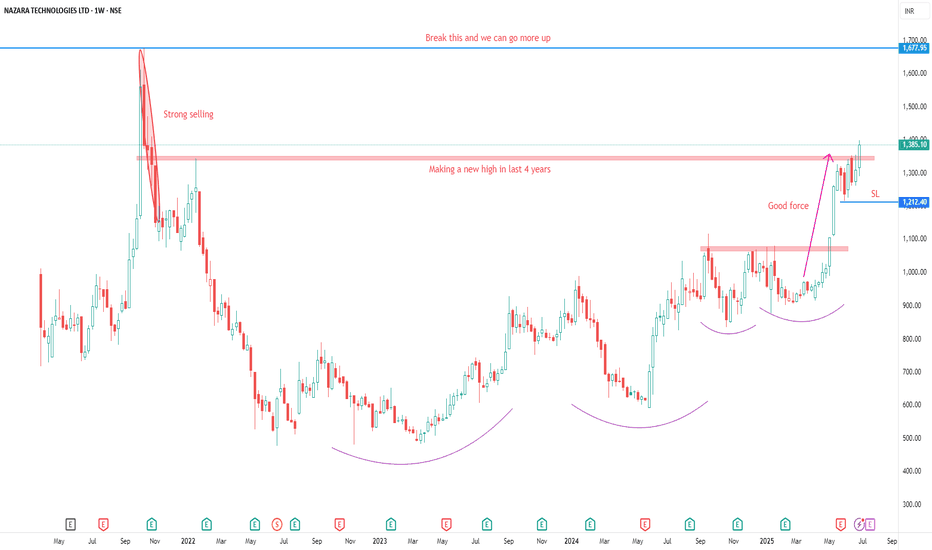
NAZARA TECH LTD - The current price of NAZARA TECH LTD is 1385.10 rupees
I am going to buy this stock because of the reasons as follows-
1. Its coming out from a good consolidation base
2. It broke a strong resistance zone of 4 year and it's trying to go for new ATH
3. It is showing better relative strength as it stood strong in volatile times
4. The risk and reward is favourable
5. The stock belongs to a sector which is trying its best to be strong and probably it can do great in coming days.
6. The stock has done almost nothing in last 5 years (approx) and it has acted as a laggard (many stocks have made ATH much back but this stock has gone down after its IPO. Initially it went up a bit but then it was all down move)
I will buy it with minimum target of 35-40% and then will trail after that.
My SL is at 1212 rupees
I will be managing my risk.
NAZARA
NAZARA | Flag and Pole | Breakout | Daily---
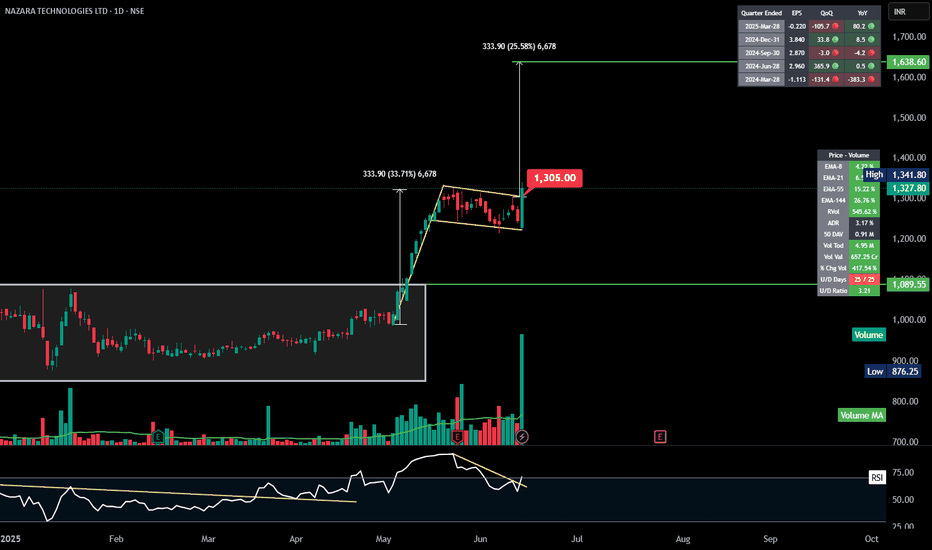
## 🚩 **NAZARA TECH – Bullish Flag and Pole Breakout**
### 📍 **Pattern: Flag and Pole**
* **Pole**: A strong vertical rally of **₹333.90** (\~33.7%)
* **Flag**: A downward-sloping consolidation (tight range), indicating **temporary pause**
* ✅ **Breakout from flag** with **volume spike** confirms continuation
---
### 📈 **Price Action & Levels**
* **Pole Base**: \~₹990
* **Pole Height**: ₹333.90
* **Breakout Point**: \~₹1308
* **Target Projection**: ₹1350+ ₹333.90 = **₹1638** 🎯
---
### 📊 **Technical Strength**
* ✅ **All EMAs** (8, 21, 55, 144) are bullishly aligned
* ✅ **Volume** surged on breakout, validating the move
* ✅ **RSI** broke out of downward trendline, resuming upside momentum
---
### 🔍 **Key Levels**
* **Support**: ₹1240 (flag base), ₹1089 (pole base & rectangle top)
* **Resistance**: ₹1342 (current high), then **₹1590+** (target zone)
* **Stop Loss (Swing)**: Below ₹1305 or ₹1240 zone
---
### 🧠 **Bias**: **Bullish Continuation**
Ideal for swing trades; entry on breakout retest or momentum continuation.
NAZARA - Cup and Handle breakout - WklyName - NAZARA
Pattern - Cup and Handle breakout
Timeframe - Daily and Weekly
Volume - Very Good
Cmp - 1049
Can test - 1390
SL - 989
Cup and Handle pattern, which is a bullish continuation pattern indicating a potential upward trend. Here are some key points from the chart:
Cup and Handle Pattern: This pattern suggests that after a period of consolidation (the “cup”), there is a slight dip (the “handle”) before a potential breakout to higher prices.
Neckline: The neckline is marked at 989. This is a critical resistance level. Price breaks above this level, it has confirm the pattern and lead to further gains.
Target Price: The potential target price is around 1390 if the pattern completes successfully.
Volume: There is a significant increase in trading volume, highlighted by a large green bar. This often indicates strong buying interest and can support the bullish breakout.
Overall, the chart suggests a positive outlook if the price breaks above the neckline with strong volume support.
Price in range from 475 to 989 for 2.6 yr, Friday price closed abv that.
Nazara Technologies reported its Q1 FY24 results, showcasing a strong performance. Here are the key highlights:
Revenue: ₹250 crores, a slight dip from ₹254.4 crores in the same quarter last year1.
Net Profit: ₹23.6 crores, marking a 12.9% increase from ₹20.9 crores in the previous year2.
EBITDA: ₹24.9 crores, a 24.7% decrease year-on-year2.
The growth in net profit was driven by a strong performance in the esports vertical, despite lower profits in the gaming segment and losses in adtech2.
Nazara TechnologyWe are closely following Nazara Technologies and believe it’s poised for a breakout based on its technical patterns. Consolidation near resistance often suggests a potential for a breakout if the price action confirms it. If Nazara Technologies breaks through the 1020 level, it could indeed pave the way for further upside, potentially reaching your targets of 1350, 1500, and 1650+.
It’s always good to keep an eye on broader market conditions and any company-specific news that could impact the stock’s performance. Additionally, setting stop-loss orders or having an exit strategy in place might help manage risk if the price movement doesn’t go as expected.
Golden Crossover - NAZARA📊 Script: NAZARA
📊 Sector: Telecomm-Service
📊 Industry: Telecommunications - Service Provider
Key highlights: 💡⚡
📈 Golden Crossovers are seen into this Script.
📈 Golden Crossover is where slow moving average line crosses fast moving average above.
📈 Although Script is trading at All Time High we may see some bullish rally.
⏱️ C.M.P 📑💰- 873
🟢 Target 🎯🏆 - 932
⚠️ Important: Always maintain your Risk & Reward Ratio.
✅Like and follow to never miss a new idea!✅
Disclaimer: I am not SEBI Registered Advisor. My posts are purely for training and educational purposes.
Eat🍜 Sleep😴 TradingView📈 Repeat 🔁
Happy learning with trading. Cheers!🥂
Nazara-Have your Nazar on it ;)Nazara is a company which develops gaming software.
Stock has given good volume breakout from a strong resistance zone.
Immediate resistance is 1000 above which stock will fly.
As i said, keep this stock in your nazar(watchlist)
Risky traders can enter as per my levels for better risk reward.
Do follow me if you like my analysis!
NAZARA | Swing Trade📊 DETAILS
Sector: Software
Mkt Cap: 6,885 cr
Nazara Technologies is the leading India based diversified gaming and sports media platform with presence in India and across emerging and developed global markets such as Africa and North America, and offerings across the interactive gaming, eSports and gamified early learning ecosystems.
TTM PE : --
Sector PE : 34.24
Beta : 0.72
📚 INSIGHTS
Mid range performer
Stock with medium financial performance with average price momentum and valuation. These stocks may be affordable and are showing some investors interest.
7.23% away from 52 week high
Outperformer - Nazara Technologies up by 9.03% v/s NIFTY 50 up by 2.28% in last 1 month
📈 FINANCIALS
Piotroski Score of 5/9 indicates Average Financials
Disclaimer: This analysis is for educational purposes only, and I'm not a SEBI registered analyst.
If you found this analysis helpful, I encourage you to like and share it. Your observations and comments are also welcomed below. Your support, likes, follows, and comments motivate me to consistently share valuable insights with you.
🔍 More Analysis & Trade Setups 🔍
For more technical analysis and trade setups, make sure to follow me on TradingView: www.tradingview.com
NAZARA | Good for Long |NSE:NAZARA CMP: 685.85
Reason for Trade : WEEKLY BO
Entry : Cmp or near Support 930
Stop Loss: According to one's Risk Reward ratio
#Study, Learn & Earn.
If you love this post please like and comment your thoughts below. That will be a great motivation for me to post similar ideas ahead.
Disclaimer: All the information posting on this page are for the educational purpose only, we are not SEBI registered financial advisor. We wont recommend any BUY/SELL of stocks. Contact your financial advisor before taking any action
"NAZARA: Third Time's the Charm - Breaking Resistance for a PotIntroduction:
NAZARA has been an interesting play lately, attempting to break through resistance not once, but twice. After two unsuccessful attempts, there are strong indications that the stock is gearing up for a breakthrough on its third try. Additionally, the weekly timeframe is showing signs of an uptrend, adding to the bullish sentiment.
Key Points:
1. Previous Resistance Attempts:
- NAZARA has faced resistance on two occasions in recent times. The fact that the stock is persistently attempting to break through suggests a growing bullish sentiment.
2. Third Attempt at Resistance:
- The third attempt to break resistance is on the horizon, and it could be the charm. Keep a close eye on the stock as it makes this crucial move, as the third attempt often indicates increased determination to break through.
3. Uptrend on the Weekly Timeframe:
- On the weekly timeframe, NAZARA is showing signs of an uptrend. This adds a strong technical backdrop to the potential breakout, indicating a broader positive trend in the stock.
Note of Caution:
Before considering any trade based on this analysis, it's crucial to conduct your own research. Market conditions can change rapidly, and individual stocks are influenced by various factors. Ensure you understand the risks involved and use this information as a starting point for your due diligence.
Remember, no analysis can guarantee future performance, and it's always wise to have a well-thought-out trading or investment strategy.
NAZARA - Weekly chart - Continuation breakoutThe analysis is done on Weekly TF hence price may take few weeks to few months in order to reach the targets. Trade setup is explained in image itself. This is a continuation breakout chart.
The above analysis is purely for educational purpose. Traders must do their own study & follow risk management before entering into any trade
Checkout my other ideas to understand how one can earn from stock markets with simple trade setups. Feel Free to comment below this or connect with me for any query or suggestion regarding this stock or Price Action Analysis.
NAZARA - Ichimoku Bullish Breakout Stock Name - Nazara Technologies Ltd
Ichimoku Cloud Setup :
1). Today's close is above the Conversion Line
2). Future Kumo is Turning Bullish
3). Chikou span is slanting upwards
All these parameters are showing bullishness at Current Market Price
and more bullishness AFTER crossing 790
#This is not Buy and Sell recommendation to any one. This is for education purpose and a helping hand to learn trading in Market.
# Cloud Trading
# Ichimoku Cloud
# Ichimoku Followers
I hope you all like my analysis.
Please do share your thoughts into comment section.
Please give a like, it motivates me to do analysis.


