NAZARA TECH LTD ANALYSISFOR LEARNING PURPOSE
NAZARA TECH LTD - The current price of NAZARA TECH LTD is 1385.10 rupees
I am going to buy this stock because of the reasons as follows-
1. Its coming out from a good consolidation base
2. It broke a strong resistance zone of 4 year and it's trying to go for new ATH
3. It is showing better relative strength as it stood strong in volatile times
4. The risk and reward is favourable
5. The stock belongs to a sector which is trying its best to be strong and probably it can do great in coming days.
6. The stock has done almost nothing in last 5 years (approx) and it has acted as a laggard (many stocks have made ATH much back but this stock has gone down after its IPO. Initially it went up a bit but then it was all down move)
I will buy it with minimum target of 35-40% and then will trail after that.
My SL is at 1212 rupees
I will be managing my risk.
Nazaratech

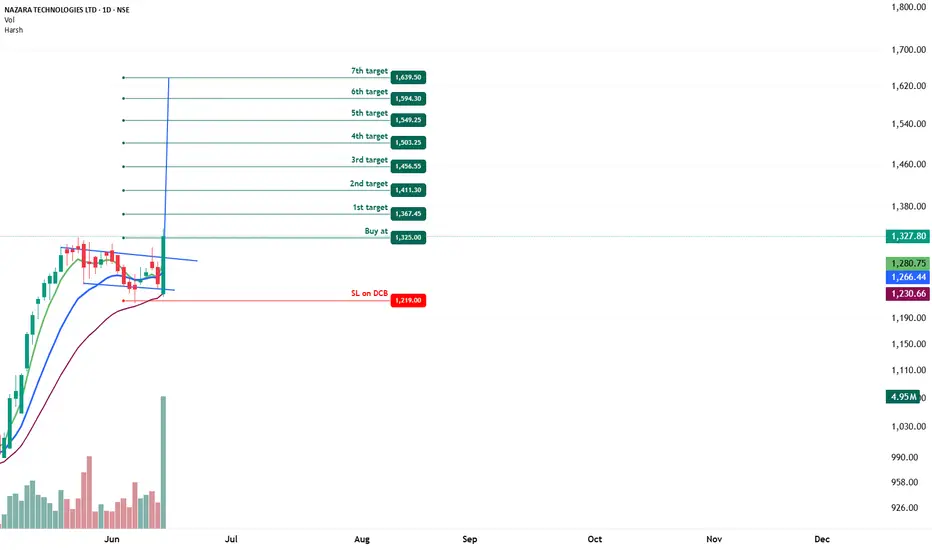
NAZARA TECHNOLOGIES - Bullish Flag & Pole Breakout (Daily T/F)Trade Setup
📌 Stock: ( NSE:NAZARA )
📌 Trend: Strong Bullish Momentum
📌 Risk-Reward Ratio: 1:3 (Favorable)
🎯 Entry Zone: ₹1325.00 (Breakout Confirmation)
🛑 Stop Loss: ₹1219.00 (Daily Closing Basis) (-12 % Risk)
🎯 Target Levels:
₹1367.45
₹1411.30
₹1456.55
₹1503.25
₹1549.25
₹1594.30
₹1639.50 (Final Target)
Technical Rationale
✅ Bullish Flag & Pole Breakout - Classic bullish pattern confirming uptrend continuation
✅ Strong Momentum - Daily RSI > 60, Weekly RSI >60 mONTHLY rsi ABOVE 60
✅ Volume Confirmation - Breakout volume 4.95M vs previous day's 946.53K (Nearly 4.5x surge)
✅ Multi-Timeframe Alignment - Daily and weekly charts showing strength
Key Observations
• The breakout comes with significantly higher volume, validating strength
• Well-defined pattern with clear price & volume breakout
• Conservative stop loss at recent swing low
Trade Management Strategy
• Consider partial profit booking at each target level
• Move stop loss to breakeven after Target 1 is achieved
• Trail stop loss to protect profits as price progresses
Disclaimer ⚠️
This analysis is strictly for educational purposes and should not be construed as financial advice. Trading in equities involves substantial risk of capital loss. Past performance is not indicative of future results. Always conduct your own research, consider your risk appetite, and consult a financial advisor before making any investment decisions. The author assumes no responsibility for any trading outcomes based on this information.
What do you think? Are you watching NSE:NAZARA for this breakout opportunity? Share your views in the comments!
NAZARA | Flag and Pole | Breakout | Daily---
## 🚩 **NAZARA TECH – Bullish Flag and Pole Breakout**
### 📍 **Pattern: Flag and Pole**
* **Pole**: A strong vertical rally of **₹333.90** (\~33.7%)
* **Flag**: A downward-sloping consolidation (tight range), indicating **temporary pause**
* ✅ **Breakout from flag** with **volume spike** confirms continuation
---
### 📈 **Price Action & Levels**
* **Pole Base**: \~₹990
* **Pole Height**: ₹333.90
* **Breakout Point**: \~₹1308
* **Target Projection**: ₹1350+ ₹333.90 = **₹1638** 🎯
---
### 📊 **Technical Strength**
* ✅ **All EMAs** (8, 21, 55, 144) are bullishly aligned
* ✅ **Volume** surged on breakout, validating the move
* ✅ **RSI** broke out of downward trendline, resuming upside momentum
---
### 🔍 **Key Levels**
* **Support**: ₹1240 (flag base), ₹1089 (pole base & rectangle top)
* **Resistance**: ₹1342 (current high), then **₹1590+** (target zone)
* **Stop Loss (Swing)**: Below ₹1305 or ₹1240 zone
---
### 🧠 **Bias**: **Bullish Continuation**
Ideal for swing trades; entry on breakout retest or momentum continuation.

NAZARA TECHNOLOGIESKhelo India Khelo.
I like the contraction happening on the larger scheme of things.
VCP + Inverted HnS appear to my eyes.
The pattern is looking good prima facie and I am going with a gut feel here.
Maintain an SL based on risk appetite.

NAZARA - Cup and Handle breakout - WklyName - NAZARA
Pattern - Cup and Handle breakout
Timeframe - Daily and Weekly
Volume - Very Good
Cmp - 1049
Can test - 1390
SL - 989
Cup and Handle pattern, which is a bullish continuation pattern indicating a potential upward trend. Here are some key points from the chart:
Cup and Handle Pattern: This pattern suggests that after a period of consolidation (the “cup”), there is a slight dip (the “handle”) before a potential breakout to higher prices.
Neckline: The neckline is marked at 989. This is a critical resistance level. Price breaks above this level, it has confirm the pattern and lead to further gains.
Target Price: The potential target price is around 1390 if the pattern completes successfully.
Volume: There is a significant increase in trading volume, highlighted by a large green bar. This often indicates strong buying interest and can support the bullish breakout.
Overall, the chart suggests a positive outlook if the price breaks above the neckline with strong volume support.
Price in range from 475 to 989 for 2.6 yr, Friday price closed abv that.
Nazara Technologies reported its Q1 FY24 results, showcasing a strong performance. Here are the key highlights:
Revenue: ₹250 crores, a slight dip from ₹254.4 crores in the same quarter last year1.
Net Profit: ₹23.6 crores, marking a 12.9% increase from ₹20.9 crores in the previous year2.
EBITDA: ₹24.9 crores, a 24.7% decrease year-on-year2.
The growth in net profit was driven by a strong performance in the esports vertical, despite lower profits in the gaming segment and losses in adtech2.

"NAZARA: Third Time's the Charm - Breaking Resistance for a PotIntroduction:
NAZARA has been an interesting play lately, attempting to break through resistance not once, but twice. After two unsuccessful attempts, there are strong indications that the stock is gearing up for a breakthrough on its third try. Additionally, the weekly timeframe is showing signs of an uptrend, adding to the bullish sentiment.
Key Points:
1. Previous Resistance Attempts:
- NAZARA has faced resistance on two occasions in recent times. The fact that the stock is persistently attempting to break through suggests a growing bullish sentiment.
2. Third Attempt at Resistance:
- The third attempt to break resistance is on the horizon, and it could be the charm. Keep a close eye on the stock as it makes this crucial move, as the third attempt often indicates increased determination to break through.
3. Uptrend on the Weekly Timeframe:
- On the weekly timeframe, NAZARA is showing signs of an uptrend. This adds a strong technical backdrop to the potential breakout, indicating a broader positive trend in the stock.
Note of Caution:
Before considering any trade based on this analysis, it's crucial to conduct your own research. Market conditions can change rapidly, and individual stocks are influenced by various factors. Ensure you understand the risks involved and use this information as a starting point for your due diligence.
Remember, no analysis can guarantee future performance, and it's always wise to have a well-thought-out trading or investment strategy.

Movement to the upside!Nazara what I can say? Haha a big movement of 100% rally to the upside for longterm

NAZARA - Weekly chart - Continuation breakoutThe analysis is done on Weekly TF hence price may take few weeks to few months in order to reach the targets. Trade setup is explained in image itself. This is a continuation breakout chart.
The above analysis is purely for educational purpose. Traders must do their own study & follow risk management before entering into any trade
Checkout my other ideas to understand how one can earn from stock markets with simple trade setups. Feel Free to comment below this or connect with me for any query or suggestion regarding this stock or Price Action Analysis.

Nazara Tech zooms 12% on plan to raise Rs 100 crNazara Tech zooms 12% on plan to raise Rs 100 cr from Nikhil Kamath's firms
The company said it is proposing to issue 1.4 million equity shares at a price of Rs 714 per equity share aggregating to Rs 100 crore proportionately to M/s Kamath Associates & M/s NKSquared.
Shares of Nazara Technologies hit a 52-week high of Rs 853.25, as they surged 12 per cent on the BSE in Wednesday’s intra-day trade after the company announced plans to raise Rs 100 crore by issuing shares on preferential basis to Nikhil Kamath’s firms.
Nazara, diversified gaming and sports media platform, today said its board has approved preferential allotment of equity shares to raise up to Rs 100 crore, subject to necessary approvals.
The company is proposing to issue 1.4 million equity shares at a price of Rs 714 per equity share aggregating to Rs 100 crore proportionately to M/s Kamath Associates & M/s NKSquared. These equity shares will be locked in for a period of 6 months from the date of issue.

NAZARA TECH - 75% RETURNS!!!BUY - NAZARA TECHNOLOGIES LTD
CMP - Rs. 562
Target - 1: Rs. 630
Target - 2: Rs. 760
Target - 2: Rs. 980
.
.
Technicals - Stock is at support.
.
This is just a view by an expert analyst, please invest at your own risk.
.
Follow me for more!

NAZARA : Looking for buyNazara Technologies is looking for buying opportunity after having massive correction & formed descending channel. Target expecting to reach at least 1700.


VCP breakout in NazaraChart -> Nazara Weekly
After having a huge uptrend, then a huge downtrend again stock is looking to start a reversal that is an uptrend.
A VCP breakout in Nazara with unusual volumes.
CMP: 735
Targets: 819, 994, 1121
SL: 627, weekly close
Disclaimer: This is for educational purposes only, not any recommendations to buy or sell. As I am not SEBI registered, please consult your financial advisor before taking any action.

Nazara Box breakout patternNazara Box breakout pattern formed and breakout happened at 2400 levels. Next levels to watch out are 2506,2624-2645, 2810-2825, 2900+


Fresh All time high breakoutBreakout retest done( use dips to add)
Good zone to accumulate is 1980-2020
Avoid below 1900
Possible targets - 2400-2500
Disclaimer:- View is only for educational purpose.

NAZARA TECHNOLOGIES COMING DAYS PROFIT BOOKING COMES - ALERTNext week profit booking comes till 2600 to 2800 levels. dont buy fresh long position.climax volume occur


LONG ON NAZARA TECHNazar tech since its listing has been working in the range and finally, that range got broke and now it is retested! i.e. higher confirmation on the bullish momentum!

Nazara technolofiesBreakout above 1801
likely pull back...
enter at appropriate levels...
trading levels marked...
Bounce expected near 1850


Breakout Stock - Nazara Tech."Nazara ka ab Nazara dekho"
Breakout today with good volumes.
Small consolidation at support is over.
Last two candles are thick. Looks impresive.
IT sector is rallying for last few days.
Keep this one in radar.
This post is for information purpose only.
