NAZARA TECHNOLOGIES LTD | Monthly Chart Breakout📊 NAZARA TECHNOLOGIES LTD (NSE: NAZARA) | Monthly Chart Breakout
📅 Date: June 1, 2025
📈 CMP: ₹1,295.10 (+28.04%)
📌 Ticker: NSE:NAZARA
📉 Chart Pattern Insight
🔥 Cup & Handle + Falling Wedge Breakout
Nazara Tech has broken out of a strong Cup & Handle pattern, reinforced by a Falling Wedge breakout — a powerful confluence suggesting a major trend reversal.
🎯 Breakout is confirmed with high volume and a clean monthly candle close above key resistances.
📐 Fibonacci Retracement Levels (From High ₹1678 to Low ₹477)
🔸 38.2% – ₹935.85 (was resistance, now flipped to support)
🔸 50% – ₹1,077.55
🔸 61.8% – ₹1,219.25 (just surpassed – strong bullish confirmation)
🧭 100% – ₹1,678 (All-Time High)
📊 Indicator: RSI + Moving Average Cross (Icon shown)
🔍 RSI is at 71.63 and rising sharply, indicating strong momentum
🔺 RSI crossover above MA confirms bullish strength and trend continuation
🧱 Volume Spike
📈 Volume this month is multi-month high, validating the breakout
🔑 Key Levels
Support: ₹935 (prior resistance, now retest zone)
Immediate Resistance: ₹1,300 (psychological), ₹1,400
Target Zones:
Short-Term: ₹1,450
Medium-Term: ₹1,600+
Long-Term: Retest of All-Time High ₹1,678+
🛡️ SL: ₹935 (monthly close basis)
📌 Trading Plan
Entry: Pullback near ₹1,220–₹1,250 or breakout retest
SL: ₹935 (below 38.2%)
Target: ₹1,450 / ₹1,600+
Time Frame: Positional – Multi-week to multi-month
⚠️ Disclaimer
This analysis is for educational purposes only. Please do your own research or consult a SEBI-registered advisor before investing.
Nazaratechnology

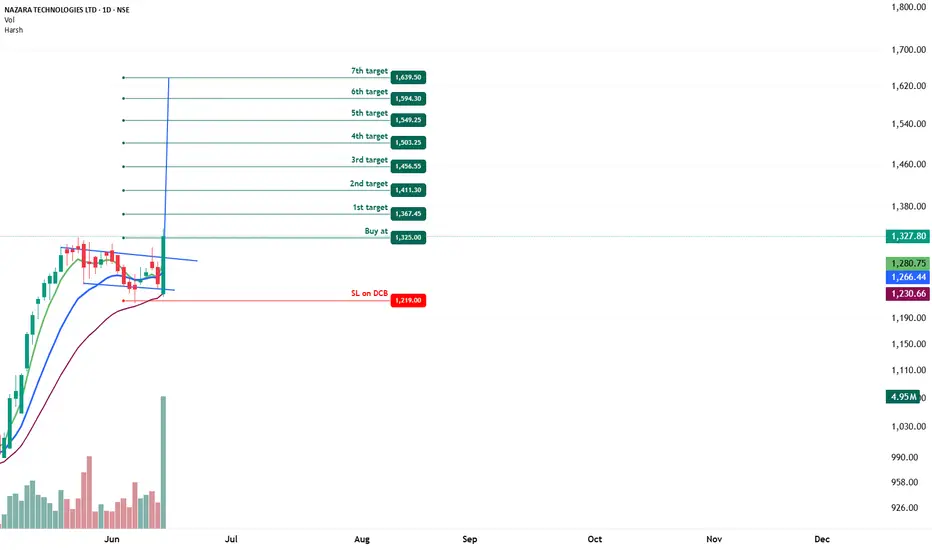
NAZARA TECHNOLOGIES - Bullish Flag & Pole Breakout (Daily T/F)Trade Setup
📌 Stock: ( NSE:NAZARA )
📌 Trend: Strong Bullish Momentum
📌 Risk-Reward Ratio: 1:3 (Favorable)
🎯 Entry Zone: ₹1325.00 (Breakout Confirmation)
🛑 Stop Loss: ₹1219.00 (Daily Closing Basis) (-12 % Risk)
🎯 Target Levels:
₹1367.45
₹1411.30
₹1456.55
₹1503.25
₹1549.25
₹1594.30
₹1639.50 (Final Target)
Technical Rationale
✅ Bullish Flag & Pole Breakout - Classic bullish pattern confirming uptrend continuation
✅ Strong Momentum - Daily RSI > 60, Weekly RSI >60 mONTHLY rsi ABOVE 60
✅ Volume Confirmation - Breakout volume 4.95M vs previous day's 946.53K (Nearly 4.5x surge)
✅ Multi-Timeframe Alignment - Daily and weekly charts showing strength
Key Observations
• The breakout comes with significantly higher volume, validating strength
• Well-defined pattern with clear price & volume breakout
• Conservative stop loss at recent swing low
Trade Management Strategy
• Consider partial profit booking at each target level
• Move stop loss to breakeven after Target 1 is achieved
• Trail stop loss to protect profits as price progresses
Disclaimer ⚠️
This analysis is strictly for educational purposes and should not be construed as financial advice. Trading in equities involves substantial risk of capital loss. Past performance is not indicative of future results. Always conduct your own research, consider your risk appetite, and consult a financial advisor before making any investment decisions. The author assumes no responsibility for any trading outcomes based on this information.
What do you think? Are you watching NSE:NAZARA for this breakout opportunity? Share your views in the comments!
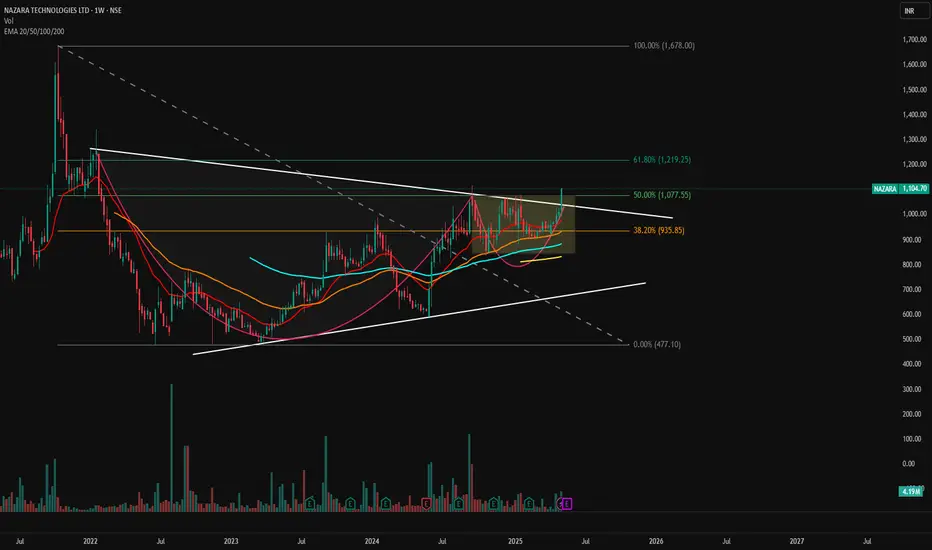
NAZARA - Breakout from Long-Term Falling Wedge📊 NAZARA – Breakout from Long-Term Falling Wedge | Strong Weekly Momentum
🕰️ Timeframe: Weekly | 💥 Pattern: Falling Wedge Breakout | 🔥 Sentiment: Bullish
📈 Chart Overview:
Nazara Technologies has broken out of a multi-year falling wedge on the weekly chart, with a strong green candle above key EMAs and Fibonacci confluence zones. Price closed the week above ₹1,100, indicating a shift in long-term momentum and a potential start of a fresh uptrend.
🔍 Technical Highlights:
📉 Falling Wedge Pattern: Multi-year consolidation now broken on strong volume
💥 Breakout Candle: Price closed above trendline resistance and key Fibonacci 50% level
🧠 Volume Surge: Volume confirmation signals institutional interest
📊 EMA Confluence: Price trading above 20/50/100/200 EMAs – bullish alignment
🧱 Support & Resistance Levels:
Level Type Price (₹)
🔼 Resistance 1 1,219.25 (Fib 61.8%)
🔼 Resistance 2 1,678.00 (Previous ATH / Fib 100%)
🔻 Support 1 1,077.55 (Fib 50% – breakout zone)
🔻 Support 2 935.85 (Fib 38.2% + EMA cluster)
🔻 Support 3 820–860 (multi-touch horizontal support & EMA 200)
🔧 Indicators Used:
Fibonacci Retracement – Plotted from swing low ₹477.10 to high ₹1,678.00
EMA 20/50/100/200 – Price is now above all EMAs, showing trend shift
Volume Bars – Confirming strong breakout
Chart Pattern – Falling wedge (typically bullish)
📌 Chart Sentiment & Setup:
✅ Bias: Strongly Bullish
📍 Breakout Level: ₹1,077
🎯 Upside Targets: ₹1,219 → ₹1,320 → ₹1,678
❌ Invalidation: Sustained close below ₹935 with volume
📢 Summary:
Nazara is showing signs of a structural breakout after prolonged downtrend and consolidation. The falling wedge breakout, confirmed by volume and EMA crossover, sets up a long-term bullish outlook. A retest of the ₹1,075–₹1,100 zone could offer a high-probability entry.
🧠 Pro Tip: Wait for a weekly candle close and minor pullback to the breakout level before entry.
⚠️ Disclaimer: This is a technical analysis post meant for educational purposes only. Please do your own research or consult a financial advisor before investing.
🔔 Follow @PriceAction_Pulse for more actionable swing setups, breakout alerts, and chart breakdowns!
NAZARA TECHNOLOGIESKhelo India Khelo.
I like the contraction happening on the larger scheme of things.
VCP + Inverted HnS appear to my eyes.
The pattern is looking good prima facie and I am going with a gut feel here.
Maintain an SL based on risk appetite.

Looking for LongNAZARA is great opportunity for the buy side for longterm such a nice trade after forming reversal formation & has corrective phase for a movement to the upside. Expecting Target at 1700

NAZARA | Good for Long |NSE:NAZARA CMP: 685.85
Reason for Trade : WEEKLY BO
Entry : Cmp or near Support 930
Stop Loss: According to one's Risk Reward ratio
#Study, Learn & Earn.
If you love this post please like and comment your thoughts below. That will be a great motivation for me to post similar ideas ahead.
Disclaimer: All the information posting on this page are for the educational purpose only, we are not SEBI registered financial advisor. We wont recommend any BUY/SELL of stocks. Contact your financial advisor before taking any action

"NAZARA: Third Time's the Charm - Breaking Resistance for a PotIntroduction:
NAZARA has been an interesting play lately, attempting to break through resistance not once, but twice. After two unsuccessful attempts, there are strong indications that the stock is gearing up for a breakthrough on its third try. Additionally, the weekly timeframe is showing signs of an uptrend, adding to the bullish sentiment.
Key Points:
1. Previous Resistance Attempts:
- NAZARA has faced resistance on two occasions in recent times. The fact that the stock is persistently attempting to break through suggests a growing bullish sentiment.
2. Third Attempt at Resistance:
- The third attempt to break resistance is on the horizon, and it could be the charm. Keep a close eye on the stock as it makes this crucial move, as the third attempt often indicates increased determination to break through.
3. Uptrend on the Weekly Timeframe:
- On the weekly timeframe, NAZARA is showing signs of an uptrend. This adds a strong technical backdrop to the potential breakout, indicating a broader positive trend in the stock.
Note of Caution:
Before considering any trade based on this analysis, it's crucial to conduct your own research. Market conditions can change rapidly, and individual stocks are influenced by various factors. Ensure you understand the risks involved and use this information as a starting point for your due diligence.
Remember, no analysis can guarantee future performance, and it's always wise to have a well-thought-out trading or investment strategy.

NAZARA : Looking for long, Expecting to reach 1300NAZARA technologies is looking for a great buying opportunity for longterm and has the descending channel Lined up with the double bottom formation and has a potential movement to the upside.

Movement to the upside!Nazara what I can say? Haha a big movement of 100% rally to the upside for longterm

NAZARA - Symmetrical Continuation Triangle (Bullish) pattern Here's a breakdown of the key components and characteristics of the Symmetrical Continuation Triangle (Bullish) pattern :
Converging Trendlines: The pattern is formed by two converging trendlines, one drawn connecting the lower highs and the other connecting the higher lows. This creates a triangle-like shape on the price chart.
Price Consolidation: The pattern typically forms during a period of consolidation, where the price movement becomes range-bound. This consolidation phase signifies a temporary pause or uncertainty in the market after a prior uptrend.
Decreasing Volume: As the pattern develops, trading volume tends to decrease. This reduction in volume reflects the indecision and lack of strong conviction among traders regarding the future direction of the price.
Price Breakout: The key event in this pattern is the price breakout. Before the triangle pattern reaches its apex (the point where the trendlines converge), the price breaks out above the upper trendline. This breakout is characterized by a noticeable increase in trading volume, indicating a surge of buying interest.
Confirmation of Uptrend Continuation: The breakout above the upper trendline is seen as a signal that the prior uptrend is likely to continue. The increase in volume suggests that a significant number of traders are now confident in the upward direction of the price.
Overall, the Symmetrical Continuation Triangle (Bullish) is interpreted as a bullish continuation pattern. It suggests that after a period of consolidation and uncertainty, buyers have regained control, and the price is likely to resume its upward movement.
It's important to note that while chart patterns like this can provide insights into potential price movements, they are not foolproof predictions.
Traders often use these patterns in conjunction with other technical and fundamental analysis tools to make informed trading decisions.
PLEASE NOTE THAT:
This chart analysis is only for reference purpose.
This is not buying or selling recommendations.
I am not SEBI registered.
Please consult your financial advisor before taking any trade.

NAZARA TECH - 75% RETURNS!!!BUY - NAZARA TECHNOLOGIES LTD
CMP - Rs. 562
Target - 1: Rs. 630
Target - 2: Rs. 760
Target - 2: Rs. 980
.
.
Technicals - Stock is at support.
.
This is just a view by an expert analyst, please invest at your own risk.
.
Follow me for more!

Keep Nazara in radarNazara Technologies Ltd.
It appears that the price has completed a phase of "accumulation" at the bottom of a major downtrend, and the recent breakthrough of the resistance level suggests a potential reversal to a new uptrend.
To identify this pattern, traders often look for a Head and Shoulders Bottom formation, which involves three consecutive price declines following a significant downtrend. The lowest point, or the "head," is situated in the middle, flanked by two "shoulders" at around the same level but higher than the head.
As the price makes the first two declines, the trading volume is usually the highest and then decreases during the formation of the right shoulder. Finally, when the price surpasses the neckline, which is drawn between the two highs, the volume typically surges, confirming the reversal of the trend.
Note for everyone who came across this study:
This chart is only for educational purpose.
This is not buying or selling recommendations.
I am not SEBI registered.
Please consult your financial advisor before taking any trade.


NAZARA TECH - BO from BaseEntry: 730-740
Stop Loss: 695
Target: 920
Notes:
BO from base with good volumes
Retest with lower volumes
Most of the IT stocks breaking out from base

VCP breakout in NazaraChart -> Nazara Weekly
After having a huge uptrend, then a huge downtrend again stock is looking to start a reversal that is an uptrend.
A VCP breakout in Nazara with unusual volumes.
CMP: 735
Targets: 819, 994, 1121
SL: 627, weekly close
Disclaimer: This is for educational purposes only, not any recommendations to buy or sell. As I am not SEBI registered, please consult your financial advisor before taking any action.

Nazara looks good to accumulate and ride it.With IT index looking good, many IT stocks have started technical reversal. Nazara is ready to touch new highs again.

Possible trend breakout in Nazara? Stock is at Very Curial Level.
Keep an eye on this stock.
If price close above 730 and sustain in that range, then we can see a good bullish movement in the stock.
Reason is very simple, if price close above that range, then major resistance as well as supply zone will break. Which confirms buyer's control over the stock.
Wait for the breakout, then only enter stock with proper Risk- Reward.
Will Update once the breakout is confirmed.
This is just a view, not a recommendation to trade. Do your own analysis before taking any trade.
NSE:NAZARA

Nazara Tech retesting important rangeCHART -> Nazara Tech WEEKLY SETUP
As seen per chart, Nazara is currently trading at 1894to1994 range, which was previous resistance for the stock. After breaking out that resistance we had seen a more than 65% gains.
Now it has come to retest the range, will it be acting as it's support in the down move this time?
Disclaimer: This is for educational purpose only. This is not any recommendations. I am not SEBI registered. Please consult your financial advisor before taking any action.

Nazara Box breakout patternNazara Box breakout pattern formed and breakout happened at 2400 levels. Next levels to watch out are 2506,2624-2645, 2810-2825, 2900+


LONG ON NAZARA TECHNazar tech since its listing has been working in the range and finally, that range got broke and now it is retested! i.e. higher confirmation on the bullish momentum!
