NBCC - Weekly LONGNBCC on the weekly chart shows a clear improvement in trend after a long corrective phase. The stock has shifted into a bullish structure by forming higher lows and is now trading above its key moving averages, which have started to slope upward. This indicates that the broader trend has turned positive and buyers are gradually gaining control. The consolidation between the 110–120 zone worked as a strong base, and the recent move above this range confirms a trend continuation rather than a temporary bounce.
From a candlestick and price action perspective, the latest weekly candle is strong and bullish, closing near its high. This reflects solid buying interest and acceptance of higher prices. The absence of long upper wicks suggests that selling pressure is limited at current levels. The earlier resistance around 118–120 has now turned into an important support area, which strengthens the bullish setup and indicates a potential breakout followed by continuation.
Momentum also supports the positive view. The RSI is placed around the 60 zone, which reflects healthy bullish momentum without being overbought. Importantly, RSI is holding above the 50 level, showing that the stock remains in a bullish momentum regime. There is no visible negative divergence, which means momentum is moving in line with price and supports further upside potential.
From a trading perspective, a safer entry can be planned on a retest or sustained hold near the 118–120 support zone with bullish price confirmation, while aggressive traders may consider entries on a strong weekly close above 121–122. The stop loss should be placed below 114 on a weekly closing basis to protect against trend failure. On the upside, the first target lies near 130, followed by a higher target in the 137–140 zone, which aligns with previous supply areas. Overall, the structure favors swing and positional traders, with a buy-on-dips approach being more suitable than chasing the price.
Nbcclong

NBCC INDIADisclaimer : Trade at your own risk this is not buy - sell recommendation, I'm not sebi registered.
NBCC looks very bullish on daily, weekly and monthly charts keep on radar.
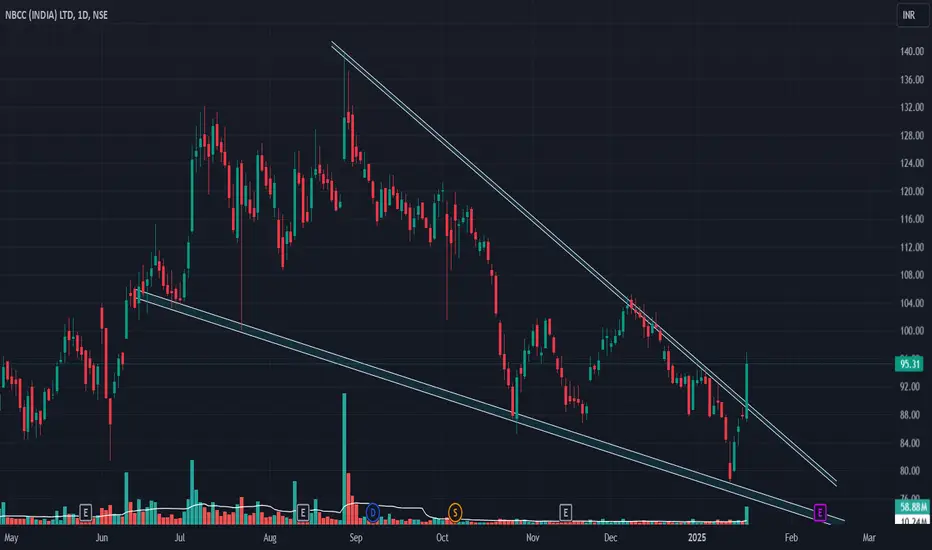
NBCC: Formed Symmetric Triangle PatternNBCC (INDIA) LTD has formed Symmetric Triangle Pattern and gave breakout already around 43-44 level.
#Current Price - 57-58
#Expected Target - 105
#Resistance Based Targets
- Target 1 - 68
- Target 2 - 79
- Target 3 - 105
#Support Based Targets (Can be used as Stoploss)
- Target 1 - 53.5
Pattern is forming on weekly chart.
Disclaimer:
This idea is only for education purpose, Please consult your financial advisor.
I am not SEBI registered.
Please give a Like if you like.

Long setup in NBCCA bullish flag & pole Chart Pattern Breakout on the Weekly Time frame of NSE:NBCC
Price Action supported by very good volume.
The stock is currently in uptrend making higher highs and higher lows.
One can add this stock into their stocks to buy list and initiate the long trade as per the levels mentioned on the chart
Stop loss will be on a Weekly closing basis.
Trend Analysis :- UP Trend
Chart Pattern :- Bullish flag & pole Chart Pattern
Technical Indicator :- Positive MACD Crossover
Disclaimer: This is for educational purpose only.

NBCC forming Cup and Handle on weekly chart 31/07/23.NBCC is forming a Cup and handle pattern on the weekly charts and has closed above both the moving average.
It has closed near the resistance zone and on the daily charts, has taken support form the 200 ema and closed above both the moving averages.
61.8% fibonacci levels also coincide with the resistance area and if the zone is cleared there are chances of stock giving 15-25% return in 3-4 months span.
Daily charts is showing some rejection from the resistance zone as there are couple of long wick rejection from the levels.
If stock starts trading above the resistance zone or 43.80 levels, bullish positions can be created in the stock option and stock can also be bought for short term to long term investors.
Entry levels :- Above 43.8
Target :- 49.5, 53.5
Stop loss :- 42.3
The stock is trading around good buying levels and can be purchased for long term view also.
Wait for the price action near the levels before entering the trade.

NBCC Chart Analysis !!📈 NBCC Ltd. 📉
My Findings :-
1. Breakout from a Resistance Zone With was Support As well in Nov, Dec and Jan.
2. Close Above March 2022 High.
Bias - Long
Target - 44, 47 and 53
SL - 36
RR- 1:2
All Important Supports and Resistances are drawn in chart. All levels are on closing basis.
Please have a look and revert back if you need some more study on it.
Disclaimer : Consult Your Financial Advisor Before Taking Any Decision On This Analysis.

nbcc breakout possiblityThere is a possibility of breakout in coming days.
W pattern formed.
This is educational purpose.

nbcc india ltdshare name : nbcc india ltd
call type : poistional
- share is forming a descending triangle
- a good consolidation can bee seen between 50
and 40
- 50.50 is acting as a good resistance, if 50.50 is
taken out we can see the targets of 60 and 69
- we can accumulate this share above 50.50
with sl of 46
thanks

nbcc longnbcc long NBCC (India) Ltd. engages in the real estate development, project management, and consultancy services. It operates through the following segments: Project Management Consultancy (PMC

REVERSAL TRADE NBCC✔#nbcc
cmp 48.7
expecting a good upmovement in the stock.
keep sl below 46
Why was it selected❓
🔹Company has reduced debt.
🔹Technically looks good.
🔹expecting reversal.
🔹dont know about funda.
👉Entry possible,but it’s not a buy recommendation.Study well🙏
ABOUT THE COMPANY🍂
NBCC (India) is a operates into three major segments namely Project Management Consultancy, Real Estate and Engineering Procurement & Construction.
Thank You.💚
Like🔹Comment🔹Support


NBCC SYM triangle BONSE:NBCC
can retest BO levels
add small now and add more near 52
SL 48
T 57, 60, 65
TF 20 days
