$NEAR Ready for a Massive Breakout: Next Stop $20+ Incoming CRYPTOCAP:NEAR Ready for a Massive Breakout: Next Stop $20+ Incoming
The chart structure looks absolutely explosive right now! $NEAR/USDT has bounced hard from the triangle support, confirming strength and signaling that a massive rally is brewing.
I’ve been accumulating heavy in the $2.50 - $1.90 zone, expecting a big breakout rally ahead!
Targets: $7.70 / $16.70 / $30 / $50
If CRYPTOCAP:NEAR can smash through the $5 resistance, get ready for a vertical flight toward $20+, with long-term eyes on $50
Why I’m ultra-bullish:
✅ Strong recovery from key support zone
✅ Bullish triangle breakout structure
✅ Volume uptick showing accumulation
✅ Momentum shifting rapidly toward bulls
Chart invalidation below $1.50, but above that, it’s looking unstoppable. NFA & DYOR
NEAR

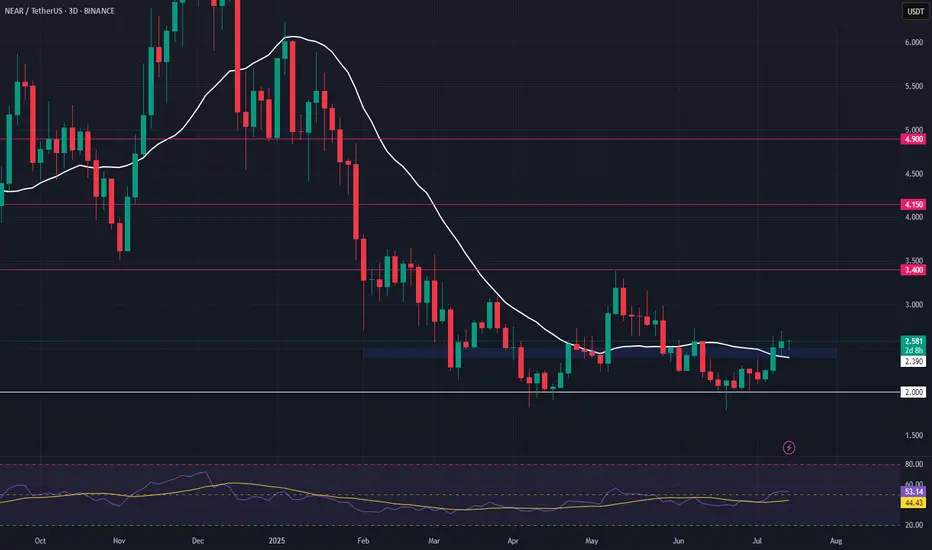
NEAR – High-Timeframe Double Bottom & Bullish DivergenceNEAR is showing strong signs of support, forming a high-timeframe double bottom with bullish divergence after a clean sweep of the $1.80 level. Price has now reclaimed the 20-day SMA, adding confidence to the setup.
📌 Trade Setup:
• Entry Zone: $2.40 – $2.50
• Take Profit Targets:
o 🥇 $3.40
o 🥈 $4.15
o 🥉 $4.90
• Stop Loss: Daily close below $2.00
If $NEAR hits $50, will you regret not buying at $2?🚨 NEAR/USDT Weekly Chart Update 🚨
NEAR has bounced from a strong weekly support level inside a multi-year triangle. This bounce looks powerful and could be the start of a major move.
🔹 Current Price: $2.51
🔹 Entry Zone: $2.00–$2.50
🔻 Invalidation Level: Below $1.80 (if price drops here, the setup fails)
This bounce could lead to a big rally in the coming months.
🟢 Target Levels:
$3.30
$7.77 – Mid-term resistance
$16.72 – Bullish target
$30 to $50 – Long-term upside if momentum builds
That’s up to 2000% potential upside from current levels.
Pullbacks between $2.50–$2 can offer another good entry.
Key Point: This bounce from support looks like the early stage of a larger uptrend. It's a good time to position slowly and carefully — but always manage your risk.
What’s your view on NEAR’s bounce?
Note: NFA & DYOR

Big Triangle Forming on $NEAR — Massive Breakout Ahead!Big Triangle Forming on CBOE:NEAR — Massive Breakout Ahead!
CBOE:NEAR is showing strong bullish structure on the HTF – it's forming a large symmetrical triangle pattern, which often signals an explosive breakout move.
Technical Analysis Overview:
▶️ Best Accumulation Zone: $2.90 – $2.10
▶️ Targets: $5 / $10 / $20 / $30 / $50
▶️ Invalidation Below: $1.80
Once we break out of this triangle, the upside move could be massive.
Why I’m Bullish on NEAR:
✅ AI + Blockchain = Future – NEAR is already delivering real AI tools & apps
✅ User & Dev Growth – Ecosystem expanding fast
✅ Modular Infrastructure – Becoming the base layer for multichain apps like Celestia
✅ FastAuth + BOS – Easy Web2-like onboarding + AI-native UX
✅ Backed by Big Players – a16z, Circle, Tiger Global all invested
In the last cycle, CBOE:NEAR did 38x with just hype.
This cycle? It has the tech, adoption, and perfect timing.
Don’t sleep on $NEAR. It’s not hype — it’s building the future.
Note: NFA & DYOR

Is NEARUSDT Setting Up for a Breakout? Key Levels to Watch Now!Yello, Paradisers! 🚨 Are we about to witness a major bullish move on NEARUSDT? The falling wedge pattern that has formed is signaling a potential breakout, but there are key signs to watch out for before making any moves.
💎If NEARUSDT approaches the support zone and shows bullish signs, followed by a breakout from the falling wedge, the chances of an upward surge become much stronger. Confirmation will be crucial—look for signs like:
💎Change of Character (CHoCH) towards a bullish market structure
💎Bullish candlestick patterns, such as the Morning Star or Bullish Engulfing, to further stack the odds in our favor
💎But, let’s keep our feet on the ground. If the price falls and closes a candle below the support zone, it invalidates the bullish setup, and we'll need to reassess our strategy.
🎖At MyCryptoParadise, we always wait for the highest probability trading opportunities. Patience, discipline, and strategic planning are key to making it in this game long-term. Play it smart, Paradisers! Keep an eye on the charts, and don’t jump the gun.
MyCryptoParadise
iFeel the success🌴

NEAR BEARISH IDEANEAR has given confirmation of downtrend, the next target could be 5.20, followed by even lower of that. So keep an eye on these mentioned levels for potential support and further price action.

NEAR/USDT: Bullish Shark Pattern Signals a Potential 60% Upside#NEAR/USDT has formed a bullish shark pattern & the RSI (Relative Strength Index) is currently in the oversold area, suggesting that for a rebound.
Currently, NEAR is standing at a bullish support trend line, which further reinforces the potential for an upward move. Given these strong technical signals to deliver a 60% profit.

$NEAR Ready for a Potential $49 Target According to Elliott WaveAMEX:NEAR Ready for a Potential $49 Target According to Elliott Wave Analysis
- Potential Entry Zone: $6.5 - $7
- Bullish Long-Term Outlook
- Dip = Prime Accumulation Opportunity for Huge Profits
#Crypto #NEAR #TechnicalAnalysis #ElliottWave #CryptoTrading #Altcoins

NEAR: Bullish Momentum Building with Inverse H & S🚀💎 Paradisers, #NEAR has formed an inverse head and shoulders pattern, enhancing the probability of a bullish move.
💎 Price action has shown a Change of Character (CHoCH) and a Break of Structure (BOS) in lower timeframes. You can observe that #NEARUSDT has also bounced from the Fair Value Gap (FVG) zone, and currently, the price has shown an FVG, so we can expect a bounce from these levels. Be cautious here; there is also a bullish Order Block (OB) and a supportive trendline aiding the bulls, so considering stop losses here would be logical.
💎 For confirmation of the inverse head and shoulders, we need a breakout and a candle closing above the resistance zone.
💎 However, if the price shows a fall or panic selling and breaks down below the bullish OB and supportive trendline, it will invalidate the bullish signs. In that case, it would be better to wait for more favorable price action to develop.

$NEAR Bull Flag Breakout Alert ( 120% Potential from here )AMEX:NEAR Bull Flag Breakout Alert
#NEAR has shattered its major bull flag resistance at $7.38, signaling a powerful bullish trend. If we hold above the crucial green zone, expect a surge to $15 ( that's 120% from Current Level )
Entry: $7.40-$6.40
Target: $15
Stop Loss: $6 (Close below daily)
Keep your eyes on the red trend line for strong support. Stay bullish above this level.
#NEARProtocol

📚Learn More💰Earn More - Inverse Head and Shoulders in NEARUSD📚 LEARN MORE
💰 EARN MORE
Inverse Head and Shoulders Definition:
A head and shoulders pattern is also a trend reversal formation.
It is formed by a Valley (left shoulder), followed by a Lower Valley (head), and then another Higher Valley (right shoulder).
A “Neckline” is drawn by connecting the highest points of the two Peaks. Neckline resistance does not need to be strictly horizontal.
This illustrates that the downward trend is coming to an end.
When a Head and Shoulders formation is seen in a downtrend, it signifies a major reversal.
The pattern is confirmed once the price breaches the neckline resistance.
In this example, we can easily see the head and shoulders pattern.
How to Trade the Head and Shoulders Pattern:
ENTRY :
we put an entry order above the neckline.
TARGET :
We can also calculate a target by measuring the lowest point of the head to the neckline.
This distance is approximately how far the price will move after it breaks the neckline.
❤️ If you find this helpful and want more FREE forecasts in TradingView
. . . . . Please show your support back,
. . . . . . . . Hit the 👍 LIKE button,
. . . . . . . . . . Drop some feedback below in the comment!
❤️ Your Support is very much 🙏 appreciated!❤️
💎 Want us to help you become a better Forex trader?
Now, It's your turn!
Be sure to leave a comment let us know how you see this opportunity and forecast.
Trade well, ❤️
ForecastCity English Support Team ❤️

Near Usdt weekly price prediction Current FIB 0.38
Bearish movement I am expecting it to go to 0.23 fib first and then bounce from there and move to 0.5 fib
Low volume no chances of the high pump will be a complete range bound shit
My monthly price prediction - is 4.5 $

near price prediction for Septemberday frame - 1D
support 3 $ - 3.5$ range
local resistance - 4.2-4.656 $
Other resistance - 5$ and final big one 6$
Btc price of 20k$ near is still strong so a rise in BTC will push near up for sure
The Merge is another bullish thing that will try to pump the market. My thoughts are the market will approach to 23k $ again during the merge ie 17 Sep and than will sell the news will happen and it will fall. As a result, the near monthly price can shoot upto 5.8 $ in September and fell back to low as 3$. So my price prediction for the month end will be in bw of these two and that will be 4.978$.
My monthly price prediction will be 4.978 $

Near price analysis for septemberHello! hope you all are doing fine. I have tried to do a short analysis and a small price prediction for the september month. So, history says september is a bearish month and following the history and the current fuds in the market Even i would say the same. Soo i have made to 2 scenarios one is bearish and the other is extreme bearish. Ofcourse, both of them are sad and depression, but they also become a good buying opportunity for us as a investors.
One of it is around 3 and the other one is around 2, The second option is a more safer and a stronger option as it is the point of start of the previous bull run. Soo thats it for now ofc you can refer my chart it has a more detailed analysis.
And my prediction for end of the month is around 3.4$

💡Don't miss the great buy opportunity in NEARUSD @NEARProtocolTrading suggestion:
". There is a possibility of temporary retracement to the suggested support line (4.749).
. if so, traders can set orders based on Price Action and expect to reach short-term targets."
Technical analysis:
. NEARUSD is in an uptrend, and the continuation of the uptrend is expected.
. The price is above the 21-Day WEMA, which acts as a dynamic support.
. The RSI is at 72.
Take Profits:
TP1= @ 5.198
TP2= @ 5.631
TP3= @ 6.497
TP4= @ 7.628
TP5= @ 8.877
SL= Break below S2
❤️ If you find this helpful and want more FREE forecasts in TradingView
. . . . . Please show your support back,
. . . . . . . . Hit the 👍 LIKE button,
. . . . . . . . . . Drop some feedback below in the comment!
❤️ Your support is very much 🙏 appreciated!❤️
💎 Want us to help you become a better Forex / Crypto trader?
Now, It's your turn!
Be sure to leave a comment; let us know how you see this opportunity and forecast.
Trade well, ❤️
ForecastCity English Support Team ❤️

NEAR PRICE PREDICTIONWe all are still in the bear market no volume in market, no big relief relies in $BTC, BTC still trying to break 24k $ clean.
Small 10% pump and days of the red market.
And thus I think BTC will approach to 13k $ in august and near 3$ and low
Hence my price prediction for $NEAR is 3.09 $ august end price

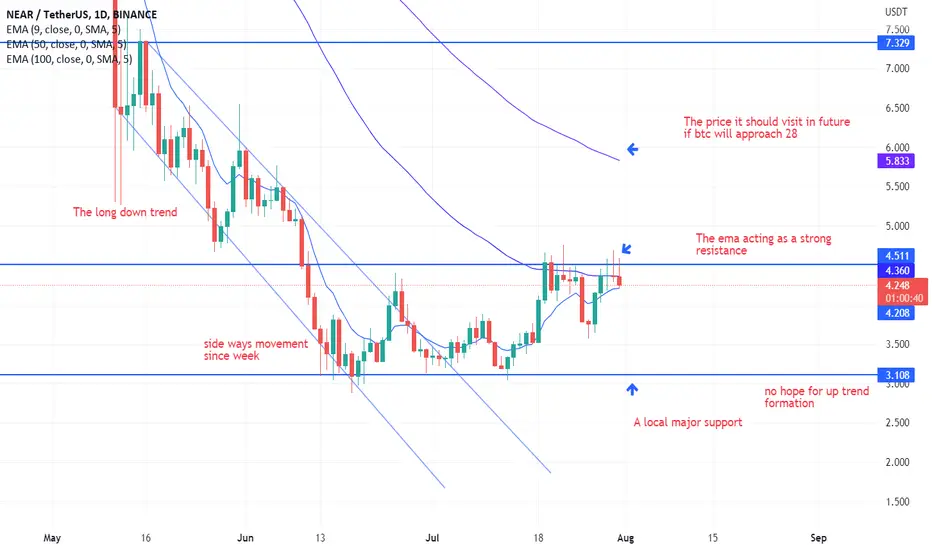
NEAR PRICE PREDICTIONHello everyone welcome to another analysis of mine look at the chart carefully
1st we were in downtrend from almost ath and it continued till we reached low of 2.6 $ since than we are moving sideways , there are small up trends forming in the way but they are unable to continue for a long time and as a result we are dancing bw 3 to 4.5 again and again
So now if we see the condition EMA 50 is acting as a good resistance and if we have to go to say 10 $ we need to make that resistance support . The 4.3 - 4.7 $ region is continuously pushing us backwards .
If we look at EMA 100 which is at 5.83 $ that will be the max price in upcoming weeks or a month ( august month ) since btc is looking strong from past days and is in mood to approach 28k $ mark .
Thus taking everything in mind my month price prediction for august will be a soldi 5$ .
NEAR AUGUST PREDICTIONFrame - 4h
will be trying to predict the price for Aug 31
So we have A major local resistance at 4.6 $ only if we will be able to flip it and be above it for continuously days than only we can go to 5 , 6 or 10 but there is a lot of fear in the market and very low volume and thus people keeps on selling whenever it reaches that price marks and its the same story again and agian.
Now if you will look at the trend lines I had drawn you will find that each time it gets a pump from the support of 3.6 $ goes to 4.6 and same story
And thus
My price prediction for the august end is 3.586 $

NEAR PRICE PREDICTION Taking the daily frame you will notice a support zone at the 2.6 - 3 $ region, now
since when we have fall down from 5$ we never reached close to it
we go to 4.7 or 4.8 and fall back to the support zone of 3 - 3.6 $
And i personally think the same will happen in august as it is happening in a bear market for long
we will be revolving bw 3 to 5 $ and we will end the month close to 4$
And thus my price prediction for the end of august is 4$ .

near price prediction for august day frame - 1D
support 3 $
local resistance - 5 $
$Near rose from FIB 0 local support 3 and broke fib 0.5 and is stable above it, since $BTC is bullish i think we will see 5$ + price in the first or second week of august and then selling pressure will increase as usual and we will start dropping down .
As per me MAX PRICE We will reach in august will be 5.38$ and min will be 4$. and we will end the month in bw these prices and hence
My price prediction for the end of august is 4.485$

Near Usdt price prediction As we all know that NEAR is a layer 1 coin whose demand is always high and it is a loving token by the community.
Currently near saw great support at $3.6 and is being bullish since than ,
i personally think near will be bullish and reach those targets we had seen in May ( 5 range )
The FIB and other things are showing that.
Hence my price prediction for near for august month will be 5.50 $ .
Hoping so that BTC will behave bullish and that so near ........

NEAR MONTHLY PRICE PREDICTION FOR THE MONTH OF AUGUSTWe are in bear market , everything is down a lot from its previous all time hope .
Many are saying we will go to 13k and many are wishing full a bull run to make more money .
So , near have shown a good support in this bear market as we all know it is giving 17% + pumps in a single day
Currently everything is getting a lil bullish and I think so near will approach the FIB 0.23 in my chart and the price will hit 6$ + till end of august .
Also ema 50 is acting as a support and hopes are high .
So my monthly price prediction for $near in the month of august will be 6.0000 $ .

Near Monthly Chart AnalysisOn Monthly timeframe of near ,we can see it has retraced all the way to last year June July levels ..if previous year pattern has to be followed near should bounce off from here to tp atleast 7-7.5$ by the end of next month..as for btc monthly closing above 22.8k would be bullish for it and further rally for 28-30k area would be expected in August month..and there is no interest hike in August month we might see some relief pumps in alts and btc ..My target for August 31 midnight is 6.75$
