Major Crash Ahead?The Diametric Pattern completed.
2-stage confirmation achieved.
The Major impulsive downtrend has begun - Unless there is a sharp reversal upside by next week.
Neo Wave

Corrective RiseCoal India seems to have completed Wave D of a triangle/diametric and now entering Wave E
The minimum target is around 450-455 on a daily level.
Profit booking could be done on other mentioned intermediate levels according to your trading style

Buy on DipsBajaj-Auto seems to have entered Wave 3.
Buying opportunities could be looked out for on dips
Currently it has reached at an important resistance of around 9100, so a pullback is expected

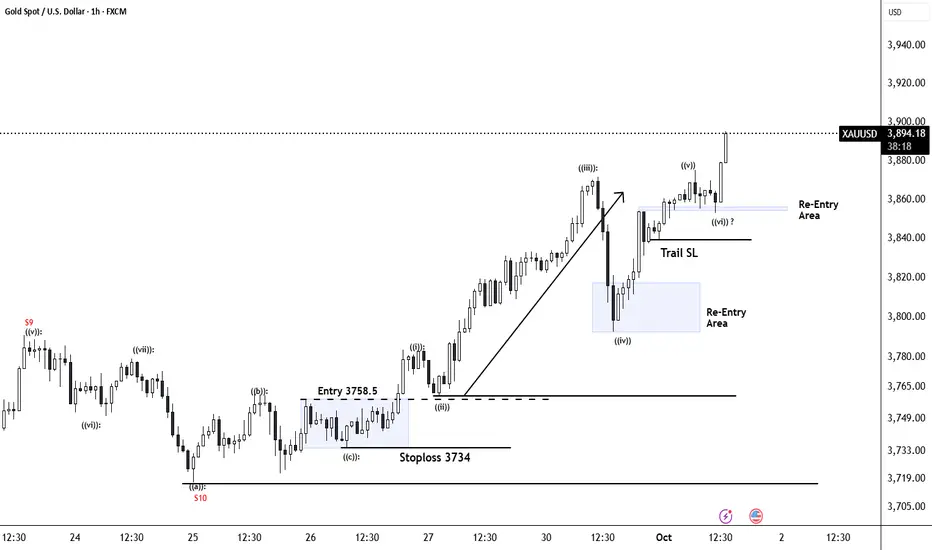
XAUUSD – 15M | SMC-Based Trade PlanGold is currently in a corrective phase after a strong impulsive move to the upside. Price has delivered a clear displacement, followed by a pullback into a refined demand zone, highlighted on the chart. This area aligns with prior bullish order flow and acts as a discount zone within the higher-timeframe range.
The current sell-off appears corrective, not impulsive. Expectation is for price to mitigate demand, sweep weak lows if needed, and then resume the primary bullish structure.
Execution Plan (Important):
➡ No blind entries.
➡ Entry will be taken only if LTF confirms bullish intent (CHoCH, BOS, displacement from demand).

XAUUSD – Clean Rejection from LTF Demand With Potential Upside EGold tapped into a refined LTF demand pocket and instantly showed rejection, indicating buyers are stepping in exactly where they should. This aligns well with the ongoing HTF bullish bias and maintains the broader structure intact.
The strong wick + immediate reclaim of the micro-range suggests absorption and willingness to push higher if structure follows through.
Bullish Path:
• Tap into LTF demand
• Rejection + recovery inside the zone
• Micro structure shift
• Expansion toward the next HTF imbalance

SBFC Finance (Requested View)Namaskaram
One friend asked of me my view on SBFC, Here It is.
Just leave a comment if you have query related to your stock
Thank You

Gold (Neowave Trading Idea)Hello everyone
# Gold is started walking again in daily charts and its going or atleast try for the time being to break its all time again.
## Stoploss will be 3964 if breaks dont sell just exit.
Thanks

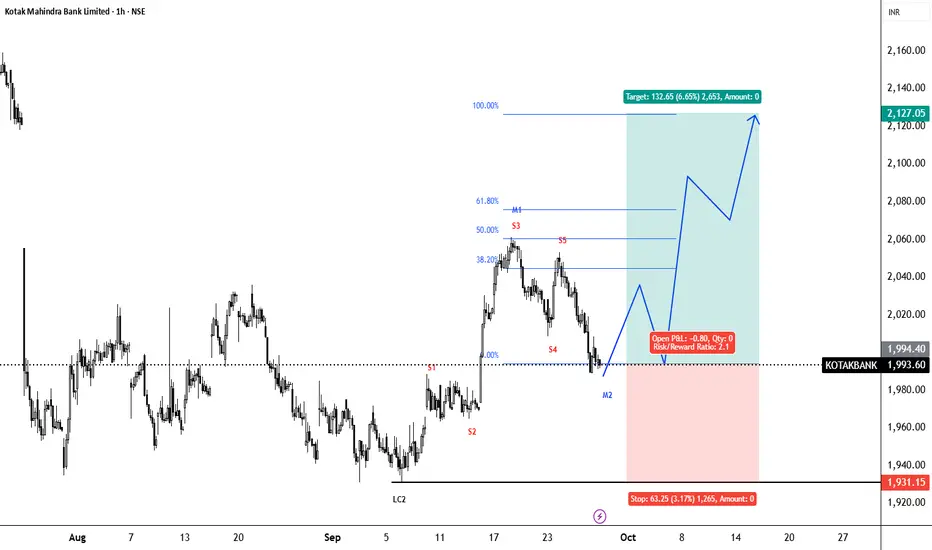
Kotak Mahindra Bank (Neowave Trading Idea)Namaskaram
Cycle - consolidated 5th up swing on Long Term Chart (Black Labelling).
Medium Cycle (Blue Labelling) giving an correction, which most likely completed.
Currently retraced 61 percent.
LTP = 2079.7
stoploss = 1,986
About Target- Well target should be above 2302.
But this price should reach before January. So if you see price is rising but not giving enough speed than exit where you get a good price.
I will also make a video on this one today and upload it here.
Thank You.

Kotak Mahindra Bank (Neowave Forecast)NSE:KOTAKBANK
Namaskaram
Cycle - consolidated 5th up swing on Long Term Chart (Black Labelling).
Medium Cycle (Blue Labelling) giving an correction, which most likely completed.
Currently retraced 61 percent.
LTP = 2079.7
stoploss = 1,986
About Target- Well target should be above 2302.
But this price should reach before January. So if you see price is rising but not giving enough speed than exit where you get a good price.
Thank You.

Gold Neowave Forecast (10-11-2025)Hello everyone
Sorry for absence as I go in research mode with Neowave and found something interestin, anyway lets talk about gold.
# Gold is started walking again in daily charts and its going or atleast try for the time being to break its all time again.
# I also added a blue box on the chart which is an time box, mean price must cross high within this time limits.
## Stoploss will be 3964 if breaks dont sell just exit.
Rest we will talk in the video along with BTC and Tesla.
Thank You.

SIMPLE STUDY | Brutal Moves | A Rough Path Aheadwe can clearly see that 3 wave impulse have been completed in form of ABC, in todays world nifty is atleast trading in ABC pattern whereas corrections are seen as wxy or wxyxz patterns..
so concluding the multi year bull run we can see short time say 2.5 years of corrections in form of wxyxz from sept 2024 to 2027 march end..
well weekly charts is clearly marked how and by when we can achieve what levels,
coming to internal wave counts we took time frame of 125 mins which clearly says the internal formations of very complex X wave completion or a last leg of completion till 25800-900 by gap up,
But since there is a big Astro change happening on 18 October of jupiter after 12 years which may reverse the things so a big gap down opening of Wave C can be predicted and it will be a confirmation of the wave C also..
the best indicator RSI if well accepted on indexes is also showing divergences internally on hourly charts, we can see a gap down opening on Monday confirming the wave C startup..
we can also see ABCDEFG "Bow Tie" Diametric pattern of NEO wave also formed whose last G also formed in diagonal of ABCDE...
so coming 2.25 months will be brutal rallies as marked in Red color in the charts predictions on right side ...
we must see 18800 levels very soon early next year around jan 15th 2026... this year we must see any levels starting with 20,000..
we must keep Money to invest or can look for SIP then..
* this is my sole Analysis and purely for education purpose, there is no recommendation for anyone in this universe to trade on it..

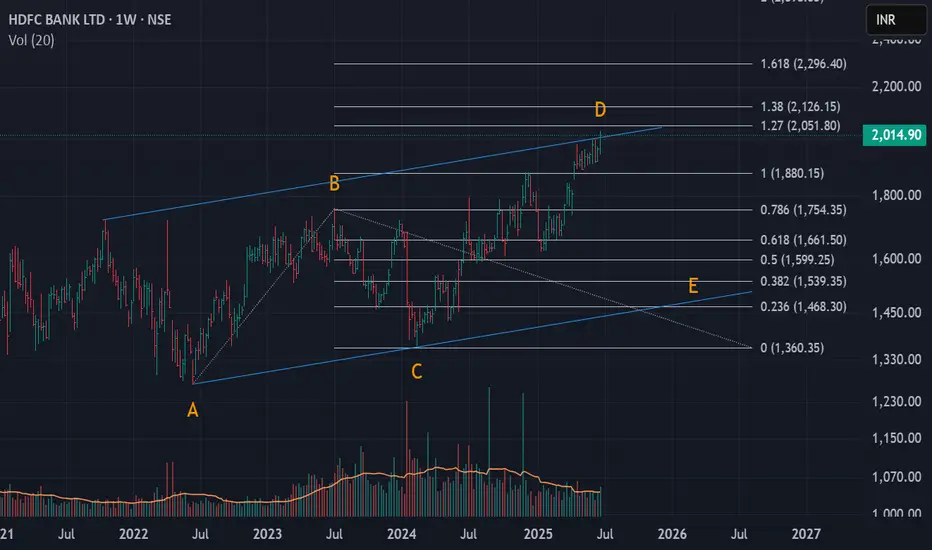
HDFCBANK | Entering Downwards correctionHDFCBANK seems to be completing wave D.
After that wave E will follow on the downside.
Will keep you guys posted once we have entered Wave E
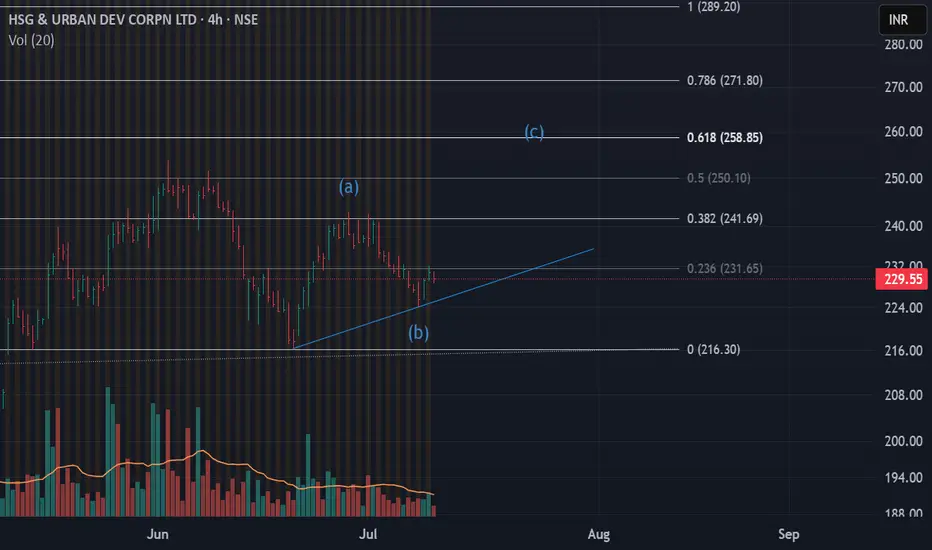
Up Move on 4Hr timeframeHudco seems to have completed or near completion of Wave B and entering into Wave C to the upside.
A break below the current 0-B trendline is a first warning sign that Wave B is still in progress
T1 -> 240
T2 -> 255
SL1 -> 220
SL2 -> 215
Gold Neowave Bulletin| 10/10/2025
Namaskaram Everyone
Welcome to intelligent investor, we provide market insights by synchronising and combining all the price action waves from different time frames and gives you single trend.
Here are all our previous gold analysis, with this you will understand how with Neowave Theory you will have an edge in the market.
Previous Neowave Bulletin
09/12/2025
07/10/2025
01/10/2025
30/09/2025
29/09/2025
OANDA:XAUUSD FOREXCOM:XAUUSD FX:XAUUSD VANTAGE:XAUUSD MCX:GOLD1!

Gold Neowave UpdateNamaskaram Everyone
Welcome to intelligent investor, we provide market insights by synchronising and combining all the price action waves from different time frames and gives you single trend.
Degree Information
FX:XAUUSD OANDA:XAUUSD FOREXCOM:XAUUSD

Gold |Power of Neowave AnalysisIf you have any doubts related to your stocks and portfolio, ask in the comments we will provide you Neowave Chart for that.
To understand my view Kindly watch the videos-
Video Analysis 01/10/2025
Video Analysis 30/09/2025
Video Analysis 29/09/2025
Neowave Forecast| Gold|Bitcoin|Nifty|Bank Nifty|30/09/2025If you have any doubts related to your stocks and portfolio, ask in the comments we will provide you Neowave Chart for that.
Discussed Instruments
#Gold
#Bitcoin
#Nifty
#Bank Nifty
Yesterday Video-

Kotak Mahindra Bank Neowave Trading IdeaNamaskaram Everyone
I trade using Neowave and on that I have created an trading setup, which is kind of automatic entry and exit with Neowave.
Neowave is kind of a method in which you synchronize all the price action across all the time frames. It hides all the noise and tells you market is bullish or bearish.
About Stock Structure
Entry Type- Medium Term Forecast mean Entry will take 4 to 8 weeks and some times more.
Wave Structure- We are at starting point of wave, which kind of gives you an edge in riding the wave when you above your buying level
60 percent Retracement- Mean you will have easily 1:2 or 3 easy risk reward.
Doubts-If you are fearing in taking trades that mean you are taking stop loss amount more than you & your capital can handle.
Follow 1 percent rule and trail, that's it. Don't complicate life and trading.
Simply live and die. HaHA
Like and share is appreciated.
Thank You
To understand how our coding works read the below post-
NSE:KOTAKBANK NSE:KOTAKBANK1!
Gold Neowave Stuctural UpdateNamaskaram Everyone
Welcome to intelligent investor, we provide market insights by synchronising and combining all the price action waves from different time frames and gives you single trend.
How To Read My Charts...Click Below
FX:XAUUSD FX:XAUUSD OANDA:XAUUSD MCX:GOLD1!

Bank Nifty Neowave UpdateNamaskaram Everyone
Welcome to intelligent investor, we provide market insights by synchronising and combining all the price action waves from different time frames and gives you single trend.

USDJPY (Neowave Trading Idea)FX:USDJPY Namaskaram Everyone
Welcome to intelligent investor, we provide market insights by synchronising and combining all the price action waves from different time frames and gives you single trend.
Now Risk Reward is highly favourable
Trading with risk management, that is 1 percent rule with my charts.
How to Read My Charts-

Gold Neowave UpdateFX:XAUUSD Namaskaram Everyone
Welcome to intelligent investor, we provide market insights by synchronising and combining all the price action waves from different time frames and gives you single trend.
GOLD & BTCUSD Video Analysis
How To Read My Charts...Click Below

Gold & BitCoin (Neowave Forecast)Namaskaram Everyone
Welcome to intelligent investor, we provide market insights by synchronising and combining all the price action waves from different time frames and gives you single trend.
How To Read My Charts...Click Below
