BTC/USD (Short Cycles)Namaskaram Everyone
BTC is in uptrend but going down in Medium cycle.
currently risk reward is not much favourable, for that you need to wait for short term cycle retracement.
If you need shorter degree chart i will update it, reply in comments.
Intraday Gear 3
Intraday Gear 2
Learn More about trend here
Neo Wave

Invest With My NeoWave ChartsNamaskaram Everyone
This is an educational post in which i will describe how to read and trade with my wave Charts.
So first lets start by seeing a wave Chart.
First you will be seeing a S1 series called Short Term Trend.
Than a group of S1 is denoted by M1 series called Medium Term Trend.
Than a group of M series is marked by L series called Long term trend.
All this means is that smaller trend makes a bigger trend and than more bigger trend and than more.
This is how a wave structure become.
All these Short, medium and long term trend are called Degree.
You can think of them as a car gear like bigger the gear greater the speed of price and consolidation.
In my charts i used total 10 gears but i am showing you 9 degree.
See the below 3 images.
Degree List 1
Degree List 2
Degree List 3
Now there are few more things left-
Like you will be seeing some coding with C keyword like MC1,LC1, and a,AA,BB.
These are consolidation or correction counting.
Mean after a rally market rest or consolidate before resume another rally. We represent these consolidation period with LC1,AA,BB Like this.
Now see some examples by which you can judge how much time and price a particular degree or gear can consume-
Multiyear Trend
This is an Bank Nifty chart, if you see that multiyear cycle is running for past 25 years.
Each leg cover around 10 years.
Super Trend
Complete Cycle take 8 year, from 2012 to 2020
just imagine if you can think of an possibility in advance that next 8 years are going to bullish or bearish.
Namaskaram
VodafoneIDEA (Opportunity during consolidation)Hi everyone
Welcome to intelligent investor, we provide market insights by synchronising and combining all the price action waves from different time frames and gives you single trend.
Degree Information

Nifty Neowave Counts updateHello Everyone
Welcome to intelligent investor, we provide market insights by synchronising and combining all the price action waves from different time frames and gives you single trend.
If you see different keyword in charts, here is the meaning and an explaining video will be made in some time how to read and trade with these waves charts.
Still if you have any query , you can leave a comment.
Keyword Mean-
S- Short Term Trend
M- Medium Term Trend
L- Long Term Trend
1,2,3,4,5 are wave bullish or bearish wave count
C- mean consolidation or correction
X- Like a joint in a trend or consolidation.

BANKNIFTY at a major resistanceAlthough, Banknifty is still in an uptrend on weekly chart but it has reached a major resistance level.
In which, Wave C has achieved 61.8% of Wave A.
It'd be good to avoid taking long positions for now and book atleast partial profits.
Price breaking below 53,500 and stabilizing there, could call for shorting opportunities.
Price moving up 57,800 will point towards continuation of Wave C
Will keep you guys posted

Bank Nifty ( Neowave Update)Namaskaram Everyone
we have came back with more powerfull and steady way of analysing the market. Starting our comeback with bank nifty.
## Everything is bullish except for weekly cycles.
## market will resume its trend once its go above resistance level.
Have Fun.

BTC entering Wave DBitcoin has likely ended Wave C in a diametric formation.
It could now entered Wave D, which itself would be a corrective rise.

EDUCATIONAL | Wave C in progressBitcoin completed Waves A and B
Wave A formed a Triangle while Wave B was a Diametric
Wave B formed in less time than Wave A, which is not possible in Flats
And Wave A was a triangle which is possible in a Diametric/Symmetrical
So, Wave C which is currently in progress could itself be a corrective fall and part of a larger Diametric formation on a daily timeframe
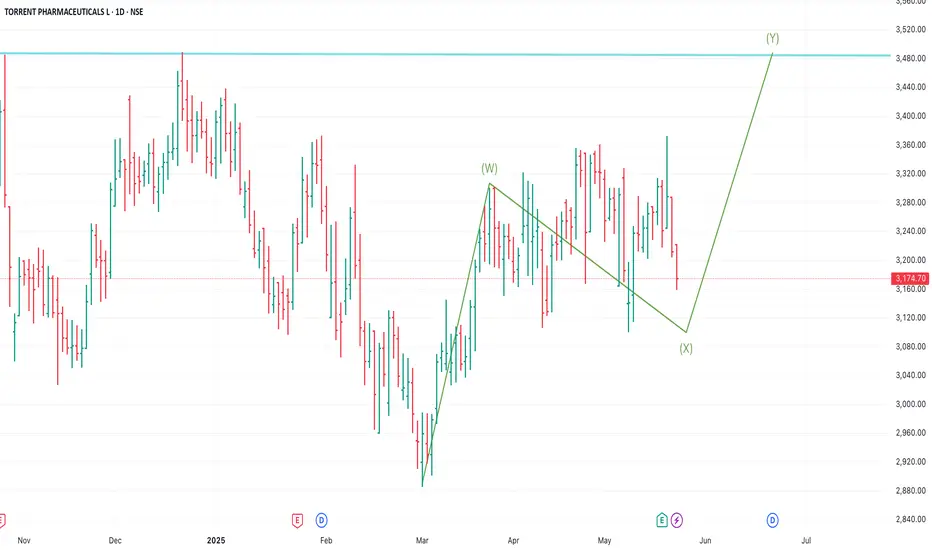
Torrent Pharma to touch 3100 again ?Torrent Pharma is in corrective phase for a while. This correction is not going to end anytime soon, however we still have opportunity to make some money here.
Currently on the Daily chart its in complex correction in which we have already completed Wave W, what's left is Wave X and Wave Y. Once we are good with the completion of wave X then expect it to unfold in a-b-c which will be part of wave Y.
Disclaimer: I am not SEBI registered member, this is only for educational purpose only.
Corrective Rise UpNifty seems to completed the formation of the corrective down pattern which was a Diametric formation.
From here we could expect an up move to take place, which will most likely be a corrective rise too.
The first warning that the downside it still in progress will be price entering the range of around 24290 and a break below the level of 23900 will confirm that this wave was just the starting of a larger correction
Happy Trading!!
Buy on Dips | 4H timeframeBitcoin seems to have completed the formation of triangle and entered into an upward move.
The SL for this study would be price entering the price range of 111,700.
Profit could be booked on the marked Fibonacci levels (darker the color, more important the resistance level)

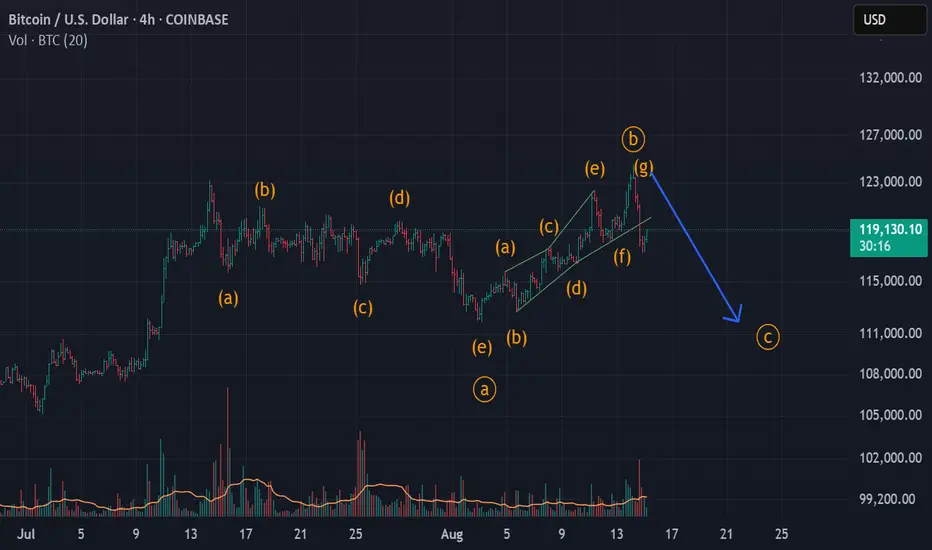
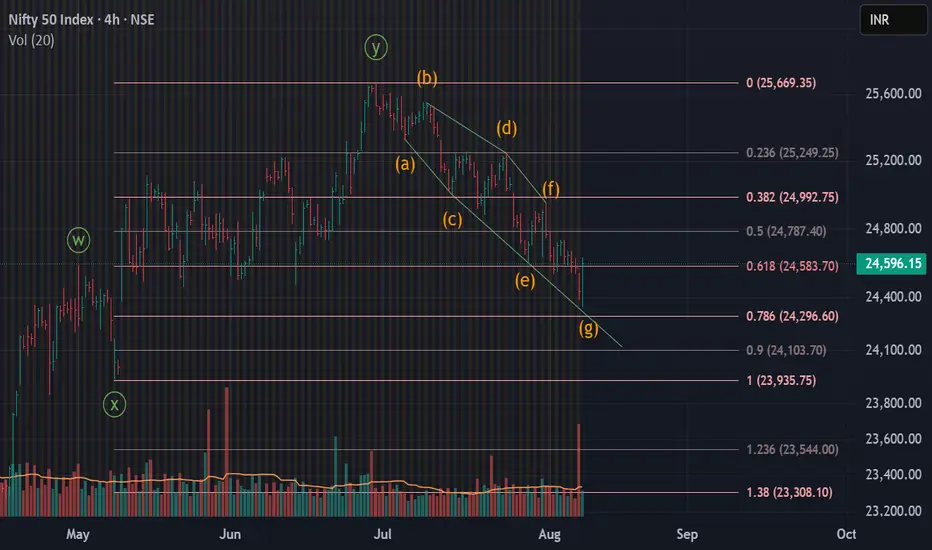
Corrective DownBitcoin seems to be completing Wave F of a diametric formation.
Generally, Wave B and Wave F are related to each other and till now, Wave F is almost equal to Wave B, so a potential area of resistance
After this a corrective downside in form of Wave G could start.

Sell on riseBtc seems to have entered wave C.
Currently at a good support level.
But could be sold on rises.
Till 119,775 is a good level to take a short position

EDUCATIONAL | NIFTY FUTURE POSSIBILITIESNifty has formed a double correction with second part being a Diametric formation
Possibility 1: The current fall which started around 30th June could be another Wave X and we will then continue to move up in a corrective rise.
This Wave X would be confirmed if Nifty doesn't break the level of 25,000 and confirm the upward bias from here, which is more likely
Possibility 2: The next possibility is that Nifty has completed a double correction and we'll continue the downward journey from here which will be more likely if Nifty break 25,000.
Will keep you guys updated as the wave progresses.
Happy Trading!!

Down moveEth seems to have completed or near completion of Wave B
Ready to enter wave C to the downside
Will keep you updated as the move progresses

Corrective Rise UpNifty seems to be in last leg (Wave G) of a diametric formation.
Could lead upto 25,700.
25,580 a good resistance level.

Best Possible Elliott Wave Counts: ETHUSDHello friends,
Welcome RK_Chaarts.
Today we're attempting to analyze Ethereum's chart from an Elliott Wave perspective. Looking at the monthly timeframe chart, we can see that from the beginning, around 2015-2016, when data is available, to the top in 2021 we have a Super Cycle degree Wave (I) marked in blue, which has completed.
Next, June 2022 we have a bottom around $874, marking the end of Super Cycle Wave (II) in blue.
We are now unfolding Wave (III), which should have five sub-divisions. Within this, the red Cycle degree Wave I and Wave II have completed, and we have possibly started the third of third wave.
Monthly:
Moving to a lower timeframe (Weekly) where we observed the completion of blue Wave (II) and the start of Wave (III), we notice that within this, the red Cycle degree Wave I and Wave II have completed, and we've possibly started Wave III of cycle degree marked in Red.
Furthermore, friends, within this third wave, we've marked the black Primary degree Waves ((1)) and ((2)), which we've labeled as Rounded ((1)) and Rounded ((2)). We're assuming these are complete, and Wave ((3)) has started, which is our current working hypothesis.
Weekly:
Now, if we move to a lower timeframe, such as the daily chart, we can see that the Cycle degree Wave II, which ended at 1385.70, has been followed by a Primary degree black Wave ((1)) in Black & Wave ((2)) has pulled back, completing Waves ((1)) and ((2)), and now Primary degree Wave ((3)) has started.
Possible wave counts on Daily
Within Wave ((3)), we expect five Intermediate degree waves. We've marked the first Intermediate degree Wave (1) in blue, which is currently unfolding. If we move to an even lower timeframe, such as the 4-hour chart, we can see that within the Intermediate degree blue Wave (1), there are five Minor degree sub-divisions marked in red. Waves 1 and 2 are complete, and Wave 3 is nearing completion.
Possible wave counts on 4 Hours:
Once Wave 3 is complete, we expect Waves 4 and 5 to follow, completing the Intermediate degree blue Wave (1). After that, we may see a dip in the form of Wave (2), followed by a continuation of the bullish trend as blue Wave (3).
Possible wave counts on 60 Min:
Friends, based on our multi-timeframe analysis, the overall wave structure appears bullish. We've provided snapshots of each timeframe, and you can see the nearest invalidation level marked with a red line.
In this study, we're using Elliott Wave theory and structure, which involves multiple possibilities. The scenario we're presenting seems plausible because it's aligned across multiple timeframes and adheres to Elliott Wave principles. However, please remember that this analysis can be wrong, and you should consult with a financial advisor before making any investment decisions.
This post is shared purely for educational purposes, to illustrate possible Elliott Waves.
I am not Sebi registered analyst.
My studies are for educational purpose only.
Please Consult your financial advisor before trading or investing.
I am not responsible for any kinds of your profits and your losses.
Most investors treat trading as a hobby because they have a full-time job doing something else.
However, If you treat trading like a business, it will pay you like a business.
If you treat like a hobby, hobbies don't pay, they cost you...!
Hope this post is helpful to community
Thanks
RK💕
Disclaimer and Risk Warning.
The analysis and discussion provided on in.tradingview.com/u/RK_Chaarts/ is intended for educational purposes only and should not be relied upon for trading decisions. RK_Chaarts is not an investment adviser and the information provided here should not be taken as professional investment advice. Before buying or selling any investments, securities, or precious metals, it is recommended that you conduct your own due diligence. RK_Chaarts does not share in your profits and will not take responsibility for any losses you may incur. So Please Consult your financial advisor before trading or investing.

EDUCATIONAL | Uptrend OverEth has hit a major upward target.
Wave C is equal to Wave A
Will be on the lookout for shorting opportunities after getting a confirmation of downtrend, which will most likely be a corrective downtrend

Corrective RiseCoal India seems to have completed Wave D of a triangle/diametric and now entering Wave E
The minimum target is around 450-455 on a daily level.
Profit booking could be done on other mentioned intermediate levels according to your trading style

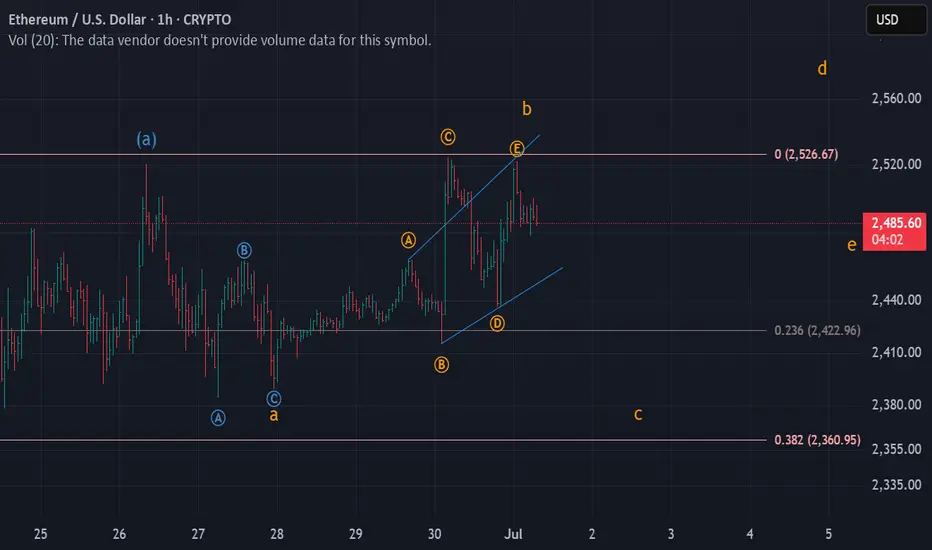
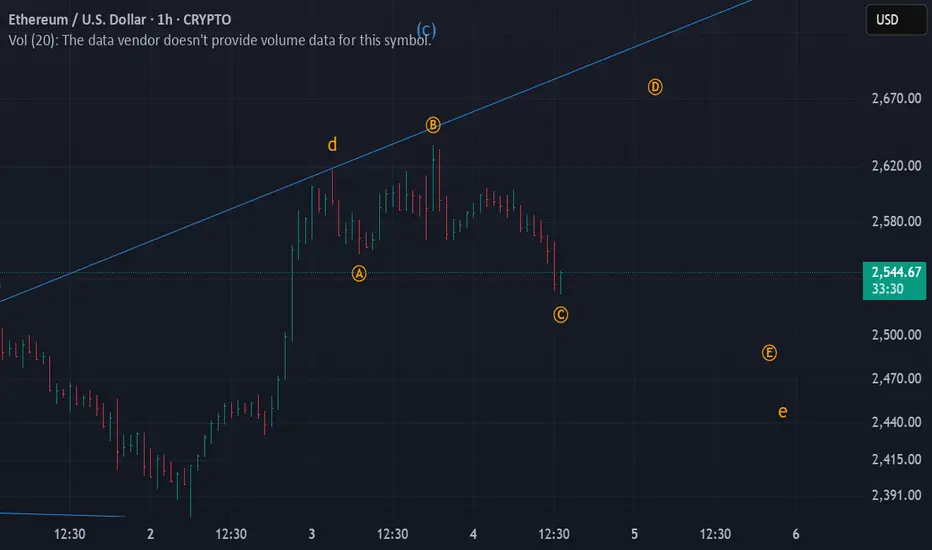
Corrective Rise UpEthereum seems to have completed Wave C of an expanding triangle and now we're headed towards Wave D.
Rise UpEth seems to have completed wave 2 or wave B and now moving upwards.
Tgt 1 -> 2630
Tgt 2 -> 2645

Corrective Rise UpEthereum seems to have completed Wave C
and now we're entering Wave D which will be a corrective rise.
I believe we're in the starting of a diametric formation which will be of 'diamond' category

Corrective Downtrend | Hourly Ethereum seems to have completed Wave B in an hourly timeframe and now moving towards Wave C which could end a little lower than the starting of Wave B.
Will keep updating in case of any changes