SBFC Finance (Requested View)Namaskaram
One friend asked of me my view on SBFC, Here It is.
Just leave a comment if you have query related to your stock
Thank You
Neowaveforecast

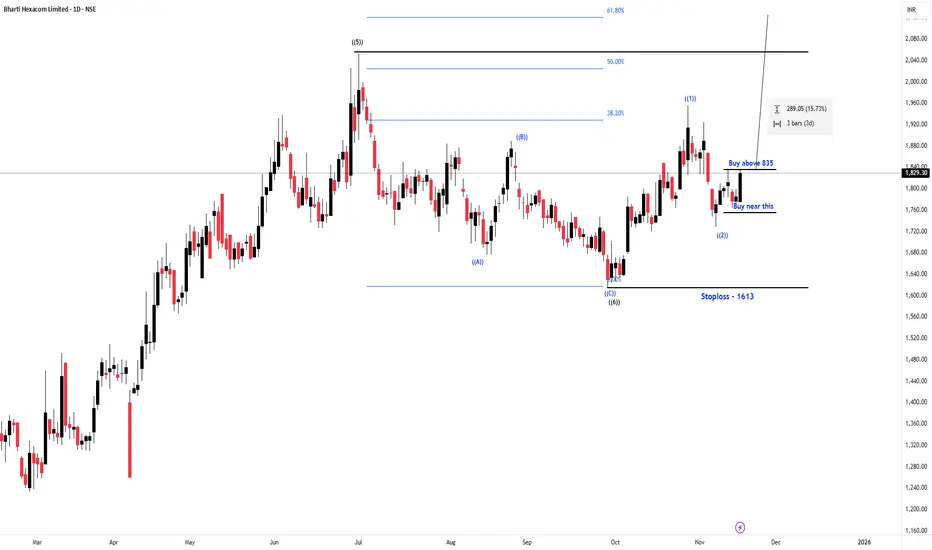
Bharti Hexacom Limited ( Neowave Trading Idea)Namaskaram
This is an swing trade, this is just to show you how our setup works,
will talk about setup in the tomorrow video.
About stock
Trend Cycle- 7th swing
Target just below the previous swing -2020
stoploss- 1614
stoploss will change to 1728 after friday if price goes above 835 and does not come back.
will update the trail sl.
This is an example how our furture setup will work, but still this is a tradable setup and counts is strong to take a swing trade.
It has no boundation of time limit.
if you have questions, you can ask me in the comments.
Thank You
Bank Nifty Target 69000 for upcoming Year 69000 Namaskaram Investor
This is a long Term forecast, in which we will discuss about the furture for bank nifty in upcoming months. Off course all the explanation will be give in the video, So kindly watch that to understand my view. It will be available after an hour.

PAYTM (NEOWAVE Analysis)Namaskaram Everyone
I have made a video on paytm, kindly watch that to understand my view.
If you want to know about your stock than feel free to ask me in comment.
Thanks.
PAYTM Video Analysis

PAYTM | Neowave AnalysisHi everyone
This is an neowave analysis as you asked about paytm in comment so here it is.
If you have more query or anyone else wants to know my view on particular stock, than simply leave a comment, i will be happy to help.
Thank You

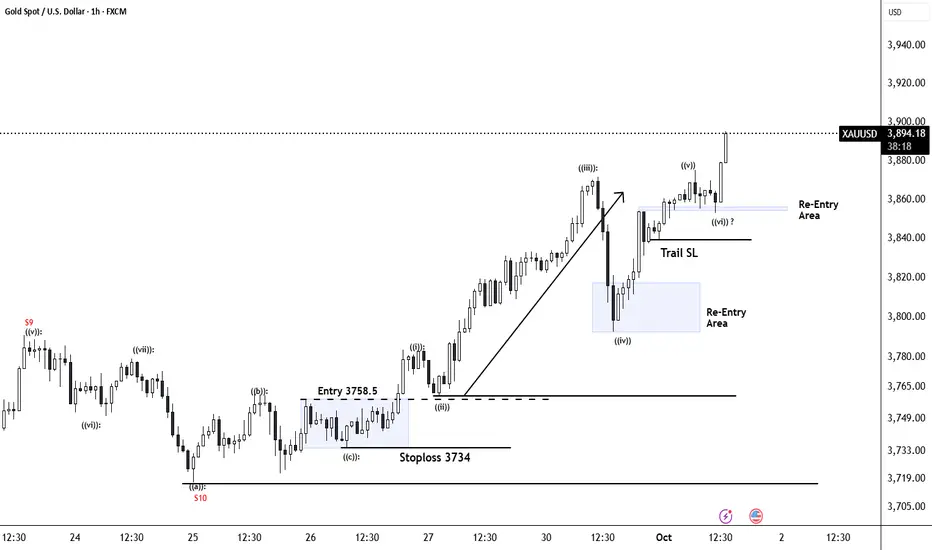
Gold (Neowave Trading Idea)Hello everyone
# Gold is started walking again in daily charts and its going or atleast try for the time being to break its all time again.
## Stoploss will be 3964 if breaks dont sell just exit.
Thanks

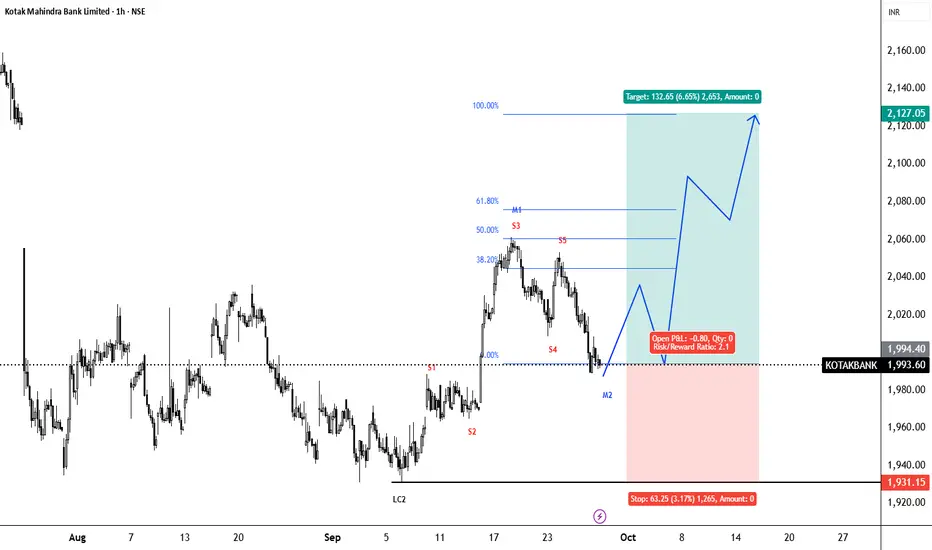
Kotak Mahindra Bank (Neowave Trading Idea)Namaskaram
Cycle - consolidated 5th up swing on Long Term Chart (Black Labelling).
Medium Cycle (Blue Labelling) giving an correction, which most likely completed.
Currently retraced 61 percent.
LTP = 2079.7
stoploss = 1,986
About Target- Well target should be above 2302.
But this price should reach before January. So if you see price is rising but not giving enough speed than exit where you get a good price.
I will also make a video on this one today and upload it here.
Thank You.

Gold Neowave Forecast (10-11-2025)Hello everyone
Sorry for absence as I go in research mode with Neowave and found something interestin, anyway lets talk about gold.
# Gold is started walking again in daily charts and its going or atleast try for the time being to break its all time again.
# I also added a blue box on the chart which is an time box, mean price must cross high within this time limits.
## Stoploss will be 3964 if breaks dont sell just exit.
Rest we will talk in the video along with BTC and Tesla.
Thank You.

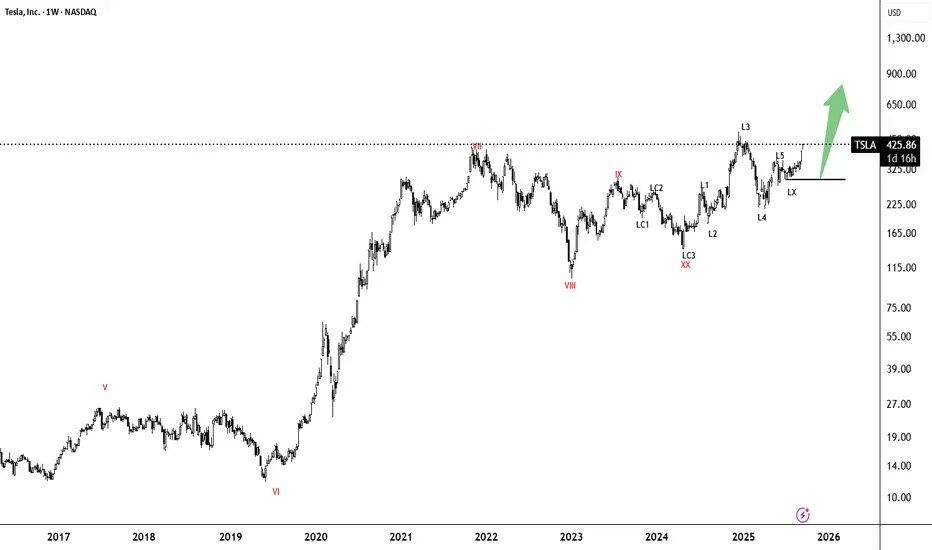
TESLA Bullish Wave CyclesHi everyone
Welcome to intelligent investor, we provide market insights by synchronising and combining all the price action waves from different time frames and gives you single trend.
If you see different keyword in charts, here is the meaning and an explaining video will be made in some time how to read and trade with these waves charts. Still if you have any query , you can leave a comment, i will be happy to answer your query.
Keyword Mean-
S- Short Term Trend
M- Medium Term Trend
L- Long Term Trend
I- Super Trend
(I)- Multiyear Trend
1,2,3,4,5 are wave bullish or bearish wave count
SC,MC,LC,AA,(AA)- mean consolidation or correction
X/XX- Like a joint in a trend or consolidation.
Gold Neowave Bulletin| 10/10/2025
Namaskaram Everyone
Welcome to intelligent investor, we provide market insights by synchronising and combining all the price action waves from different time frames and gives you single trend.
Here are all our previous gold analysis, with this you will understand how with Neowave Theory you will have an edge in the market.
Previous Neowave Bulletin
09/12/2025
07/10/2025
01/10/2025
30/09/2025
29/09/2025
OANDA:XAUUSD FOREXCOM:XAUUSD FX:XAUUSD VANTAGE:XAUUSD MCX:GOLD1!

Gold Neowave Update | 09/10/2025Namaskaram Everyone
Welcome to intelligent investor, we provide market insights by synchronising and combining all the price action waves from different time frames and gives you single trend.
Previous Video

Bank Nifty Neowave UpdateNSE:BANKNIFTY
Namaskaram Everyone
Welcome to intelligent investor, we provide market insights by synchronising and combining all the price action waves from different time frames and gives you single trend.
Degree Information

Gold Neowave UpdateNamaskaram Everyone
Welcome to intelligent investor, we provide market insights by synchronising and combining all the price action waves from different time frames and gives you single trend.
Degree Information
FX:XAUUSD OANDA:XAUUSD FOREXCOM:XAUUSD

Gold |Power of Neowave AnalysisIf you have any doubts related to your stocks and portfolio, ask in the comments we will provide you Neowave Chart for that.
To understand my view Kindly watch the videos-
Video Analysis 01/10/2025
Video Analysis 30/09/2025
Video Analysis 29/09/2025
Neowave Forecast| Gold|Bitcoin|Nifty|Bank Nifty|30/09/2025If you have any doubts related to your stocks and portfolio, ask in the comments we will provide you Neowave Chart for that.
Discussed Instruments
#Gold
#Bitcoin
#Nifty
#Bank Nifty
Yesterday Video-

BITCOIN Neowave ForecastNamaskaram
Watch the video to understand my view...
following instruments Discussed in the video...
#XAUUSD
#BTCUSD
#NIFTY 50
#BANK NIFTY
FX:XAUUSD OANDA:XAUUSD COINBASE:BTCUSD

XAUUSD | Neowave AnalysisNamaskaram
Watch the video to understand my view...
following instruments Discussed in the video...
#XAUUSD
#BTCUSD
#NIFTY 50
#BANK NIFTY
FX:XAUUSD OANDA:XAUUSD

Gold | Bitcoin | Nifty | Bank Nifty | Neowave AnalysisNamaskaram Everyone
We have discussed following instruments in this video, if you have any query you can ask in the comments.
#Gold
#Bitcoin
#Nifty
#Bank Nifty
COINBASE:BTCUSD FX:XAUUSD OANDA:XAUUSD NSE:BANKNIFTY NSE:NIFTY

Axis Bank Bullish Long Term ActivationKey Points
Trend Type- Long Term
Rally is already started, but still a long way to go up.So buy on retracements.
If you have the stock than hold it for few months and more.
Like and share is appreciated.
Thank You
To understand how our coding works read the below post-
NSE:AXISBANK

SBI BANK |Neowave AnalysisNamaskaram Everyone
I trade using Neowave and on that I have created an trading setup, which is kind of automatic entry and exit with Neowave.
Neowave is kind of a method in which you synchronize all the price action across all the time frames. It hides all the noise and tells you market is bullish or bearish.
About Stock
This is not a trading idea, it would have been if updated few weeks back. Just a neowave counts update for some one who is already holding the stock.
Stock already started its rally in correction, if you get some retracement than buy it.
For coding style read the below post
If you have the stock than hold it and trail it as the counts proceed in future.
Like and share is appreciated.
Thank You
To understand how our coding works read the below post-
NSE:SBIN

IndusInd Bank BearishNamaskaram Everyone
I trade using Neowave and on that I have created an trading setup, which is kind of automatic entry and exit with Neowave.
Neowave is kind of a method in which you synchronize all the price action across all the time frames. It hides all the noise and tells you market is bullish or bearish.
About Stock
This is not a trading Idea, just a structural update for someone who is thinking to invest.
Creating Nifty 50 Neowave Charts Library for all of you, Like and share is appreciated if you like our work.
Thank You
To understand how our coding works read the below post-
NSE:INDUSINDBK

Kotak Mahindra Bank Neowave Trading IdeaNamaskaram Everyone
I trade using Neowave and on that I have created an trading setup, which is kind of automatic entry and exit with Neowave.
Neowave is kind of a method in which you synchronize all the price action across all the time frames. It hides all the noise and tells you market is bullish or bearish.
About Stock Structure
Entry Type- Medium Term Forecast mean Entry will take 4 to 8 weeks and some times more.
Wave Structure- We are at starting point of wave, which kind of gives you an edge in riding the wave when you above your buying level
60 percent Retracement- Mean you will have easily 1:2 or 3 easy risk reward.
Doubts-If you are fearing in taking trades that mean you are taking stop loss amount more than you & your capital can handle.
Follow 1 percent rule and trail, that's it. Don't complicate life and trading.
Simply live and die. HaHA
Like and share is appreciated.
Thank You
To understand how our coding works read the below post-
NSE:KOTAKBANK NSE:KOTAKBANK1!
Gold Neowave Stuctural UpdateNamaskaram Everyone
Welcome to intelligent investor, we provide market insights by synchronising and combining all the price action waves from different time frames and gives you single trend.
How To Read My Charts...Click Below
FX:XAUUSD FX:XAUUSD OANDA:XAUUSD MCX:GOLD1!
