Long Nestle Target 3000+Nestle on charts has formed bullish harmonic pattern and have already achieved Target B.
Following are next targets
Target 1 - 2778
Target 2 - 3054
Target 3 - 3192
Stop Loss - Point D on chart
This is long term view.
Nestleanalysis

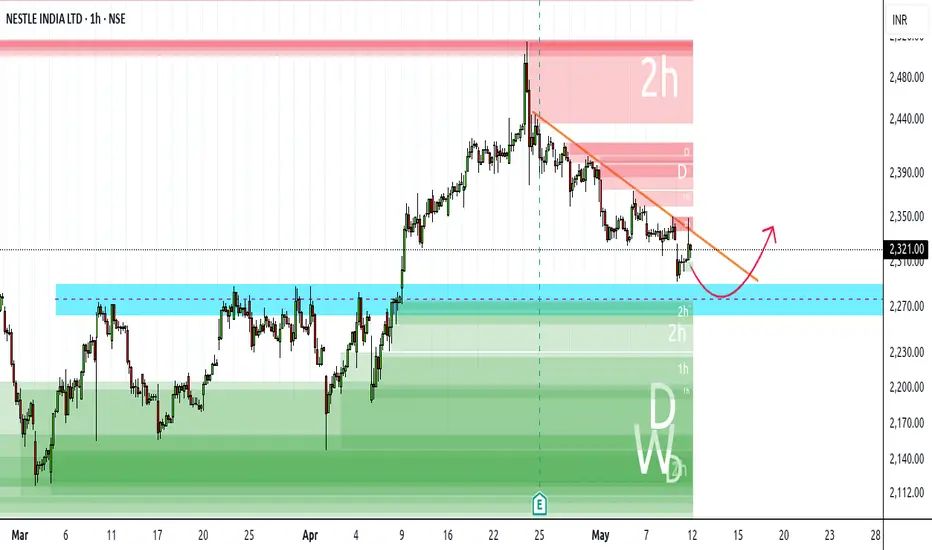
Nestle India - Don't Miss the opportunityStock currently in downtrend in every time frame
But finally approaching its strong support level
Which is a demand zone in multiple time frame as well as a flip zone too
Buying zone can be between 2270 - 2290 with strict SL below 2260 closing basis (at least in hourly candle)
Upside 1st tgt can be at least 2400 and so on
Nestle - Sideways to positiveStock dosent seems to be breaking below 2460
Making HH HLs
Slowly but steadily making a way for 2600 soon again
Sl can be kept below 2450

NESTLE SWING TRADE | BUY @ 2500 - 2510Buy Nestle India around 2500 - 2510 and add more if gets at lower price near 2470 for the targets of 2610 - 2630 until 2450 is intact on the downside.
To motivate us, Please like the idea If you agree with the analysis.
Happy Trading!
InvestPro India

NESTLEIND SELLING POINT OF VIEW ON 29TH FEB 2024After a long fall, when we apply Fibonacci retracement from the high to the low, it shows a 0.5 retracement, and the fall continues. Moreover, the previous lower low has been breached by the present candle. I am confident that this downward trend will persist on February 29th, 2024. Yes, I am aware it's a Thursday. Additionally, the NESTLEIND FMCG index also indicates a single downtrend."

NestleDouble bottom were formed and retested as well and today gave beautiful up move but drawback from resistance...

Bearish ABCD In NestleNestle India
Sell PRZ - 22930/23009
SL - 23175 ( Weekly Closing Basis )
Target - 21052/20500

NESTLE SWING TRADENestle looking good for a long at cmp of 22666 , a good pattern breakout and retest is done , can reach targets of 23k and 24k in coming days if idea goes right , RR 1:3 SL at 21200 , medium to short term swing with good RR

NESTLE INDIA | LOOKING GOOD ABOVE 21100Buy Nestle India if sustains above 21100 for the marked targets on the chart until 20300 on the downside is intact.
To motivate us, Please like the idea If you agree with the analysis.
Happy Trading!
InvestPro India Team

$NESTLEIND SELL CALL TARGET 17450 SL 19650#NESTLEIND
SELL CALL
TARGET 17450
SL 19650
nESTLE iNDIA. alREADY BREAKOUT HAPPENED IN 4 HOURS CHART. After Retesting, it is trending down side..

NESLTE INDIA CHART ANALYSISNestle India form Descending chart pattern where it has gave us nice BreakDown with little Retrecemnt in previous Session.
Now after breaking Previous day low if 1hour Candle get sustain in Below Level we can see further lower levels in NESLTE INDIA
KEEP AN EYE ON IT….!!!!!


Nestle AnalysisNestle India:
---------------
Price & Volume relation:
------------------------------
Monthly: Previous candle low (19050) was taken out clearly but the Volume is not supporting yet & taking hault @important support level.
Weekly: Price & Volume both supporting movement.
Daily: Both supporting.
Pattern:
----------
Yellow line Symmeterrice triangle (Sideways until breaks either side)
Redline: Important Support level
Conclusion: If day low (18352) is taken out & sustain then we can short with a small qty until below trendline is taken out & Once that is taken out we can add further & continues.

Nestle forming flag and pole on higher time frame.Nestle India has been consolidating in a flag and pole pattern. The stock has taken support from its 20 DMA and respected the levels convincingly
The stock on the hourly time frame has been trading around its 20 ema.
Stock on the monthly basis has never closed above 19750.
If the stock breaks out or breaks down a nice movement can be achieved.
Wait for the stock to close above or below the consolidation zone on daily time frame.
Support :- 18850, 18380
Resistance :- 20000, 20500
Stock or stock option can be traded for a swing to positional trading.
Let the market form a price action near the levels before trading.

Nestle Chart Analysis !!📈 Nestle 📉
My Findings :-
1. Breakout from resistance zone.
2. Close Above March 2022 High.
Bias- Long
Target- 18880, 19934 and 20464
SL- 17861
RR- 1: 3
All Important Supports and Resistances are drawn in chart. All levels are on closing basis.
Please have a look and revert back if you need some more study on it.
Disclaimer : Consult Your Financial Advisor Before Taking Any Decision On This Analysis.

Nestle India - RSI DivergenceNestle India is showing a RSI Divergence and good upward trend. Targets are as mentioned on the charts.
This is for educational purpose only.
Let me know your thoughts in the comments section.

Nestle (Bearish View)Currently the stock is discounted at 16% from all time high levels.
Nestle (TF=W):
1. Rising Channel Breakdown
2. Rejection from 5 Days Exponential Moving Average
3. Negative Crossover of 5, 13 Weeks Exponential Moving Average
4. Gave a closing below 100 Days Exponential Moving Average
5. Next Support is coming around 16,300
6. RSI below 40 (which is again a sign of Bearishness)
Nestle (TF=D):
1. Stock is continuously in a Downtrend making Lower highs and Lower lows.
2. Channel Breakdown and has also retested the levels
3. Negative Crossover of 5, 13 Days Exponential Moving Average
4. Gave closing below 200 Days EMA
Addl Points:
1. FII/FPI have increased holdings from 12.31% to 12.35% in Dec 2021 qtr.
2. Mutual Funds have decreased holdings from 3.83% to 3.78% in Dec 2021 qtr
Note:
1. This is just for educational purpose

Nestle BreakDown !! 📈 Nestle 📉
Nestle was taking support at Upward Parallel Channel since October 2020 and today it broke down. Break off this Definitely shows signs of trouble in stock.
On The upside in sync with downtrending trendline and started forming lower highs and lower lows.
My View : Look for shorting opportunities as it broke the upward trendline and started following downward trendline. And look for targets of 16500 and 15300.
Disclaimer : Only For Education Purpose. Consult Your Financial Advisor Before Taking Any Decision On This Analysis.

Swing Setup EXPLANATION : This is a 1 hour time frame chart of NESTLEIND . It has formed Head & Shoulder pattern // Triple Top pattern , If give a strong breakout and broke its demand zone with high volumes and retest the same , I am bearish on NESTLEIND . If taking support from demand zone trade with multiple confirmations .
If you like this analysis of Stock give a Like // Follow for more updates , let me know in comments below :)

Swing Trade: NESTLEIND => Channel Pattern Breakout, don't miss.I can see a good channel breakout in the Nestleind stock on a daily timeframe. Retest also completed. That's why this stock looks excellent for the swing trade. This stock was consolidating in a channel for almost more than 500 days. And now it gave a breakout. Let's see. How it will perform.

NESTLEIND about to break out.It looks life NESTLE is about to breakout and thus push to higher levels. Consider a long position keeping the following levels in mind:
LONG ABOVE: 18290
STOP LOSS: 18130
TARGET 1: 18450
TARGET 2: 18610
_______________________________________________________________________________________________________________________________________________________
Manage your risk and trade your plan. :)

Nestle India - Ascending Triangle formationNote: This is for educational purpose only. Please do not trade in F&O.
There seems to be an ascending triangle formation with small build up near resistance. RSI above 60 indicates bullish momentum.
SL: ₹ 17300

