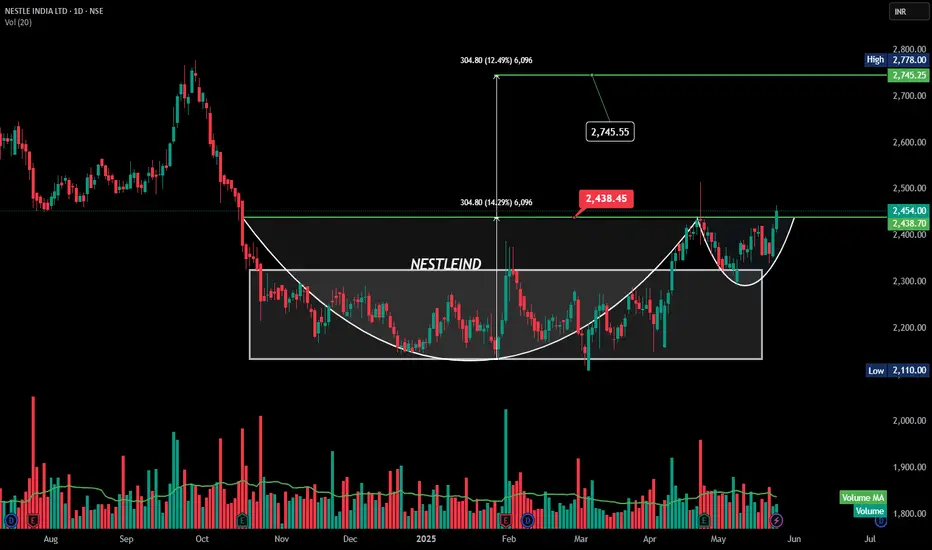
NESTLEIND |Cup & Handle Breakout | DailyThis chart of **Nestle India Ltd** shows a **Cup and Handle** breakout pattern — a strong bullish continuation signal.
---
### 🟢 **Cup & Handle Breakout – Nestle India Ltd**
#### **Pattern Highlights:**
* **Cup Formation:** Long rounding bottom from Nov 2024 to April 2025.
* **Handle:** Minor consolidation and dip in May 2025.
* **Breakout Point (Neckline):** ₹2,438.45
* **Target Projection:**
Height of cup ≈ ₹305
📈 Target = ₹2,438 + ₹305 = **₹2,745** (marked)
### ✅ Key Takeaways:
* **Breakout is with volume**, confirming strength.
* **Next resistance zones**: ₹2,745.60 and ₹2,768.60.
* **Supports post-breakout**: ₹2,438 (neckline).
Would you like a full YouTube-ready set (title, description, tags, disclaimer) for this chart as well?
NESTLEIND
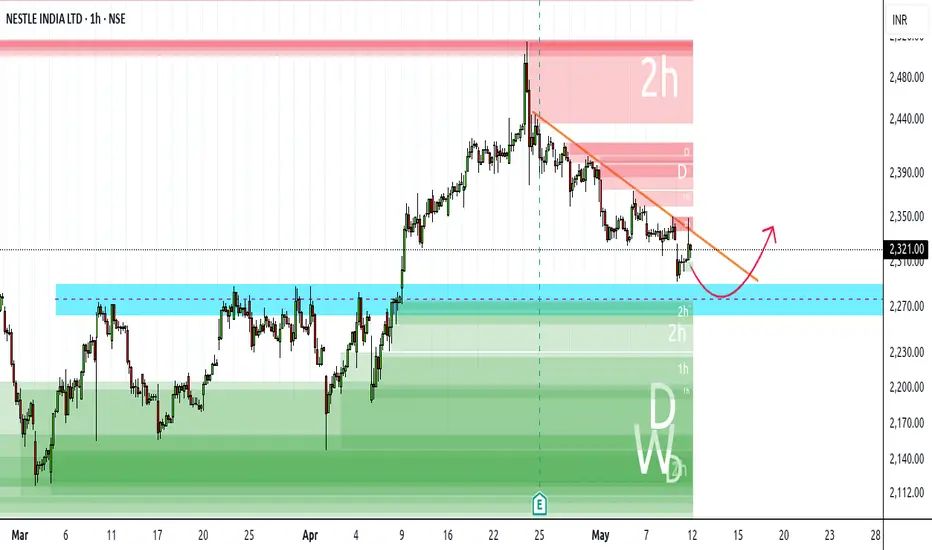
Nestle India - Don't Miss the opportunityStock currently in downtrend in every time frame
But finally approaching its strong support level
Which is a demand zone in multiple time frame as well as a flip zone too
Buying zone can be between 2270 - 2290 with strict SL below 2260 closing basis (at least in hourly candle)
Upside 1st tgt can be at least 2400 and so on
Nestle - Sideways to positiveStock dosent seems to be breaking below 2460
Making HH HLs
Slowly but steadily making a way for 2600 soon again
Sl can be kept below 2450

NESTLE SWING TRADE | BUY @ 2500 - 2510Buy Nestle India around 2500 - 2510 and add more if gets at lower price near 2470 for the targets of 2610 - 2630 until 2450 is intact on the downside.
To motivate us, Please like the idea If you agree with the analysis.
Happy Trading!
InvestPro India

Buy Nestle India for Target 26k to 29K - Short termThe observation is not based on any indicators but a trend pattern and we may see the last leg of rally in Nestle in near term.
The stop Loss is low of the last breakout candle on trend line.
The immediate target is 26K and further target is 29K+. if it sustains above the 26K on monthly chart.
Rationale - Nestle has been consistent with rising price trend in stepwise manner. This is probably last leg rally before it takes some rest. Another thing is the stock is approved for split from shareholders and awaiting the record date.

NestleDouble bottom were formed and retested as well and today gave beautiful up move but drawback from resistance...

NESTLE INDIA | LOOKING GOOD ABOVE 21100Buy Nestle India if sustains above 21100 for the marked targets on the chart until 20300 on the downside is intact.
To motivate us, Please like the idea If you agree with the analysis.
Happy Trading!
InvestPro India Team


NESTLEIND: Retesting 200 EMACMP: 18841
- Compression in price visible near 50% Fibo level
- Taking support at the confluence of 200 EMA and previous breakout zone

Nestle AnalysisNestle India:
---------------
Price & Volume relation:
------------------------------
Monthly: Previous candle low (19050) was taken out clearly but the Volume is not supporting yet & taking hault @important support level.
Weekly: Price & Volume both supporting movement.
Daily: Both supporting.
Pattern:
----------
Yellow line Symmeterrice triangle (Sideways until breaks either side)
Redline: Important Support level
Conclusion: If day low (18352) is taken out & sustain then we can short with a small qty until below trendline is taken out & Once that is taken out we can add further & continues.

Nestle forming flag and pole on higher time frame.Nestle India has been consolidating in a flag and pole pattern. The stock has taken support from its 20 DMA and respected the levels convincingly
The stock on the hourly time frame has been trading around its 20 ema.
Stock on the monthly basis has never closed above 19750.
If the stock breaks out or breaks down a nice movement can be achieved.
Wait for the stock to close above or below the consolidation zone on daily time frame.
Support :- 18850, 18380
Resistance :- 20000, 20500
Stock or stock option can be traded for a swing to positional trading.
Let the market form a price action near the levels before trading.

NESTLE - 13th JUly 2022Stock hitting Resistance of 18800 - 18000.
Bears will be active below these levels.

Nestle Chart Analysis !!📈 Nestle 📉
My Findings :-
1. Breakout from resistance zone.
2. Close Above March 2022 High.
Bias- Long
Target- 18880, 19934 and 20464
SL- 17861
RR- 1: 3
All Important Supports and Resistances are drawn in chart. All levels are on closing basis.
Please have a look and revert back if you need some more study on it.
Disclaimer : Consult Your Financial Advisor Before Taking Any Decision On This Analysis.


A good catch of bearish momentum - NestleIndThe Details and explanation are given on the charts.
* It can either start falling directly or can retrace or consolidate before making a downmove.
S.L is mandatory in such volatile market conditions and You can also trail S.L (Totally depends on your trading style)
- I urge the trading view community to engage and share their views on this setup. and If you are satisfied by my analysis do give a thumbs up and enjoy the profits. :)

📊 Nestle India Swing Trade Opportunity 🎯NSE:NESTLEIND
Everything mentioned on chart. Kindly trade as per your trade setup.
******whatever charts or levels sharing here or on any other platforms are just for educational purpose only, Not A Recommendation To Buy Or Sell. Please do your own analysis before taking any trade on them. We are not SEBI registered.

Swing Setup EXPLANATION : This is a 1 hour time frame chart of NESTLEIND . It has formed Head & Shoulder pattern // Triple Top pattern , If give a strong breakout and broke its demand zone with high volumes and retest the same , I am bearish on NESTLEIND . If taking support from demand zone trade with multiple confirmations .
If you like this analysis of Stock give a Like // Follow for more updates , let me know in comments below :)

Breakout Pullback on NESTLEINDNESTLEIND broke out from its year long resistance on the Daily chart and has successfully pulled back and the bullish action has resumed. Odds are in favor of the stock moving further upward toward the 6.854 Fib zone of 22850.

NESTLEIND - Channel BreakoutNSE:NESTLEIND
Nestle might give channel breakout above 19650-19700 rage and target is around 21000

NESTLEIND about to break out.It looks life NESTLE is about to breakout and thus push to higher levels. Consider a long position keeping the following levels in mind:
LONG ABOVE: 18290
STOP LOSS: 18130
TARGET 1: 18450
TARGET 2: 18610
_______________________________________________________________________________________________________________________________________________________
Manage your risk and trade your plan. :)

Nestle India - Ascending Triangle formationNote: This is for educational purpose only. Please do not trade in F&O.
There seems to be an ascending triangle formation with small build up near resistance. RSI above 60 indicates bullish momentum.
SL: ₹ 17300


