BUY TODAY SELL TOMORROW for 5% - BTST STOCK OPTIONDON’T HAVE TIME TO MANAGE YOUR TRADES?
- Take BTST Stock Option trades at 3:25 pm every day
- Try to exit by taking 4-7% profit of each trade
-Cup and Handle Breakout in NESTLEIND
BUY TODAY, SELL TOMORROW for 5%
Nestleindia

BUY TODAY SELL TOMORROW for 5% - BTST STOCK OPTIONDON’T HAVE TIME TO MANAGE YOUR TRADES?
- Take BTST Stock Option trades at 3:25 pm every day
- Try to exit by taking 4-7% profit of each trade
-Trendline Breakout in NESTLEIND
BUY TODAY, SELL TOMORROW for 5%

NESTLEIND – Symmetrical Triangle Breakout Setup (1D Chart)I’m watching Nestle India for a potential bullish breakout from a symmetrical triangle on the daily timeframe. Price has been consolidating after a strong impulsive move, and it is now respecting both trendline support and triangle resistance.
🔍 What I'm Seeing
Price created a strong rally, followed by a healthy consolidation.
A symmetrical triangle pattern has formed — showing tight price compression.
Price is currently sitting near the trendline support, indicating buyers are still active.
A breakout above the triangle could trigger the next bullish leg.
📈 Trade Idea
Entry Zone: Around current levels near the triangle breakout
Stop Loss: Placed below the trendline + recent swing lows
Target: Previous strong resistance zone near ₹1383
This gives a clean risk-to-reward setup with a logical structure: risk below support, target at the next major supply zone.
🎯 Why This Setup Makes Sense
Triangle breakout often leads to strong directional moves.
Trendline support confirms buyer strength.
Market structure is shifting bullish after breaking the downtrend earlier.
⚠️ Risk Note
This is not financial advice. Always manage risk properly and wait for a confirmed breakout candle before entering.
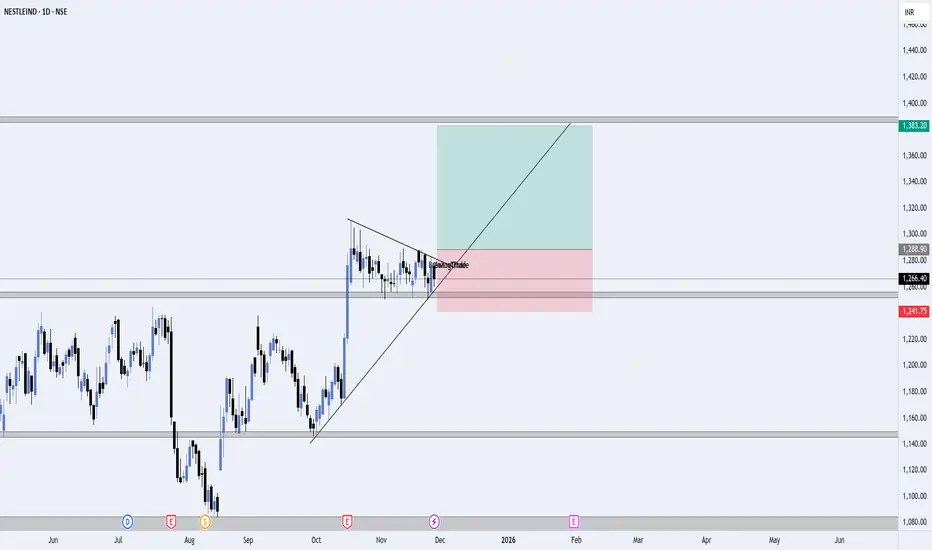
Nestle India (D) - Breaks Out of Consolidation with ForceAfter a period of sideways consolidation following its September 2024 All-Time High, Nestle India has delivered a decisive breakout, signaling a potential resumption of its primary uptrend.
The Context: A Sideways Pause
Following a brief downtrend from its peak, the stock entered a sideways trading range. A key horizontal resistance level consistently capped any upward movement, keeping the stock in a state of consolidation.
Today's Decisive Breakout
Today's session (Thursday, October 16, 2025) decisively ended this sideways action in favor of the bulls:
- Strong Price Surge: The stock rallied by +4.52% .
- Confirmed Breakout: Crucially, the stock broke out and closed above the key resistance level , a strong positive signal.
- High Volume: The move was supported by a robust volume of 6.92 million shares , adding significant conviction to the breakout.
Broad-Based Technical Strength
This bullish price action is strongly supported by key momentum indicators across all major timeframes (Monthly, Weekly, and Daily). The short-term Exponential Moving Averages (EMAs) are in a positive crossover state, and the Relative Strength Index (RSI) is rising, indicating broad and strengthening momentum.
Outlook and Key Levels to Watch
With the breakout confirmed, the path of least resistance has shifted firmly upwards.
- Bullish Target: If the bullish momentum continues, the next logical area of resistance and potential price target is the ₹1,340 level.
- Critical Support & Confirmation: The former resistance level, around ₹1,241 , now becomes the most critical new support. Watching for the stock to successfully re-test this level and bounce with momentum would provide the strongest confirmation that this breakout is sustainable.
In conclusion, today's high-volume breakout is a powerful bullish event. The key now is for the price to remain above the ₹1,241 support level to validate the start of a new, sustained uptrend.

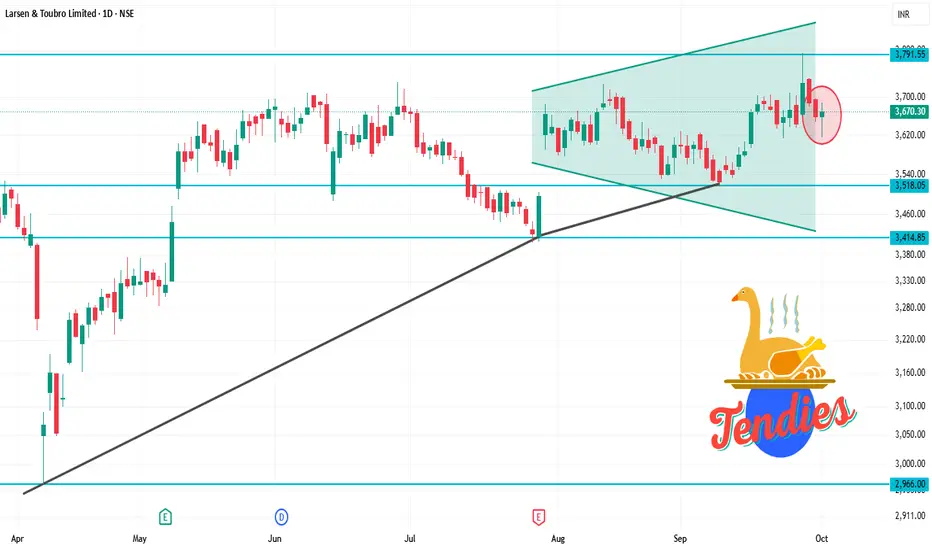
LT 1D Time frameCurrent Snapshot
Current Price: ₹3,670.30
52-Week High: ₹3,963.50
52-Week Low: ₹2,965.30
Strategy & Outlook
Bullish Bias: The stock is in a short-term uptrend with positive momentum indicators.
Buying Opportunity: Consider entering near support zones (₹3,600–₹3,650) with a target towards ₹3,700–₹3,750.
Risk Management: Place stop-loss orders below the support levels to manage potential downside risks.
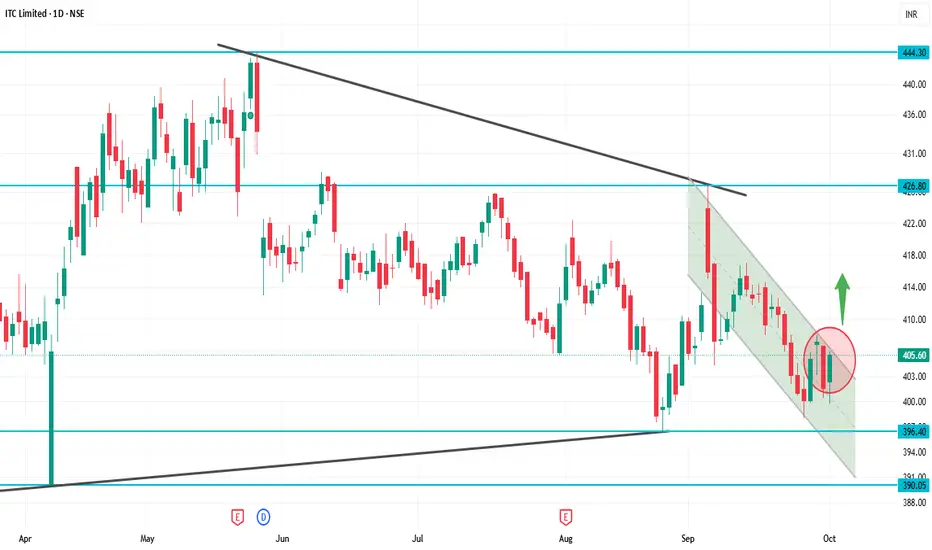
ITC 1D Time frameCurrent Price: ₹405.60
52-Week High: ₹524.35
52-Week Low: ₹390.15
Trend: Downward — trading below 5, 20, 50, 100, 200-day moving averages
Daily Chart Insights
Price below moving averages → bearish trend.
RSI & MACD → weak momentum, signaling short-term selling pressure.
Support zone at ₹390–₹400 → critical; a break below can push price down to ₹370–₹380.
Resistance at ₹420–₹430 → a strong close above may signal trend reversal.
Strategy / Outlook
Bearish Bias: Short-term trend is downward.
Buying Opportunity: Near support zones (₹390–₹400) if it holds.
Bullish Trigger: Close above ₹430 with strong volume indicates potential reversal.
Risk Management: Use stop-loss below critical support zones.
SBIN 1D Time frameCurrent Price (approx): ₹864
52-Week Low: ₹680
52-Week High: ₹880.50
Daily Chart Explanation
On the 1-day timeframe, SBIN is moving near its upper range, close to the recent high. This means the stock is strong but also facing heavy resistance.
Trend: Uptrend overall (higher highs and higher lows).
Momentum: Price is consolidating near resistance, showing hesitation.
Candles: Recent candles show wicks near the top, which means sellers are active near ₹880.

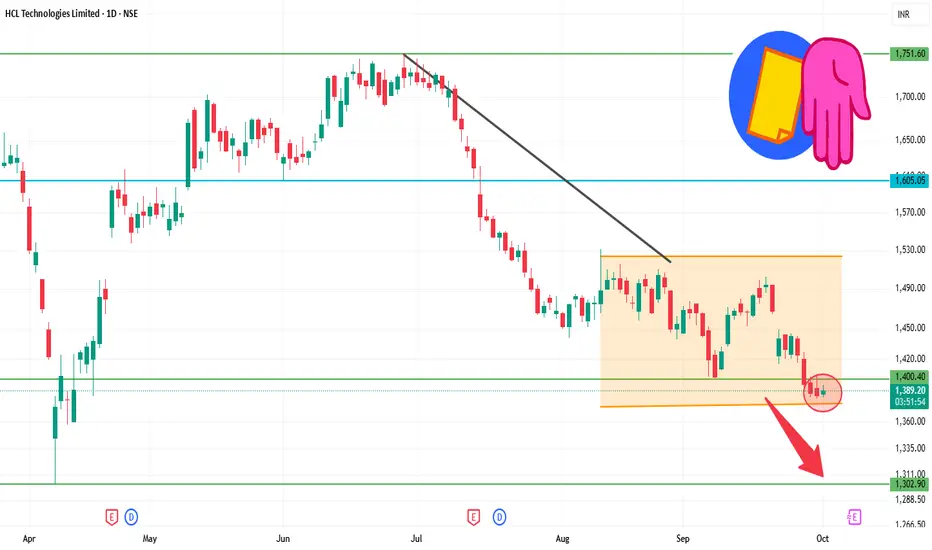
HCLTECH 1D Time frameOpening Price: ₹1,387.40
Closing Price: ₹1,387.40
Day Range: ₹1,383.10 – ₹1,395.00
Previous Close: ₹1,387.40
📉 Trend Analysis
Short-Term Trend: Bearish — The stock is trading below key moving averages, confirming the bearish trend.
Medium-Term Trend: Neutral — The stock is in a consolidation phase, characterized by lower highs and lower lows.
Long-Term Trend: Neutral — No significant trend identified; the stock is trading within a range.
HEROMOTOCO 1D Time frame📌 Current Status
Closing Price: ₹5,410
Day Change: –35 points (–0.64%)
Day’s High: ₹5,470
Day’s Low: ₹5,380
52-Week Range: ₹4,800 – ₹6,050
🔍 Chart & Price Action Insights
Price is moving sideways, bouncing between support and resistance.
Bulls are defending ₹5,380
Sellers resist above ₹5,470
Watch for a break above ₹5,470 for potential upward momentum
Break below ₹5,380 may trigger a short-term decline toward ₹5,330

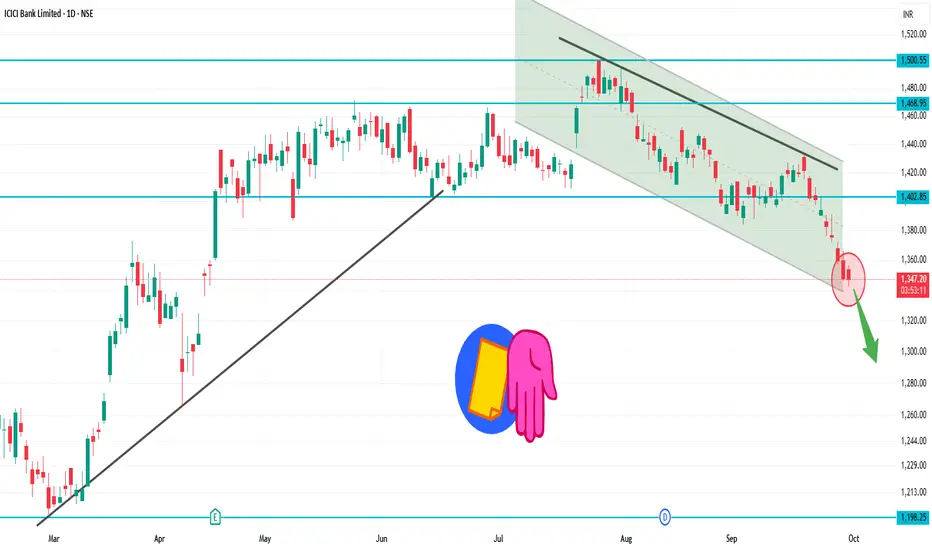
ICICIBANK 1D Time frame₹1,345.80 (NSE)
Day’s Range: ₹1,342.60 – ₹1,356.60
52-Week Range: ₹1,186.00 – ₹1,500.00
📉 Technical Overview
Trend: The stock is trading below its 200-day moving average, indicating a mildly bearish trend.
RSI: Currently at 26.6, suggesting the stock is in the oversold zone.
MACD: At -10.01, reinforcing the bearish momentum.
Moving Averages: A strong sell signal is indicated, with 0 buy signals and 12 sell signals across various timeframes.
🔼 Potential Upside (Rise)
Immediate Resistance: ₹1,355 – ₹1,365
Breakout Target: Above ₹1,365, the next resistance is around ₹1,380 – ₹1,390.
Bullish Confirmation: A close above ₹1,390 could signal a reversal or consolidation.
🔽 Potential Downside (Fall)
Immediate Support: ₹1,340 – ₹1,330
Breakdown Target: Below ₹1,330, the stock may test ₹1,310 – ₹1,300.
Bearish Confirmation: A close below ₹1,300 would strengthen the bearish outlook.
✅ Summary
Above ₹1,365: Potential rise toward ₹1,380 – ₹1,390.
Below ₹1,330: Potential fall toward ₹1,310 – ₹1,300.
Between ₹1,330 – ₹1,365: Likely range-bound movement.
AXISBANK 1D Time frameTrading close to ₹1,130.
This is slightly below the earlier ₹1,160–₹1,170 zone we discussed, so the range shifts down.
🔼 Upside (Rise Possibility)
Immediate resistance near ₹1,140 – ₹1,145.
If price breaks and sustains above this, it can move to ₹1,155 – ₹1,165.
Strong momentum above ₹1,165 may extend toward ₹1,175.
🔽 Downside (Fall Possibility)
First support is at ₹1,120 – ₹1,115.
If that breaks, price could slip toward ₹1,105 – ₹1,095.
Closing below ₹1,095 would weaken the trend further.
✅ Summary for Today
Above ₹1,140 → rise possible till ₹1,155 – ₹1,165.
Below ₹1,120 → fall possible till ₹1,105 – ₹1,095.
Between ₹1,120 – ₹1,140 → sideways range.

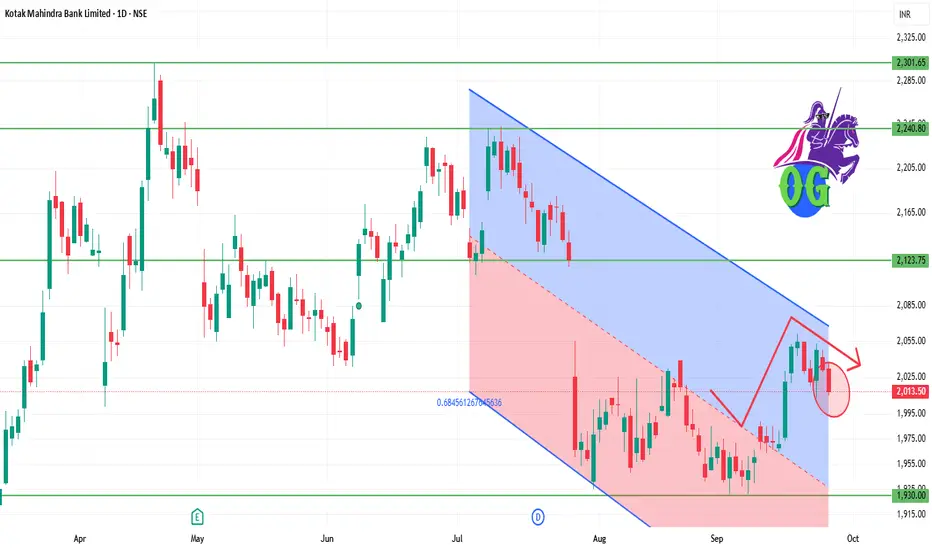
KOTAKBANK 1D Time frame📊 Daily Snapshot
Closing Price: ₹2,013.60
Day’s Range: ₹2,012.50 – ₹2,031.30
Previous Close: ₹2,031.30
Change: Down –0.72%
52-Week Range: ₹1,679.00 – ₹2,302.00
Market Cap: ₹4.04 lakh crore
P/E Ratio: 21.09
Dividend Yield: 0.12%
EPS (TTM): ₹96.30
Beta: 0.80 (indicating lower volatility)
🔑 Key Technical Levels
Immediate Support: ₹2,000.00
Immediate Resistance: ₹2,030.00
All-Time High: ₹2,302.00
📈 Technical Indicators
RSI (14-day): 45.2 – indicating a neutral condition.
MACD: Negative, suggesting bearish momentum.
Moving Averages: Trading below the 50-day and 200-day moving averages, indicating a bearish trend.
📉 Market Sentiment
Recent Performance: Kotak Mahindra Bank's stock declined by 0.72% on September 25, 2025, underperforming the broader market.
Volume: Trading volume was significantly lower than its 50-day average, indicating decreased investor activity.
📈 Strategy (1D Timeframe)
1. Bullish Scenario
Entry: Above ₹2,030.00
Stop-Loss: ₹2,000.00
Target: ₹2,050.00 → ₹2,070.00
2. Bearish Scenario
Entry: Below ₹2,000.00
Stop-Loss: ₹2,030.00
Target: ₹1,980.00 → ₹1,960.00
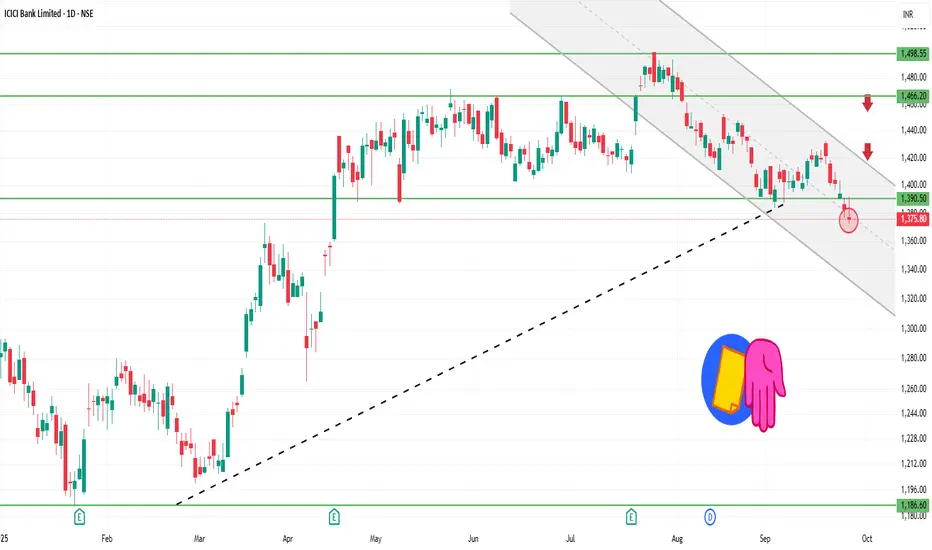
ICICIBANK 1D Time frame📊 Daily Snapshot
Closing Price: ₹1,375.50
Day’s Range: ₹1,371.80 – ₹1,391.50
Previous Close: ₹1,382.70
Change: Down –0.52%
52-Week Range: ₹1,018.85 – ₹1,494.10
Market Cap: ₹9.7 lakh crore
P/E Ratio: 20.5
Dividend Yield: 1.2%
EPS (TTM): ₹67.00
Beta: 1.05 (moderate volatility)
🔑 Key Technical Levels
Support Zone: ₹1,370 – ₹1,375
Resistance Zone: ₹1,390 – ₹1,400
All-Time High: ₹1,494.10
📈 Technical Indicators
RSI (14-day): 34.1 – approaching oversold territory, suggesting potential for a rebound.
MACD: Negative, indicating bearish momentum.
Moving Averages: Trading below the 150-day moving average, indicating a bearish trend.
Candlestick Patterns: Recent formation of a Bearish Engulfing pattern, suggesting potential for further downside.
📉 Market Sentiment
Recent Performance: ICICI Bank has experienced a decline for the fifth consecutive session, underperforming the broader market.
Sector Performance: The NIFTY BANK index also closed lower, reflecting sector-wide weakness.
📈 Strategy (1D Timeframe)
1. Bullish Scenario
Entry: Above ₹1,390
Stop-Loss: ₹1,370
Target: ₹1,405 → ₹1,420
2. Bearish Scenario
Entry: Below ₹1,370
Stop-Loss: ₹1,390
Target: ₹1,355 → ₹1,340
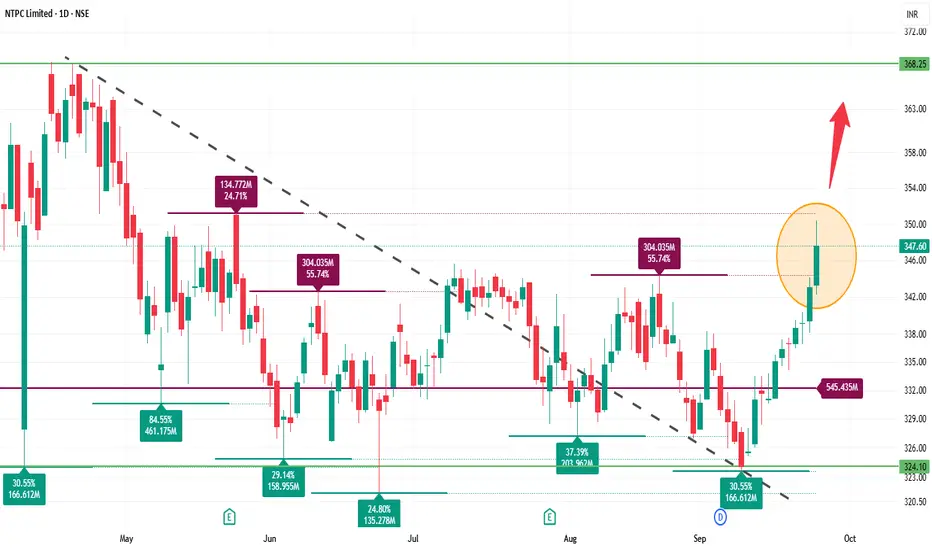
NTPC 1D Time frame📊 Today's Performance
Closing Price: ₹347.55
Day’s Range: ₹342.25 – ₹350.40
Previous Close: ₹343.00
Change: Up +1.33%
52‑Week Range: ₹292.80 – ₹448.45
Market Cap: ₹3.37 lakh crore
P/E Ratio: 14.07
Dividend Yield: 2.40%
EPS (TTM): ₹24.71
Beta: 1.06 (moderate volatility)
🔑 Key Technical Levels
Support Zone: ₹335.00 – ₹336.00
Resistance Zone: ₹350.00 – ₹355.00
All-Time High: ₹448.45
📈 Strategy (1D Timeframe)
1. Bullish Scenario
Entry: Above ₹350.00
Stop-Loss: ₹342.00
Target: ₹355.00 → ₹360.00
2. Bearish Scenario
Entry: Below ₹335.00
Stop-Loss: ₹342.00
Target: ₹325.00 → ₹320.00
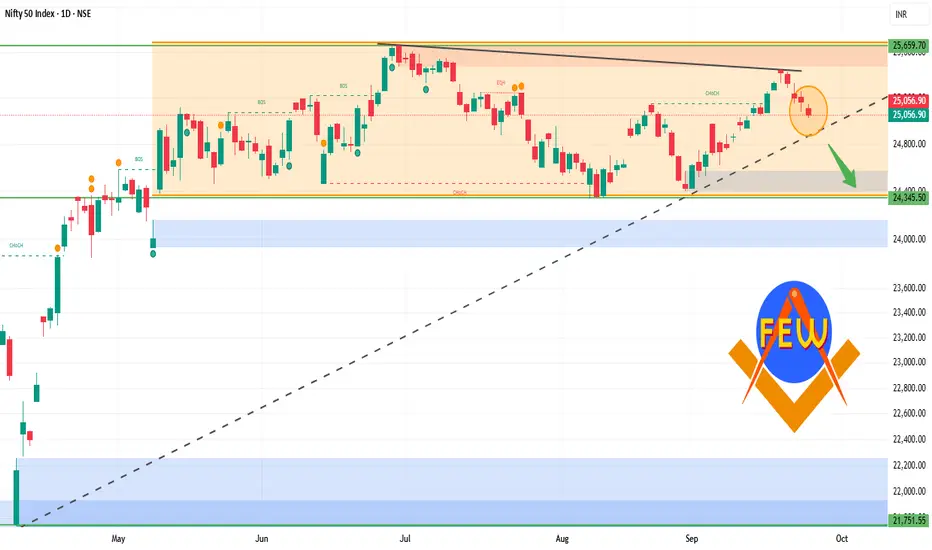
NIFTY 1D Time frame📊 Today’s Nifty Performance
Opening: Around 25,109
Closing: Around 25,057
Result: Market slipped about –52 points (–0.45%)
Range: High near 25,150, Low near 25,027
👉 If you were long (buy side) from the open and held till close → small loss (~52 points).
👉 If you were short (sell side) from the open and held till close → small profit (~52 points).
🎯 Key Levels
Support Zone: 25,000 – 25,020
Resistance Zone: 25,130 – 25,150
📝 Strategy
For Intraday Traders
Sell near resistance (25,130–25,150) with stop-loss just above 25,160.
Buy near support (25,000–25,020) with stop-loss just below 24,980.
For Swing Traders (2–3 days)
If Nifty sustains above 25,150, expect bounce toward 25,250+.
If Nifty breaks below 25,000, expect fall toward 24,900.
Risk Management
Use stop-loss always.
Don’t risk more than 1% of your capital on one trade.
Trail stop-loss if trade goes in your favor.
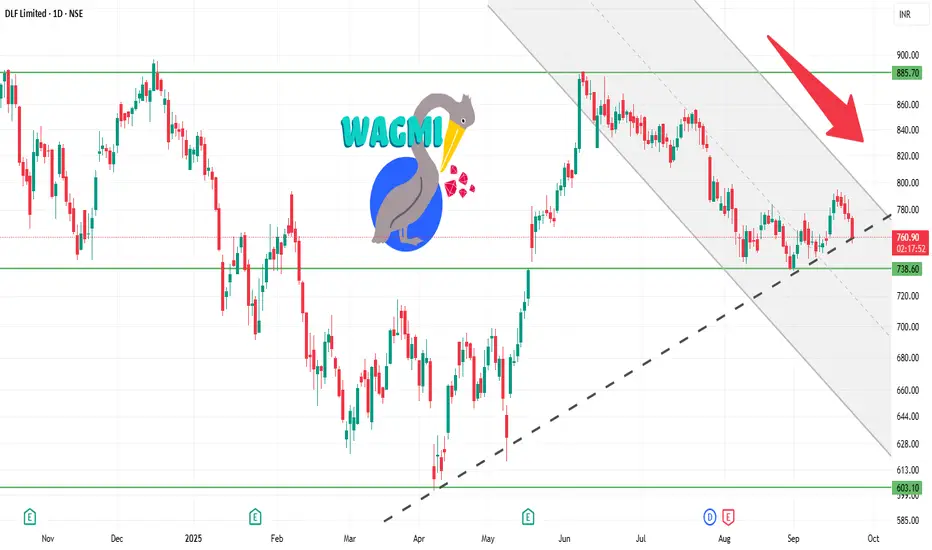
DLF 1D Time frame📍 Today’s Expected Range (Intraday Approximation)
Expected High: ₹767–₹775
Expected Low: ₹756–₹750
These are approximate intraday levels. Actual prices may fluctuate slightly due to market volatility.
🔍 Key Points
Current price: ₹760–₹761, trading near the middle of the day’s range.
If price breaks above ₹767–₹775 with strong volume → bullish momentum likely.
If price falls below ₹756–₹750 → short-term correction or pullback possible.
📊 Suggested Trading Strategy
Bullish Scenario
If DLF breaks ₹767–₹775, you can buy, targeting ₹780–₹785.
Stop-loss: ₹755
Bearish Scenario
If DLF drops below ₹756–₹750, you can sell/short, targeting ₹740–₹735.
Stop-loss: ₹760
Range-Bound / Sideways
If price trades between ₹756–₹767, it’s better to wait and avoid trading until a clear breakout occurs.
💡 Summary
Resistance Zone: ₹767–₹775
Support Zone: ₹750–₹756
Strategy: Trade in the direction of the breakout, and always use stop-loss to manage risk.
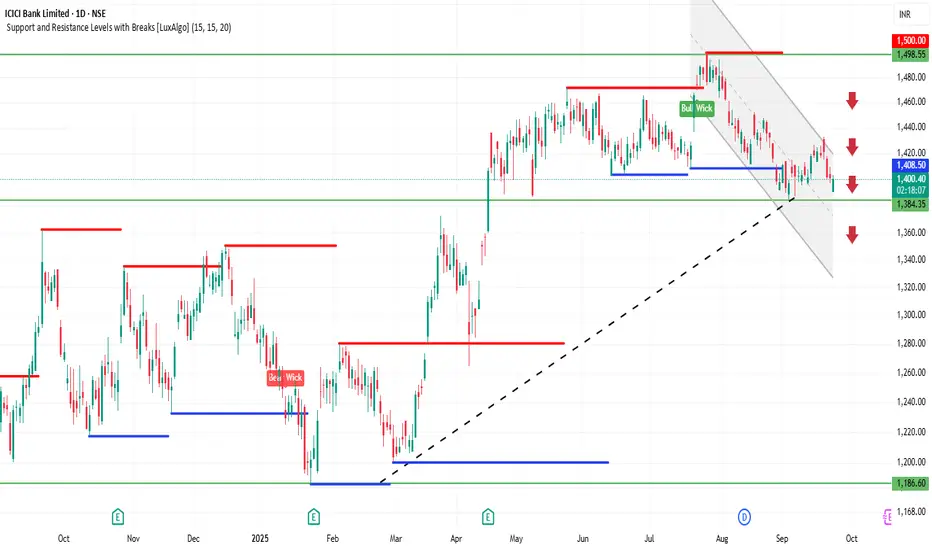
ICICIBANK 1D Time frame📍 Today’s Expected Range (Intraday Approximation)
Expected High: ₹1,403–₹1,410
Expected Low: ₹1,391–₹1,385
These are approximate intraday levels. Actual prices may fluctuate slightly due to market volatility.
🔍 Key Points
Current price: ₹1,400–₹1,401, close to resistance.
If price breaks above ₹1,410 with strong volume → bullish momentum likely.
If price drops below ₹1,385 → short-term correction or pullback possible.
📊 Suggested Trading Strategy
Bullish Scenario
If ICICI Bank breaks ₹1,403–₹1,410, you can buy, targeting ₹1,420–₹1,430.
Stop-loss: ₹1,395
Bearish Scenario
If ICICI Bank drops below ₹1,385, you can sell/short, targeting ₹1,375–₹1,370.
Stop-loss: ₹1,390
Range-Bound / Sideways
If price trades between ₹1,385–₹1,403, it’s better to wait and avoid trading until a clear breakout occurs.
💡 Summary
Resistance Zone: ₹1,403–₹1,410
Support Zone: ₹1,385–₹1,391
Strategy: Trade in the direction of the breakout, and always use stop-loss to manage risk.
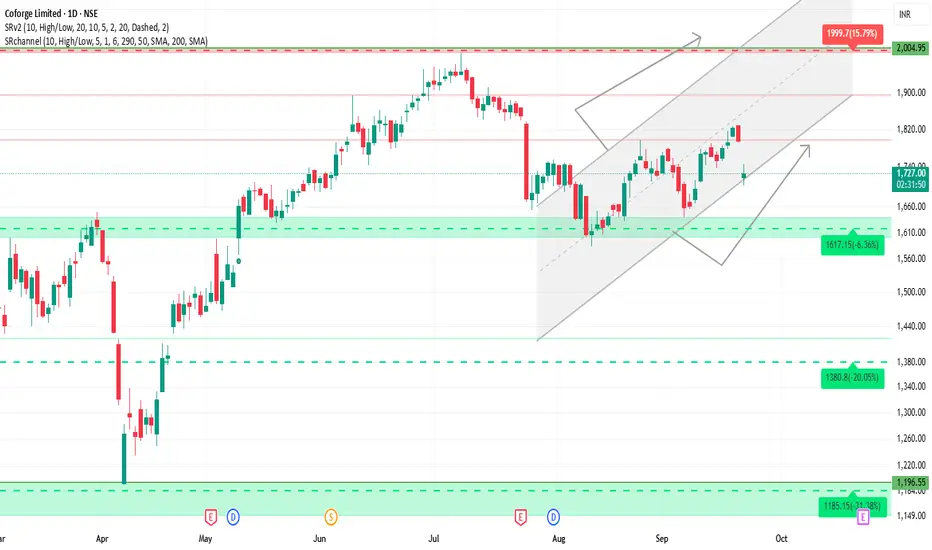
COFORGE 1D Time frame🔍 Current Price
Trading around ₹1,720 – ₹1,740
📊 Technical Indicators
Trend: Bearish — price trading below short and medium-term moving averages.
RSI (14): Around 26–27, showing oversold zone.
MACD: Negative, indicating bearish momentum.
ADX: Strong, meaning the downtrend has solid strength.
⚙️ Key Levels
Immediate Resistance 1: ₹1,780
Resistance 2: ₹1,820 – ₹1,840
Immediate Support 1: ₹1,700
Support 2: ₹1,650
Deeper Support: ₹1,620
🧮 Base Strategy
Long Setup:
Entry: Near ₹1,700 if reversal signals appear
Stop Loss: Below ₹1,650
Targets: ₹1,780 first, then ₹1,820+
Short Setup (Reversal):
If price fails near ₹1,780 zone
Targets: ₹1,700, then ₹1,650
Breakout Setup:
If price sustains above ₹1,820 – ₹1,840 with volume
Upside can extend toward higher levels
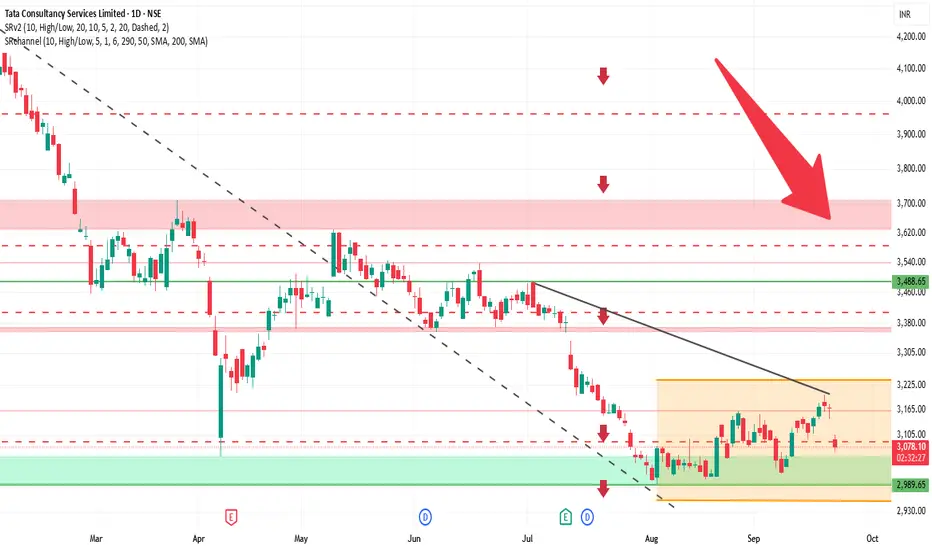
TCS 1D Time frame🔍 Current Price & Context
Trading around ₹3,089
Day’s range: ₹3,065 – ₹3,107
Previous close: ₹3,171
Market sentiment: Bearish, influenced by external factors affecting IT stocks.
📊 Technical Indicators
Moving Averages: Short-term averages are slightly above current price, acting as resistance.
RSI (14): ~30, indicating oversold conditions.
MACD: Negative, showing bearish momentum.
Stochastic Oscillator: Oversold, may suggest a short-term reversal.
CCI (20): Below zero, confirming bearish trend.
ROC (20): Negative, indicating declining momentum.
🧮 Strategy / Trade Ideas
Long Setup:
Entry near support (~3,050) if bullish reversal appears
Stop Loss: Below 3,000
Targets: 3,100 first, then 3,150
Short / Pullback Setup:
Entry if price fails near resistance (~3,100)
Stop Loss: Above 3,150
Targets: 3,050 first, then 3,000
✅ Summary
TCS on daily chart is bearish but oversold. Watch immediate support (~3,050) for potential reversal, and resistance (~3,100 – 3,120) for pullback risk. A breakout above resistance could target 3,150+, while failure of support may lead toward 3,000.
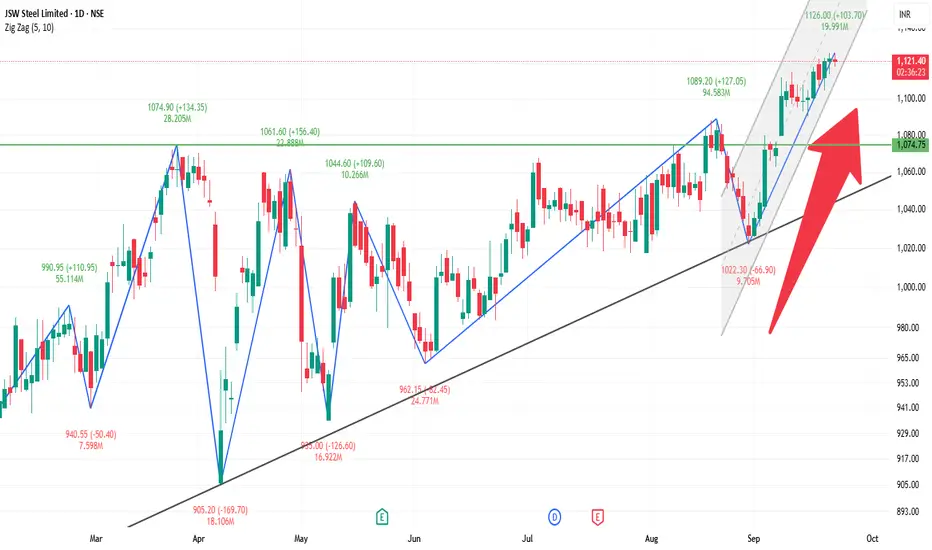
JSWSTEEL 1D Time frame🔍 Current Price
Trading around ₹1,119 – ₹1,120
⚙️ Key Levels (Daily)
Immediate Resistance 1: ₹1,125 – ₹1,130
Next Resistance 2: ₹1,133
Immediate Support 1: ₹1,116 – ₹1,117
Support 2: ₹1,110 – ₹1,113
Deeper Support (Positional): ₹1,072
🧮 Base Strategy Application
Long Setup:
Entry: Near current levels (~₹1,120) if it holds above ₹1,116
Stop Loss: Below ₹1,110
Targets: ₹1,125 – ₹1,130 (short-term), then ₹1,133
Short Setup (Reversal):
If rejection happens near ₹1,125 – ₹1,130 zone
Target: ₹1,116 first, then ₹1,110
Breakout Setup:
If price breaks and sustains above ₹1,133 with volume
Potential for further upside beyond recent highs
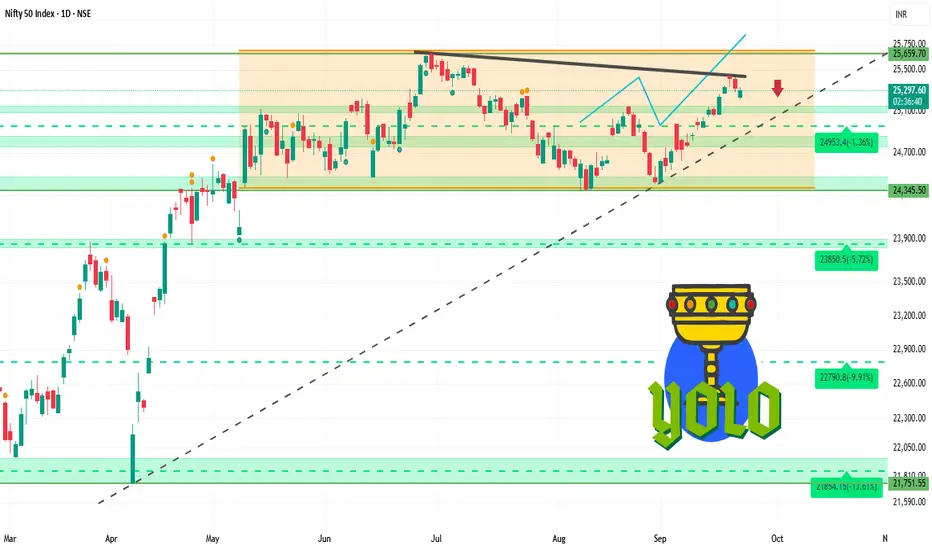
NIFTY 1D Time frame🔍 Current Market Snapshot
Current Level: ₹25,292.45
Day’s Range: ₹25,211.60 – ₹25,331.70
Previous Close: ₹25,327.05
Market Sentiment: Neutral to mildly bearish
📊 Technical Indicators
Moving Averages: The Nifty 50 index is trading slightly below its short-term moving averages, indicating potential resistance.
RSI (14): Approximately 50, suggesting a neutral stance with no clear overbought or oversold conditions.
MACD: Neutral, with the MACD line and signal line close together, indicating indecision in market momentum.
Stochastic Oscillator: Neutral, fluctuating around the midline, reflecting a lack of strong directional movement.
🧮 Strategy / Trade Ideas
Long Setup:
Entry: Consider entering near support levels (~₹25,200) if bullish reversal signals appear.
Stop Loss: Place below ₹24,800 to manage risk.
Target: First resistance around ₹25,400, then ₹25,700.
Short Setup:
Entry: If price fails to break above resistance (~₹25,400) and shows signs of reversal.
Stop Loss: Above ₹25,800.
Target: Downside toward ₹25,200, then ₹24,900.
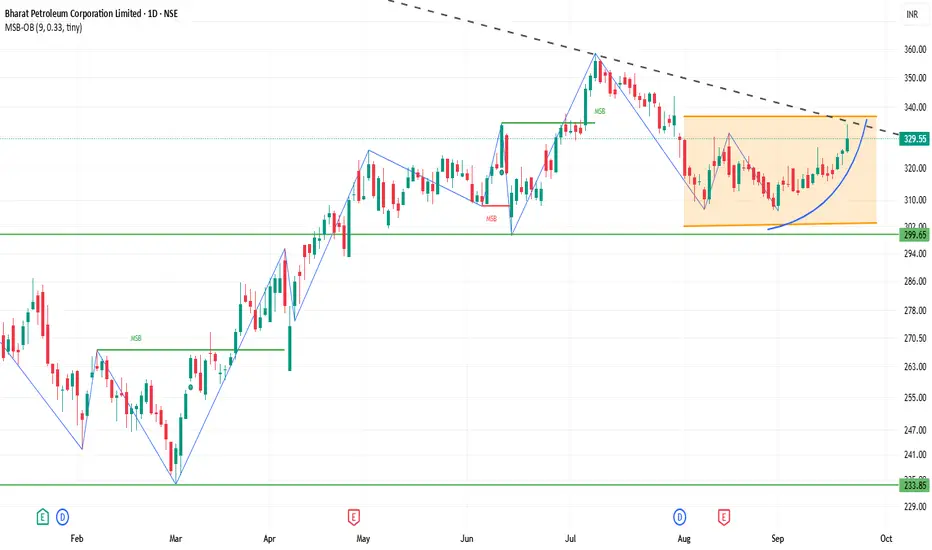
BPCL 1D Time frame📊 Current Snapshot
Closing Price: ₹329.55
Day's Range: ₹324.80 – ₹334.00
52-Week Range: ₹234.01 – ₹376.00
Market Capitalization: ₹1,42,975 Crores
Volume: Approximately 10 million shares traded
P/E Ratio: 8.14
Dividend Yield: 2.99%
⚙️ Technical Indicators
Relative Strength Index (RSI): 60.31 – Neutral to slightly bullish
Moving Average Convergence Divergence (MACD): 0.29 – Neutral
Moving Averages: Short-term averages (5, 10, 20, 50, 100, 200-day) are above the current price, indicating potential resistance.
Pivot Points: Central pivot around ₹322.30, suggesting a balanced market sentiment.
🎯 Possible Scenarios
Bullish Scenario: A breakout above ₹328.25 with strong volume could target ₹331.80 and higher levels.
Bearish Scenario: Failure to hold above ₹325.85 may lead to a decline toward ₹322.30.
⚠️ Key Considerations
Market Sentiment: BPCL has shown strong performance recently, but broader market conditions can impact its movement.
Volume Analysis: Watch for volume spikes to confirm breakout or breakdown signals.
Technical Indicators: While the RSI indicates a neutral to slightly bullish stance, the MACD and moving averages suggest caution.
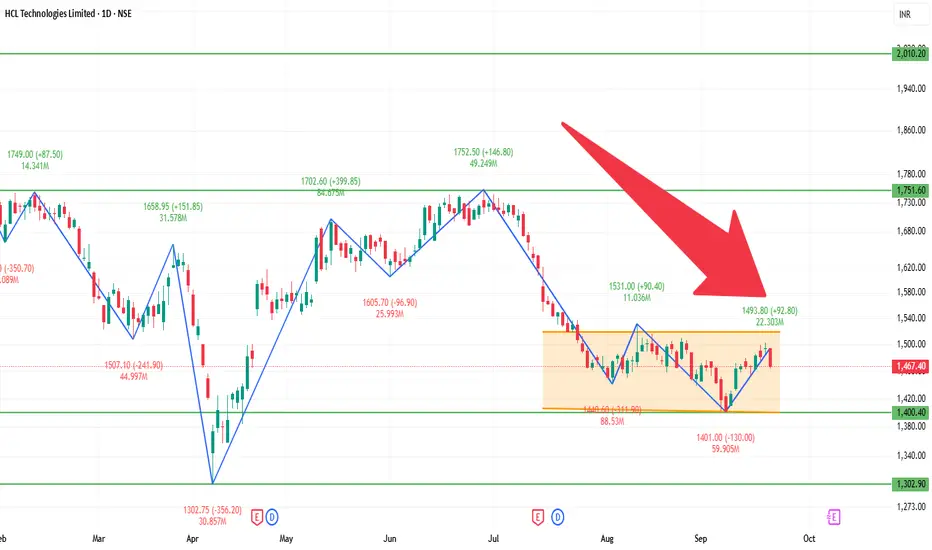
HCLTECH 1D Time frame📊 Current Overview
Price is trading near ₹1,460 – ₹1,470 range.
Trend on the daily chart is showing weakness.
Stock is trading below most key moving averages (50-day, 100-day, 200-day).
🔍 Support & Resistance
Immediate Support: ₹1,450
Next Support: ₹1,430 – ₹1,420
Immediate Resistance: ₹1,470 – ₹1,475
Higher Resistance: ₹1,490 – ₹1,500
📈 Indicators
RSI (14): Neutral to slightly bearish, around mid-40s.
MACD: Weak, showing bearish crossover or flat momentum.
Trend: More sideways to bearish unless resistance levels break.
🎯 Possible Scenarios
Bullish: If HCLTECH breaks and sustains above ₹1,475, it could target ₹1,490 – ₹1,500.
Bearish: If it fails and slips below ₹1,450, it may fall towards ₹1,430 – ₹1,420.