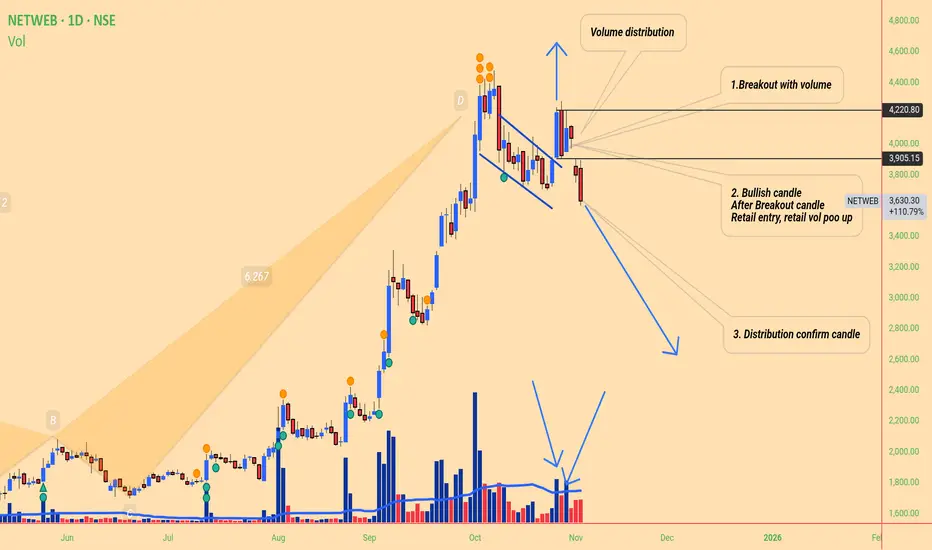
Netweb Volume distribution Technical -
Clear distribution chart , retail heavily trap show on volume, now that area work as
Trap resistance,
3 step distribution happened
1st, break out base ( Trending stock on social media ai hot sector)
2nd break out time volume that attracts retails
3nd after institute sell to retail , clear sign ( small candle show high buyer sellers active)
& Last distribution confirm low volume big red candle ( no one like to purchase that why vol big body candle confirm distribution sign)
Also harmonic pattern type 2 crab( historical pattern)
Fundamentals -
Stock trading 8 time peg ratio , 1 pEG ratio is consider fair but here it 8X
Also compared to us stock like nvidia, this stock overpriced
Also result declared that show poor
Maybe this thing tell stock created top here.......
How volume distribution looklike:
NETWEB
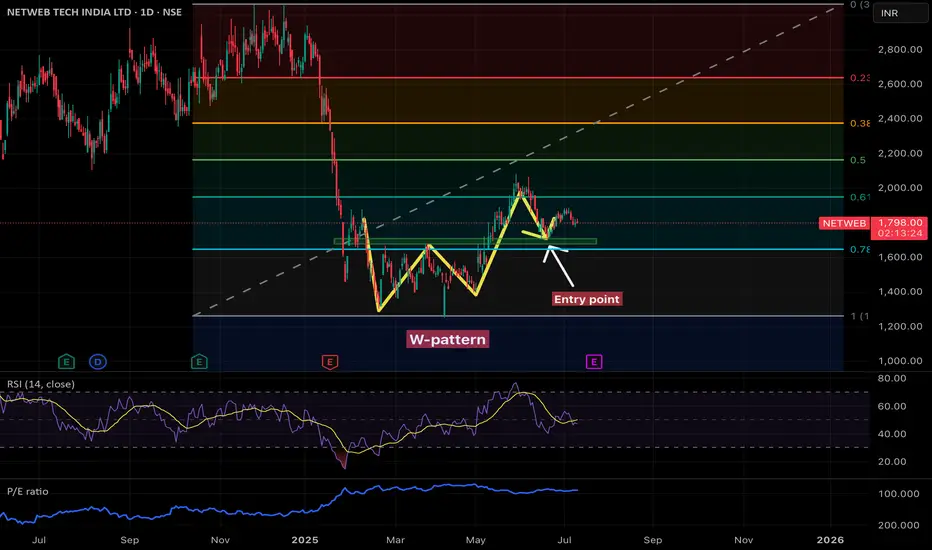
Technical analysis of the NETWEB TECH INDIA LTD (NSE)🧩 Chart Type: Daily (1D)
🔍 Pattern Observed: W-Pattern (Double Bottom)
• The W-pattern (double bottom) is a bullish reversal pattern.
• It indicates that the stock found strong support at a similar price level twice, suggesting potential accumulation.
• Breakout occurred after the second bottom, which was followed by a rally.
🎯 Key Technical Elements:
✅ Entry Point:
• Clearly marked just after the breakout from the neckline of the W-pattern.
• This aligns with a previous resistance level turning into support — a classic bullish confirmation.
• The green zone shows a support area, acting as a cushion for price retracement.
📏 Fibonacci Retracement Levels:
• Levels shown range from 0 to 1 (bottom to top of the recent trend).
• Price is hovering near the 0.618 Fibonacci level, a key retracement support (often termed the “golden ratio”).
• Below 0.618 lies the 0.786 level, which aligns with the marked support area — critical zone to watch for bulls.
📉 Indicators:
🔵 RSI (Relative Strength Index - 14):
• Currently in the neutral zone (~40-50) — neither overbought nor oversold.
• RSI previously bounced from oversold levels during W-pattern formation.
• No bullish divergence noted currently, but a bounce from 40 RSI could trigger a buying signal.
📘 P/E Ratio (Blue Line):
• Remains relatively steady after a spike — valuation seems to have normalized.
• Watch for any sharp moves that deviate from price action.
📌 Support and Resistance:
• Support:
• 1,700–1,750 INR (green zone, 0.786 level, neckline retest)
Resistance:
• ~1,950 INR (0.618 Fibonacci level)
• ~2,200 INR (0.5 Fibonacci level)
⚠️ Risk Factors:
• If price closes below the 0.786 retracement zone, W-pattern may fail.
• Volume data isn’t shown in detail, so confirmation on breakout strength is missing.
• A break below 1,650 INR could trigger stop-losses and invalidate the pattern.
✅ Conclusion:
• Bullish bias remains intact as long as price holds above the neckline and Fibonacci support.
• Entry near the support zone (green box) offers a favorable risk-to-reward ratio.
• Target levels: 1,950, 2,200, and possibly 2,400+ INR on trend continuation.
• Keep RSI and price action in sync for re-entry or exit signals.
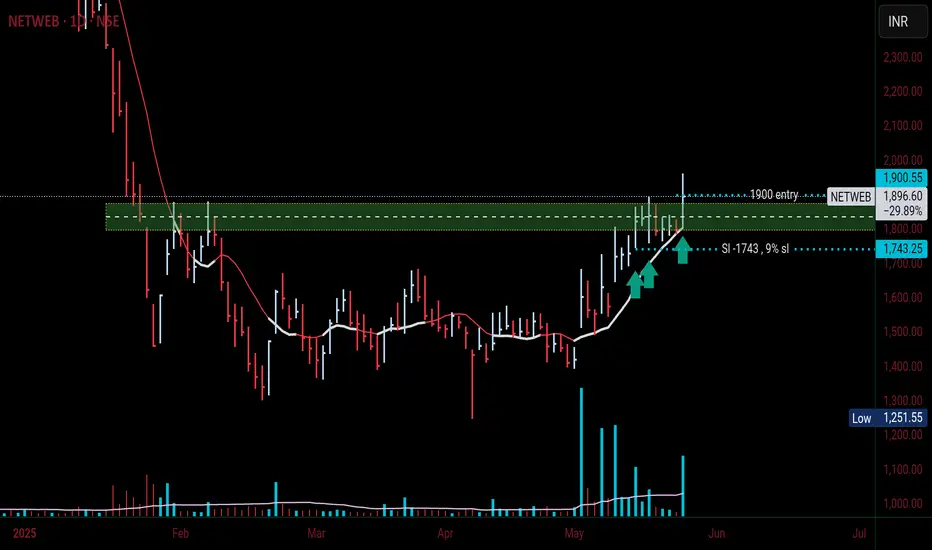
NetwebGood volume ✓
Tight range ✓
Break out with volume ✓
Previous buyer respected ✓
9 % sl why here put my sl , because previous buyer seen here. Target 20% half book half trailing with sma10
Why i consider this?
- it break out previous resistance
- it respected previous buyer candle
Yah, that it
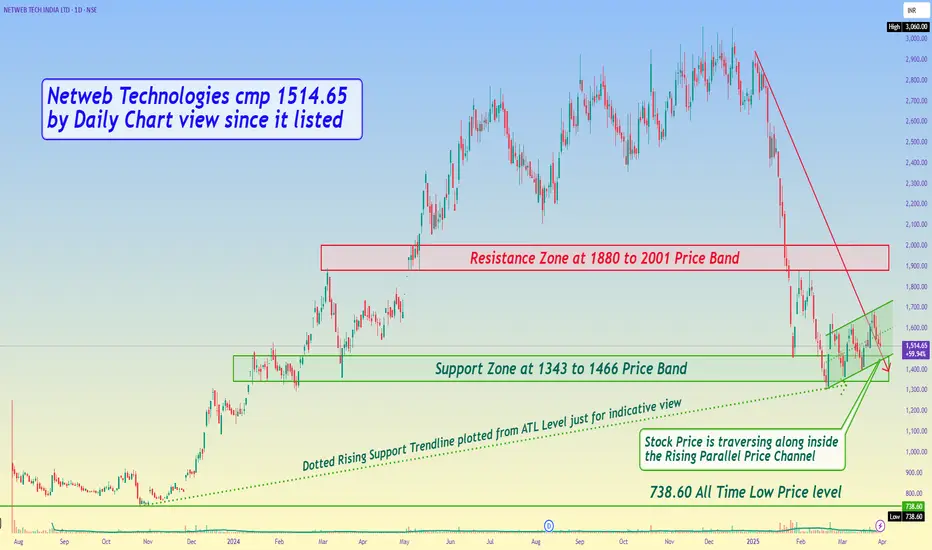
Netweb Technologies cmp 1514.65 by Daily Chart view since it lisNetweb Technologies cmp 1514.65 by Daily Chart view since it listed
- Support Zone at 1343 to 1466 Price Band
- Resistance Zone at 1880 to 2001 Price Band
- Stock Price is traversing along inside the Rising Parallel Price Channel
- Dotted Rising Support Trendline plotted from ATL Level just for indicative view
Netweb Technologies - Nearing breakout zone on weekly chartOn weekly chart, Netweb Technologies is nearing its breakout zone.
A cup pattern followed by a base consolidation with higher lows makes it an ideal stock to keep in your watchlist.
Buy zone: 2925-3050
Stop loss: 5-8% basis one's risk management.
Initial target: 3500-3600
Note: Not a buy/sell recommendation. Please consult your financial advisor.

Symmetrical Triangle Breakout - NETWEB📊 Script: NETWEB
📊 Sector: IT - Software
📊 Industry: Computers - Software - Medium / Small
Key highlights: 💡⚡
📈 Script is giving Symmetrical Triangle Breakout on 18th April but there was no rally todays candle is giving breakout of that little consolidation so we may see some good rally.
📈 Script is trading at upper band of BB.
📈 MACD & Double Moving Averages are giving crossover .
📈 Right now RSI is around 61.
📈 One can go for Swing Trade.
⏱️ C.M.P 📑💰- 1730
🟢 Target 🎯🏆 - 1890
⚠️ Stoploss ☠️🚫 - 1664
⚠️ Important: Always maintain your Risk & Reward Ratio.
✅Like and follow to never miss a new idea!✅
Disclaimer: I am not SEBI Registered Advisor. My posts are purely for training and educational purposes.
Eat🍜 Sleep😴 TradingView📈 Repeat 🔁
Happy learning with trading. Cheers!🥂

Netweb technologies setup for intradayHey guys here is the setup Netweb technologies setup for intraday, with helping with key levels of support and resistance.
