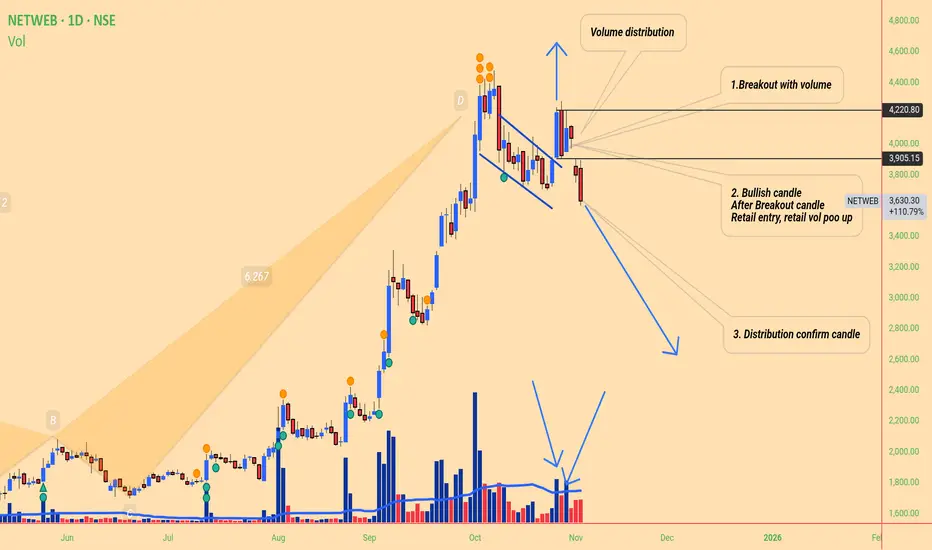
Netweb Volume distribution Technical -
Clear distribution chart , retail heavily trap show on volume, now that area work as
Trap resistance,
3 step distribution happened
1st, break out base ( Trending stock on social media ai hot sector)
2nd break out time volume that attracts retails
3nd after institute sell to retail , clear sign ( small candle show high buyer sellers active)
& Last distribution confirm low volume big red candle ( no one like to purchase that why vol big body candle confirm distribution sign)
Also harmonic pattern type 2 crab( historical pattern)
Fundamentals -
Stock trading 8 time peg ratio , 1 pEG ratio is consider fair but here it 8X
Also compared to us stock like nvidia, this stock overpriced
Also result declared that show poor
Maybe this thing tell stock created top here.......
How volume distribution looklike:
Netwebtechnologies
NETWEB TECH: Reversal Play with 50% Upside potential⚡️Price Analysis:
1️⃣ Price showing strength.
2️⃣ Price structure is bullish.
3️⃣ Good momentum is expected
✨ Key Observations:
➡️ RRR favorable at CMP.
➡️ Price bouncing from support zone
⚠️ Disclaimer: This is NOT a buy/sell recommendation. This post is meant for learning purposes only. Views are personal. Please, do your due diligence before investing.⚠️
💬 Share your thoughts in the comments below! ✌️
🔥 Trade Safe! ✅ 🚀
NETWEB: AI Infrastructure Goldmine ? Chart of the MonthNSE:NETWEB MarchingTowards 4,000: Is This the AI Infrastructure Goldmine You've Been Waiting For? Let's analyze in the "Chart of the Month".
As per the Latest SEBI Mandate, this isn't a Trading/Investment RECOMMENDATION nor for Educational Purposes; it is just for Informational purposes only. The chart data used is 3 Months old, as Showing Live Chart Data is not allowed according to the New SEBI Mandate.
Disclaimer: "I am not a SEBI REGISTERED RESEARCH ANALYST AND INVESTMENT ADVISER."
This analysis is intended solely for informational purposes and should not be interpreted as financial advice. It is advisable to consult a qualified financial advisor or conduct thorough research before making investment decisions.
Price Action Analysis:
- Current Price: ₹3,695.40
- 52-Week Range: ₹738.60 - ₹3,745.00
- Recent Performance: +64% gain in a Month with strong momentum
- Price structure shows consistently higher highs and higher lows pattern
- Stock has demonstrated remarkable resilience with a 380% rally from its 52-week low
Volume Spread Analysis:
- Volume surge visible during recent breakout phases
- High volume of 24.25M shares traded, indicating institutional participation
- Volume expansion coinciding with price breakouts confirms genuine buying interest
- Strong volume accumulation during consolidation phases suggests smart money positioning
Chart Patterns Identified:
- Symmetrical Triangle Breakout: Successfully broken above the triangle pattern
- Ascending Triangle: Multiple resistance tests followed by decisive breakout
- Flag and Pennant Patterns: Short-term consolidation after sharp moves
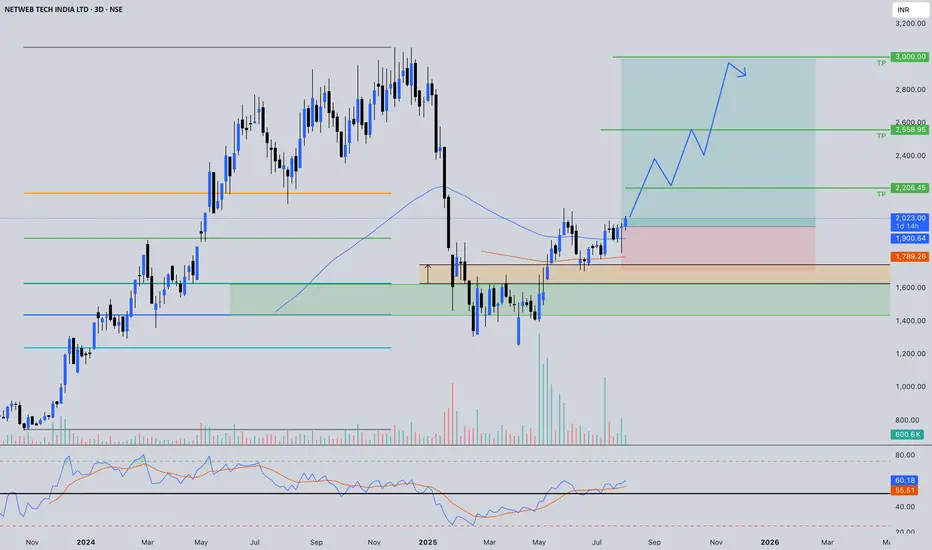
Key Technical Levels:
Support Levels:
- Immediate Support: ₹3,200 (recent consolidation zone)
- Strong Support: ₹2,800 (previous resistance turned support)
- Major Support: ₹2,400 (trendline support and psychological level)
- Critical Support: ₹2,000 (long-term ascending trendline)
Resistance Levels:
- Immediate Resistance: ₹3,745 (52-week high)
- Next Resistance: ₹4,000 (psychological round number)
- Extended Resistance: ₹4,400 (measured move projection)
- Long-term Resistance: ₹5,000
Base Formation:
- Primary Base: ₹1,200-₹1,600 range (established during deep consolidation)
- Secondary Base: ₹2,400-₹2,800 range (recent re-accumulation zone)
- The stock has clearly established a strong foundation above the ₹2,400 levels
Technical Indicators Assessment:
Momentum Indicators:
- RSI is in overbought territory but showing positive divergence
- MACD showing bullish crossover with expanding histogram
- Stochastic indicates strong upward momentum
- ADX suggesting strong trending behaviour
Moving Averages:
- Price trading well above all major moving averages
- 20 EMA, 50 EMA, and 200 EMA in perfect bullish alignment
- Strong uptrend confirmed by ascending moving averages
- No signs of trend reversal in the near term
Sectoral and Fundamental Backdrop:
AI Infrastructure Sector Outlook:
- India's IndiaAI Mission with ₹10,372 crore budget creating massive opportunities
- Government's push for sovereign AI infrastructure benefiting domestic players
- Global demand for AI computing infrastructure is experiencing exponential growth
- Limited domestic competition in the high-end computing solutions space
Company-Specific Fundamentals:
- Netweb's supercomputers have appeared 15 times across three entries in the global Top 500 supercomputers ranking
- The company is almost debt-free with a market cap of ₹20,936 crore
- Recent order wins worth ₹1,734 crore for IndiaAI Mission and ₹450 crore additional order
- Order pipeline of ₹4,142.1 crore as of June 2025, excluding new mandates
Key Growth Catalysts:
- Delivery of servers built on NVIDIA's Blackwell Architecture for India's Sovereign AI System
- Expanding presence in high-performance computing and AI systems
- Strong relationships with global technology partners
- Beneficiary of the government's Digital India and AI initiatives
Financial Performance Metrics:
- Strong revenue visibility from a large order book
- Improving profit margins due to premium product offerings
- Healthy cash flows supporting future expansion
- Zero debt structure providing financial flexibility
Strategic Outlook:
- Expect continued momentum driven by the AI infrastructure theme
- News-driven volatility possible around order execution updates
- Sector rotation into a technology infrastructure play is expected
- Quarterly results will be the key catalyst for sustained momentum
- India's AI infrastructure buildout is a multi-year opportunity
- The company is well-positioned to capture significant market share
Risk Factors to Monitor:
Technical Risks:
- Overbought conditions may lead to profit-taking
- High volatility expected given the stock's momentum
- Any break below ₹3,000 would signal trend weakness
Fundamental Risks:
- Execution risk on large government orders
- Competition from global players in AI infrastructure
- Technology disruption risks in a rapidly evolving sector
- Dependence on government spending cycles
Market Risks:
- Overall market correction could impact high-beta stocks
- Sector rotation away from technology themes
- Global supply chain disruptions affecting component availability
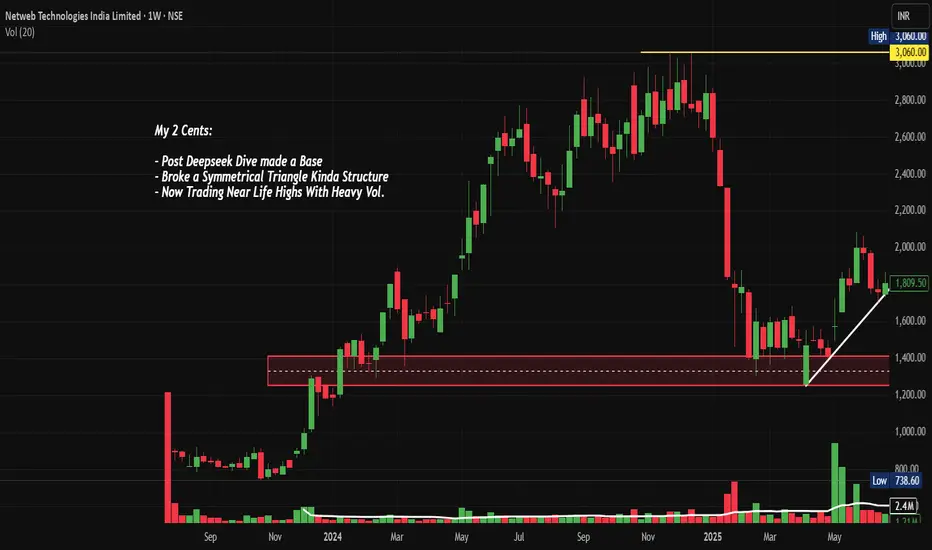
My 2 Cents:
NSE:NETWEB presents a compelling technical setup with strong fundamental support from India's push for AI infrastructure. The stock's breakout from multiple chart patterns, combined with substantial order wins and sector tailwinds, creates an attractive risk-reward proposition. However, position sizing and disciplined risk management remain crucial given the stock's high volatility and premium valuation.
Full Coverage on my Newsletter this Week
Keep in the Watchlist and DOYR.
NO RECO. For Buy/Sell.
📌Thank you for exploring my idea! I hope you found it valuable.
🙏FOLLOW for more
👍BOOST if you found it useful.
✍️COMMENT below with your views.
Meanwhile, check out my other stock ideas on the right side until this trade is activated. I would love your feedback.
As per the Latest SEBI Mandate, this isn't a Trading/Investment RECOMMENDATION nor for Educational Purposes; it is just for Informational purposes only. The chart data used is 3 Months old, as Showing Live Chart Data is not allowed according to the New SEBI Mandate.
Disclaimer: "I am not a SEBI REGISTERED RESEARCH ANALYST AND INVESTMENT ADVISER."
This analysis is intended solely for informational purposes and should not be interpreted as financial advice. It is advisable to consult a qualified financial advisor or conduct thorough research before making investment decisions.
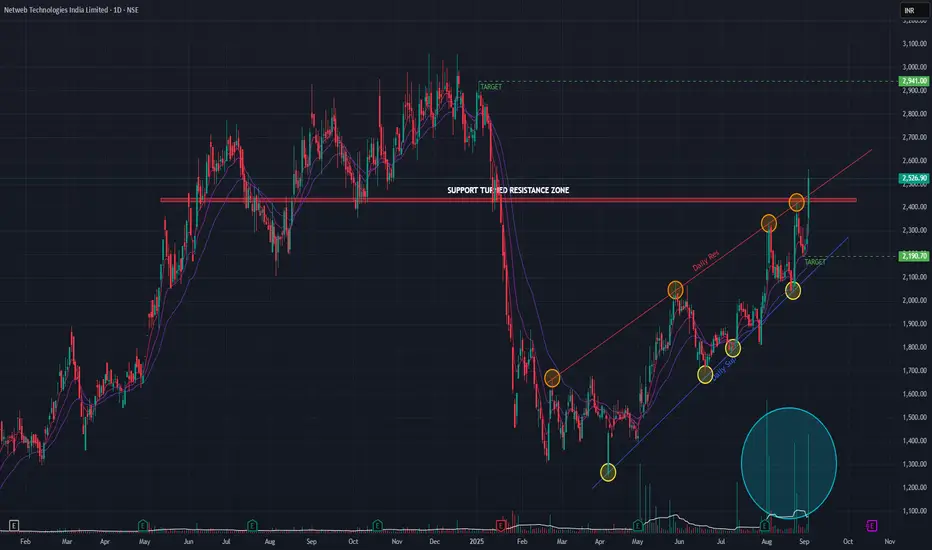
Netweb Tech (Daily Timeframe) - bullish signs ??Netweb has been on an uptrend since Feb 2025 and today it breached a key support turned resistance zone with huge volume. With a +11.48% gain combined with huge volume, the stock also breached the angular resistance trendline as indicated. Short-term EMAs are in positive cross-over state indicating bullish signs.
The recent quarter earnings are also positive for the stock.
If the uptrend momentum continues, then we may see the stock go upto 2940 range. On the downside it may go to 2190 range. The price action on the coming days would be key.
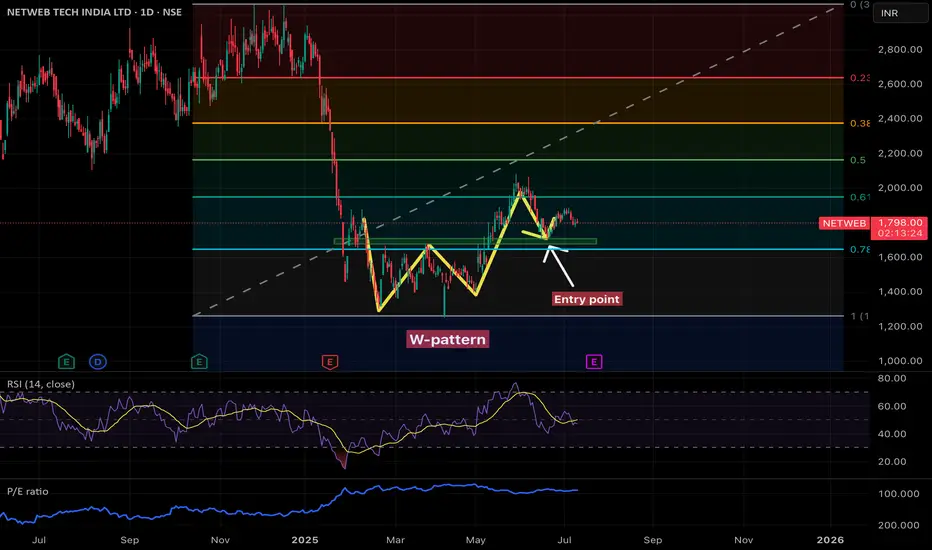
Technical analysis of the NETWEB TECH INDIA LTD (NSE)🧩 Chart Type: Daily (1D)
🔍 Pattern Observed: W-Pattern (Double Bottom)
• The W-pattern (double bottom) is a bullish reversal pattern.
• It indicates that the stock found strong support at a similar price level twice, suggesting potential accumulation.
• Breakout occurred after the second bottom, which was followed by a rally.
🎯 Key Technical Elements:
✅ Entry Point:
• Clearly marked just after the breakout from the neckline of the W-pattern.
• This aligns with a previous resistance level turning into support — a classic bullish confirmation.
• The green zone shows a support area, acting as a cushion for price retracement.
📏 Fibonacci Retracement Levels:
• Levels shown range from 0 to 1 (bottom to top of the recent trend).
• Price is hovering near the 0.618 Fibonacci level, a key retracement support (often termed the “golden ratio”).
• Below 0.618 lies the 0.786 level, which aligns with the marked support area — critical zone to watch for bulls.
📉 Indicators:
🔵 RSI (Relative Strength Index - 14):
• Currently in the neutral zone (~40-50) — neither overbought nor oversold.
• RSI previously bounced from oversold levels during W-pattern formation.
• No bullish divergence noted currently, but a bounce from 40 RSI could trigger a buying signal.
📘 P/E Ratio (Blue Line):
• Remains relatively steady after a spike — valuation seems to have normalized.
• Watch for any sharp moves that deviate from price action.
📌 Support and Resistance:
• Support:
• 1,700–1,750 INR (green zone, 0.786 level, neckline retest)
Resistance:
• ~1,950 INR (0.618 Fibonacci level)
• ~2,200 INR (0.5 Fibonacci level)
⚠️ Risk Factors:
• If price closes below the 0.786 retracement zone, W-pattern may fail.
• Volume data isn’t shown in detail, so confirmation on breakout strength is missing.
• A break below 1,650 INR could trigger stop-losses and invalidate the pattern.
✅ Conclusion:
• Bullish bias remains intact as long as price holds above the neckline and Fibonacci support.
• Entry near the support zone (green box) offers a favorable risk-to-reward ratio.
• Target levels: 1,950, 2,200, and possibly 2,400+ INR on trend continuation.
• Keep RSI and price action in sync for re-entry or exit signals.
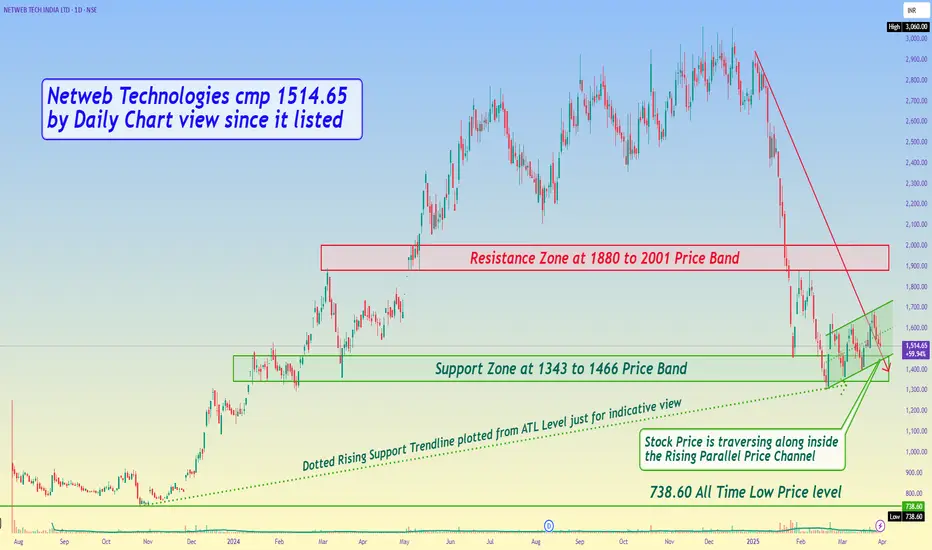
Netweb Technologies cmp 1514.65 by Daily Chart view since it lisNetweb Technologies cmp 1514.65 by Daily Chart view since it listed
- Support Zone at 1343 to 1466 Price Band
- Resistance Zone at 1880 to 2001 Price Band
- Stock Price is traversing along inside the Rising Parallel Price Channel
- Dotted Rising Support Trendline plotted from ATL Level just for indicative view