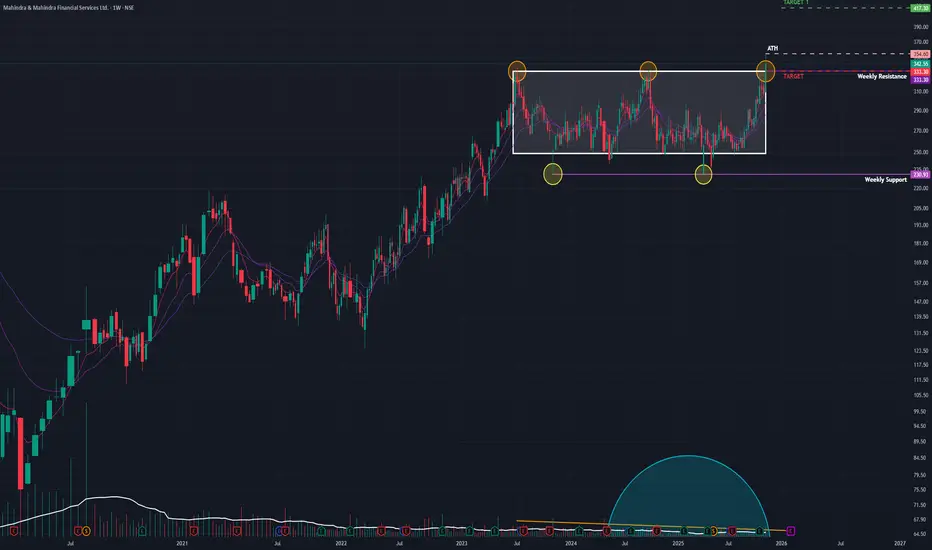
M&M Fin (W): Bullish, Breakout with Short-Term Rejection(Timeframe: Weekly | Scale: Logarithmic)
The stock has confirmed a major multi-year breakout, moving into "Blue Sky" territory. However, the daily price action suggests a temporary pullback (re-test) is imminent before the uptrend resumes.
📈 1. The Breakout Structure (The "Big Picture")
- The Setup: The stock has been trapped in a consolidation phase since its July 2023 peak. The ₹330–₹335 zone acted as a rigid "ceiling" for over two years.
- The Breakout: The week of Nov 17 was decisive. The stock surged 10.98% , closing above this multi-year resistance for the first time.
- Volume: The move was backed by 29.74 Million in volume —a significant expansion compared to the "dry" consolidation phase, confirming institutional participation.
🕯️ 2. The "Shooting Star" Warning (Daily Chart)
- The Pattern: The last daily candle (Friday) formed a Shooting Star . It opened high, rallied to a new peak (~₹354), but faced heavy selling pressure to close near the lows (~₹342).
- Implication: This "long upper wick" shows that sellers are aggressively defending the ₹350+ level. It strongly suggests that the breakout is "tired" and a re-test of the breakout zone is likely next week.
🚀 3. The Fundamental Catalyst (The "Why")
This technical move is supported by strong fundamentals, which adds confidence to the long-term bullish view:
- Earnings: The breakout is a delayed reaction to strong Q2 FY26 results, where Net Profit surged ~54% YoY and asset quality improved.
- Outlook: This fundamental strength suggests that any dip (re-test) will likely be bought by smart money.
📊 4. Indicators & Trend
- RSI & EMAs: RSI is rising (bullish momentum) and EMAs are in PCO state (trend alignment) across Monthly and Weekly charts. This confirms the primary trend is UP.
🎯 5. Future Scenarios & Key Levels
The "Shooting Star" dictates the immediate game plan: Wait for the Re-test.
🐂 The Bullish Case (Buy the Dip)
- The Strategy: Watch for the stock to pull back to the ₹333 – ₹335 zone (the resistance-turned-support).
- Confirmation: If the price stabilizes or forms a bullish candle (like a Hammer) at this level, it is a high-probability entry.
- Target 1: ₹417
- Target 2: ₹475
🐻 The Failure Case (Fakeout)
- Trigger: If the selling pressure from the Shooting Star intensifies and the stock closes back below ₹333.
- Consequence: This would confirm a "fakeout" (bull trap), and the stock could slide back toward the consolidation midpoint around ₹300.
Conclusion
The breakout is genuine, but the Shooting Star signals a short-term pause. The ideal approach is to wait for the re-test at ₹335 to confirm that the "ceiling" has truly become a "floor."
Newalltimehigh
Thyrocare (W): Strongly Bullish, Multi-Year BreakoutBased on Weekly Timeframe, Logarithmic Scale
This is a textbook, high-conviction breakout. The stock has decisively broken a 4-year consolidation, backed by strong fundamentals and a powerful confluence of high-timeframe technical indicators.
📈 1. The Multi-Year Setup
- The 2021 Peak: After its ATH in June 2021 (at ~₹1,465 ), the stock entered a steep, 2-year downtrend.
- The 2023 Bottom: This trend found its bottom in March 2023 .
- The Recovery & Base: Since then, the stock has been in a 2.5-year recovery, building a massive base. This upward move was further halted by the horizontal resistance at the ₹1,465 level, which it failed to break on previous attempts.
🚀 2. The Fundamentally-Driven Breakout (Last Week)
Last week, this entire 4-year pattern changed:
- The Catalyst: Strong Q2 2026 earnings provided the "fuel" for a major move.
- The Surge: The stock surged +12.43% for the week.
- The Volume: This move was backed by a 3.45 Million share volume spike. This comes after a period of average volume, confirming institutional interest.
- The Close: The stock achieved a weekly close above ₹1,465 , confirming the breakout is not just an intraday spike.
📊 3. Confluence of Bullish Indicators
The alignment on high timeframes is exceptionally bullish:
- RSI: The Relative Strength Index is rising on both the Monthly and Weekly charts.
- EMAs: The short-term Exponential Moving Averages are in a "PCO" (Price Crossover) state on both the Monthly and Weekly charts.
- Volume: A clear spike on the breakout after a steady rise, confirming the move's validity.
🎯 4. Future Scenarios & Key Levels to Watch
🐂 The Bullish Case (Continuation)
- Trigger: If the bullish momentum continues, the stock is in a new "blue-sky" uptrend.
- Target: The next logical long-term price target is at ₹2,000 levels.
🐻 The Pullback Case (Healthy Re-test)
- Trigger: If the stock pauses to digest its 12.5% weekly gain or if the broader market pulls back.
- Support: The price would likely fall to re-test the resistance-turned-support level at ₹1,465 . A "bounce" off this level would be a classic, healthy confirmation of the breakout and an ideal entry point for those who missed the initial surge.

Ashok Leyland (D): Strongly Bullish, Blue-Sky BreakoutThis is a high-conviction, fundamentally-driven breakout. After a volatile re-test, the stock has confirmed its breakout above a key consolidation zone and is now in a "price discovery" phase, backed by exceptional volume and strong earnings.
🚀 1. The Fundamental Catalyst (The "Why")
The explosive move this week is powered by a strong Q2 2026 earnings report (announced Nov 12). The positive results and dividend declaration provided the high-conviction "fuel" for the market to absorb the failed re-test and drive the stock to a new all-time high.
📈 2. The Decisive Breakout (The "Whipsaw")
- Part 1 (The Breakout): On Nov 11 , the stock broke above the horizontal resistance from Sep 2025 (at the ₹144-₹146 level).
- Part 2 (The "Fakeout"): On Nov 12 , the stock failed its re-test, closing below this new support. This move likely trapped bearish traders.
- Part 3 (The Confirmation): Today, Nov 13 , the stock gapped up (opening above the resistance) and surged +5.53% on massive 53.62 Million volume. This powerful move creates a new all-time high and confirms the breakout is real.
📊 3. Confluence of Bullish Indicators
- Volume: The consolidation phase had below-average volume. Today's 53M+ share volume is a massive spike, confirming institutional participation.
- RSI: The Relative Strength Index is rising on the Daily, Weekly, and Monthly charts .
- EMAs: The short-term Exponential Moving Averages are in a "PCO" (Price Crossover) state on all three timeframes .
This alignment of all three timeframes, combined with the fundamental catalyst, gives this breakout a very high probability of success.
🎯 4. Future Scenarios & Key Levels to Watch
The stock is now in a "price discovery" trend.
🐂 The Bullish Case (Momentum Continues)
- Trigger: The stock is in a new uptrend with no overhead resistance.
- Target: ₹161 is the first logical objective.
🐻 The Pullback Case (Support Test)
- Trigger: If the stock pauses to digest its 5.5% single-day gain.
- Support: The price would likely fall to re-test the resistance-turned-support at ₹144 . A "bounce" off this level would be a textbook confirmation of the new support floor and an ideal entry point for those who missed the initial surge.

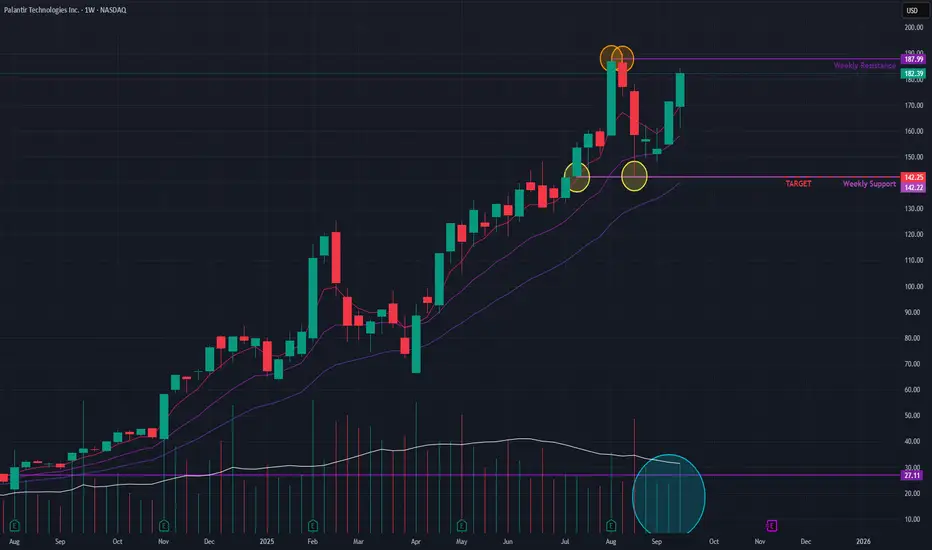
Palantir (Weekly) - Consolidation Near All-Time HighAfter reaching a new All-Time High (ATH) in recent weeks, Palantir has entered a period of consolidation. The stock has since been trading in a sideways range, struggling to break past the newly established resistance level.
Emerging Bullish Signals 👍
Despite the sideways movement, several indicators suggest that buyers are showing renewed interest:
- Momentum: Short-term Exponential Moving Averages (EMAs) have formed a positive crossover , a technical signal indicating that upward momentum is building.
- Volume: Trading volume has been noticeably increasing , which suggests growing accumulation and buyer interest at the current price levels.
Future Outlook and Key Price Levels
The stock is currently positioned for a potential move, with two clear scenarios:
- Bullish Case 📈: A decisive breakout above the short-term horizontal resistance would signal a continuation of the uptrend. If this occurs, the next potential price target could be USD 234 .
- Bearish Case 📉: If the stock fails to overcome the resistance and momentum fades, it may decline to the lower boundary of its consolidation range, with a potential support level near USD 142 .
Watchout for the next moves !!
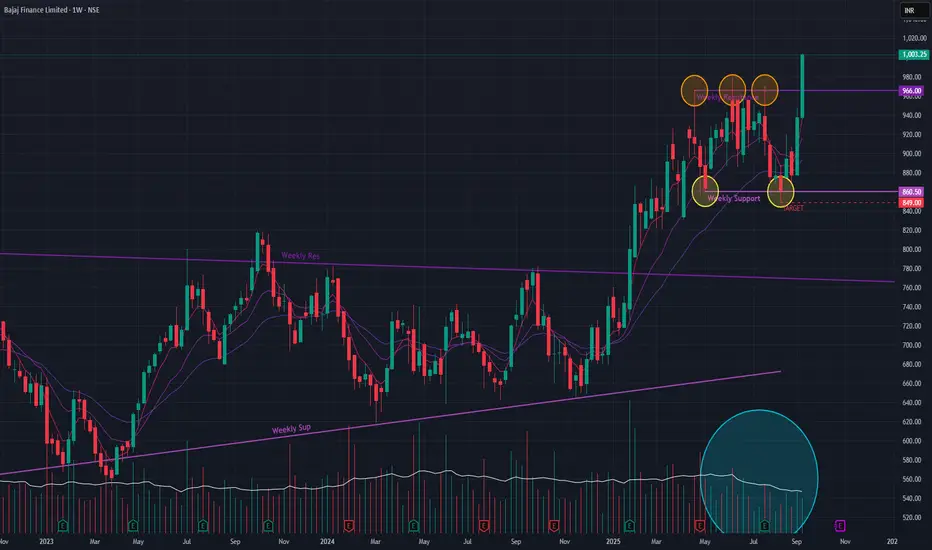
Bajaj Finance (Weekly Timeframe) - Making new ATHAfter a multi-month sideways consolidation from April to September 2025, Bajaj Finance has signaled a potential resumption of its primary uptrend. This recent price action mirrors a similar pattern seen from October 2021 to January 2025, which was followed by a powerful rally to new all-time highs.
## Recent Bullish Developments 📈
Pattern Breakout: The stock decisively broke out of its recent sideways range last week, surging +7% on strong volume & a new ATH. This move indicates a shift from balance to imbalance, with buyers taking firm control.
Sustained Momentum: The buying pressure has continued, resulting in a rally of over 14% in the past two weeks.
Technical Confirmation: The short-term Exponential Moving Averages (EMAs) are in a Positive Crossover (PCO) state, a classic bullish indicator that supports the case for continued upward momentum.
## Outlook and Key Levels
The breakout suggests that the stock is poised to challenge its previous highs.
Upside Potential: If the current momentum is sustained, the next logical price target in the near term is the ₹1,077 level.
Downside Risk: Should the breakout fail and momentum wane, the stock could pull back to test the support zone around ₹849 .
The key factor to watch is trading volume. While the initial breakout volume was good, sustained buying interest is needed to fuel the next leg of the rally.
INDHOTEL- 5th Wave Candidate heading for 360+++Attached: INDHOTEL Daily Live Market Chart as of 26th April 2023
An Ending Diagonal in Wave 4 marked as ABCDE and then Price has been moving Up since then, close to its All Time High
Look at Peer Hotel Stocks, they are also making New 52 Week Highs and Breaking Out so Indian Hotels too should follow the Hotel Sector in its journey up
Upside Target:
north of 360
and then take Reverse Fib Level of 4th Wave:
1.272
1.382
1.5
1.618

Solana About to get new All Time Highs.#-The Analysis is based on personal Knowledge of technical analysis , Please Do Not Take It as a Financial Advice, And Always Do Your Own Research.
#1 Solana Just Gained New ATH 219.05 $.
#2 Solana Is now moving in an ascending parallel channel.
#3 Three Important Supports are:-
Support 1 = Around 152 $
Support 2 = Around 180 $
Support 3( Or may be resistance in future) = Around 187 $
ATH ( High Resistance Zone) = 219.05 $
## Technical analysis:
. SOLUSDT is in an Ascending Parallel Channel .
. The price is above the 50 Ema and It is also Acting as a strong Support.
1. Retesting on Point A is very Important At Support 3.
2. Support 3 Is already Strong ( Also it was Surpassed with a large volume).
3. All Time High is a high resistance zone so we may see a pullback from 219.05$ And then we have to see How Chart Goes on.
4. High Chances are it ATH is broken with large volume then it will retest At Point C. And If Retesting Is successful, We can go for long.
5. The vertical width between first touch on upper trend line and first touch of lower trend line is around 66.53 $ ( Almost 35%) That means
We can take Minimum 35% profit if rally starts at Point C.
Take Profits:
TP1= @ Around 240 $
TP2= @ Around 260 $
TP3= @ Around 300 $ ( Around 35%, Main Target)
*Buy Zone 220-230 $, Stop Loss AT 205 $.
If You Loved This Analysis ❤️ Hit the LIKE button
Drop some feedback below in the comment !
Trade well. ❤️

Amara Raja Batteries-Will it cross Weekly and Monthly resistanceAmara Raja Batteries is currently trading in a crucial level. It may give a good break out which will take it into the sky. Closing above 770 will give it a fire which will take this stock till 840 within next week making a new all time high.
Keep your eyes on this and go with the trend to mint money.
Buy between 770-775 level for target of 840 with 755 as stop loss.
