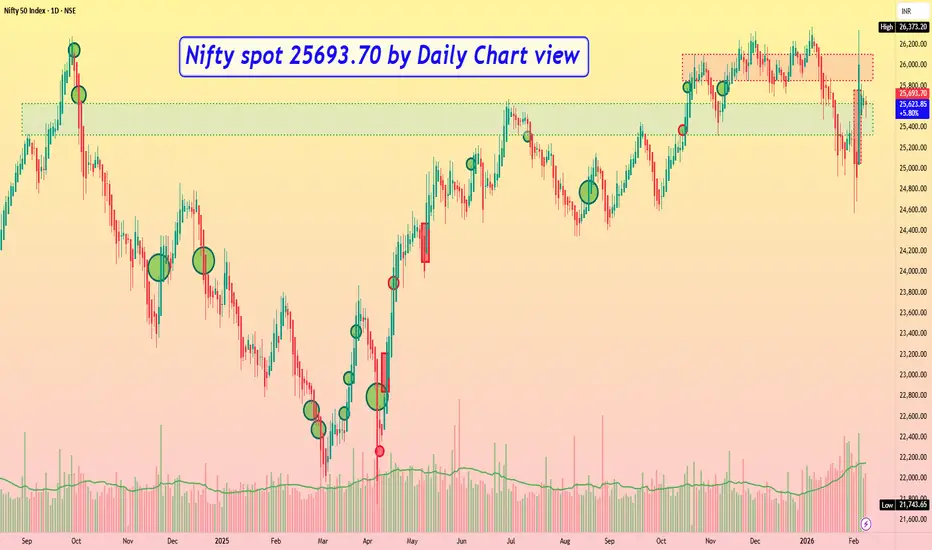
Nifty spot 25693.70 by Daily Chart view - Weekly UpdateNifty spot 25693.70 by Daily Chart view - Weekly Update
- Support Zone 25325 to 25625 for Nifty Index
- Resistance Zone 25850 to 26105 then upwards at ATH 26373.20 for Nifty Index
- Nifty fell short by tad bit of 32 points to create a New ATH on 03rd February, 2026
- Nifty Gap Up Opening of 533 pts on 03-Feb-2026 would need be filled, sooner or later
NIFTY
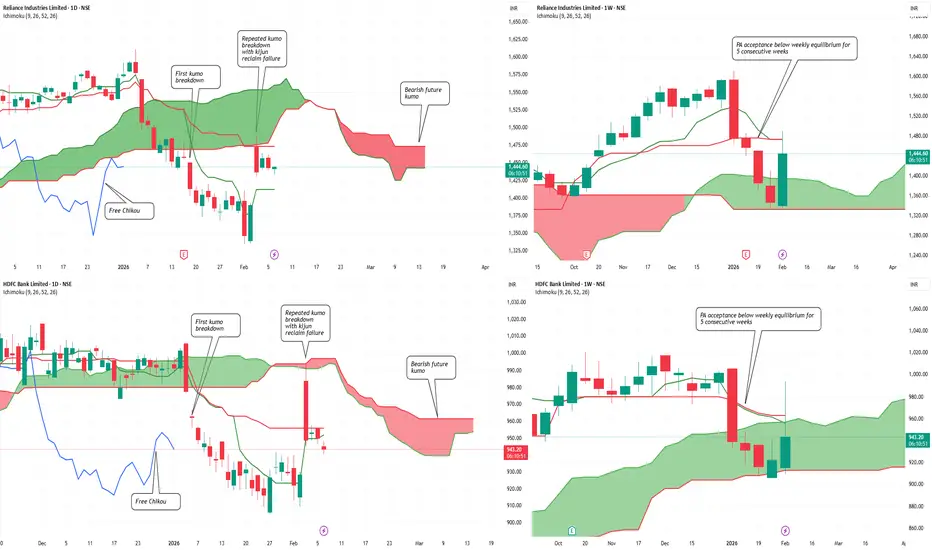
Dead Cat Bounce in Nifty? Heavyweights to Deliver The VerdictDead Cat Bounce in Nifty? Index Heavyweights to Deliver the Verdict Soon…
Both index heavyweights remain structurally weak despite the recent bounce.
On the daily timeframe, Reliance Industries and HDFC Bank have transitioned out of bullish Ichimoku regimes. Crucially, the second daily Kumo breakdown in both stocks overlaps with a failed Kijun-sen reclaim , reinforcing bearish continuation rather than base formation.
The weekly picture strengthens this caution. Price has shown multi-week acceptance below weekly equilibrium across both names, signaling institutional comfort at lower levels . Until price can reclaim and sustain above the weekly mean, the ongoing bounce risks remaining a dead cat rather than evolving into a sustainable trend reversal.
Verdict pending — and it rests squarely with these heavyweights
Axis Bank | Gann Square of 9 Intraday Observation | 12 March 202Disclaimer:
This analysis is for educational purposes only. I am not a SEBI-registered advisor. This is not financial advice.
Symbol: AXISBANK (NSE)
Date Observed: 12 March 2024
Time Frame: 15-Minute Chart
Method: Gann Square of 9 (Price Capacity & Time Study)
This post documents a historical intraday observation based on the Gann Square of 9, focusing on how early completion of price capacity can coincide with temporary market pressure.
📊 Market Structure & Reference Selection
Axis Bank opened with upward momentum during the first 15-minute candle.
In such conditions, the low of the opening candle (~1100) was treated as the 0-degree reference level, following Gann methodology.
This level served as the base point for measuring the session’s upward price capacity.
Accurate identification of the reference point is essential for reliable Square of 9 observations.
🔢 Square of 9 Level Mapping
Based on the selected reference:
0 Degree: ~1100
45 Degree (Observed Normal Capacity): ~1117
The 45-degree level often reflects the normal intraday price expansion range under regular conditions.
⏱️ Price–Time Behavior (Observed)
Price interacted with the 45-degree level early in the session (around 9:30 AM).
Completion of normal price capacity well before the later part of the trading day has historically been associated with short-term exhaustion.
After reaching this zone, the market showed temporary selling pressure and downside expansion.
This aligns with a commonly observed Gann principle:
When expected price capacity is completed early in time, the probability of a reaction may increase.
📘 Educational Takeaways
Gann Square of 9 helps define intraday price limits in advance
Early completion of price capacity can signal temporary trend fatigue
Time alignment strengthens interpretation of price-degree levels
The method encourages structured observation over prediction
Focus remains on process, not precision
📌 Shared strictly for educational and historical chart-study purposes.
#AxisBank #GannSquareOf9 #WDGann #IntradayAnalysis #MarketEducation #PriceTime #TechnicalAnalysis

Nifty 50 - What Next?According to the study pattern, all important levels are marked on the chart.
A rising parallel channel has been formed since June 24. Also, another parallel channel is formed since April 25. At the moment, the price is at the lower level of the inner parallel channel. If the price sustains above the lower level, it may go up. The above targets may be 25700/ 26800 and 27100.
The setup fails if the price sustains below the yellow trendline (marked on the chart).
This is not buying or selling advice in any form. This is only my view, shared only for learning and sharing purposes.
Your views are welcome.

Axis Bank | Gann Square of 9 Intraday Observation | 15 March 202Disclaimer:
This analysis is for educational purposes only. I am not a SEBI-registered advisor. This is not financial advice.
Symbol: AXISBANK (NSE)
Date Observed: 15 March 2024
Time Frame: 15-Minute Chart
Method: Gann Square of 9 (Price Capacity & Time Study)
This post documents a historical intraday market observation using the Gann Square of 9, focusing on how price capacity, trend context, and time alignment can highlight potential intraday reaction zones.
📉 Market Context & Reference Point Selection
Axis Bank showed downside pressure from the opening 15-minute candle.
In such conditions, the high of the first 15-minute candle (~1050) was treated as the 0-degree reference level, following Gann methodology.
This level acts as the starting point for measuring the intraday downward price cycle.
Correct trend identification and reference selection are essential before applying Square of 9 calculations.
🔢 Square of 9 Price Mapping
Based on the selected reference:
0 Degree: ~1050
45 Degree (Observed Normal Capacity): ~1034
The 45-degree level often represents the normal intraday price expansion range under regular market conditions.
⏱️ Price–Time Interaction (Observed Behavior)
Price interacted with the 45-degree level early in the session (around the third 15-minute candle).
Completion of normal price capacity well before the later part of the trading day has historically shown signs of temporary downside exhaustion.
After reaching this zone, the market displayed short-term stabilization followed by upward expansion.
This aligns with a commonly observed Gann concept:
When expected price capacity is completed early in time, the probability of a directional reaction may increase.
📘 Educational Takeaways
Gann Square of 9 helps define intraday price limits in advance
Trend context determines how reference points are selected
Time alignment adds confirmation to price-degree levels
Normal (45-degree) reactions are more frequent than rare cases
The approach encourages rule-based observation over emotional reaction
📌 Shared strictly for educational and historical chart-study purposes.
#AxisBank #GannSquareOf9 #WDGann #IntradayAnalysis #MarketEducation #PriceTime #TechnicalAnalysis

Axis Bank | Gann Square of 9 Intraday Observation | 18 March 202Disclaimer:
This analysis is for educational purposes only. I am not a SEBI-registered advisor. This is not financial advice.
Symbol: AXISBANK (NSE)
Date Observed: 18 March 2024
Time Frame: 15-Minute Chart
Method Used: Gann Square of 9 (Price–Time Study)
This post documents a historical intraday market observation using the Gann Square of 9, focusing on how price movement capacity and time alignment can highlight potential intraday reaction zones.
📊 Initial Market Structure
Axis Bank displayed upward momentum from the opening 15-minute candle.
The low of the first 15-minute candle (~1043) was treated as the 0-degree reference level.
This reference point marks the start of the intraday price cycle and is used for further Square of 9 calculations.
Correct identification of the 0-degree level is a key requirement for consistent Square of 9 analysis.
🔢 Square of 9 Level Mapping
Using Square of 9 price-degree relationships, the following levels were observed:
0 Degree: ~1043
45 Degree (Observed Normal Capacity): ~1057
The 45-degree level often reflects the normal intraday price expansion range under regular market conditions.
⏱️ Price & Time Interaction (Observed Behavior)
Price interacted with the 45-degree level early in the session (around the second 15-minute candle).
Completion of the normal price capacity well before the later part of the trading day has historically shown temporary price pressure.
After reaching this zone, the market displayed rejection behavior followed by short-term downside expansion.
This observation aligns with a commonly studied Gann principle:
Early completion of expected price capacity may increase the probability of a market reaction.
📘 Educational Takeaways
Gann Square of 9 helps define logical intraday price limits
Normal (45-degree) reactions occur more frequently than exceptional cases
Time context adds important confirmation to price levels
Minor price deviations around calculated levels are part of normal market behavior
The method supports rule-based observation, not prediction
📌 Shared strictly for educational and historical chart-study purposes.
#AxisBank #GannSquareOf9 #WDGann #IntradayAnalysis #MarketEducation #PriceTime #TechnicalAnalysis

Axis Bank | Gann Square of 9 Intraday Study (Normal Case)Disclaimer:
This analysis is for educational purposes only. I am not a SEBI-registered advisor. This is not financial advice.
Symbol: AXISBANK (NSE)
Date Observed: 13 November 2024
Time Frame: 15-Minute Chart
This post documents a historical intraday observation using the Gann Square of 9, focusing on how normal price movement capacity interacts with time to highlight potential reaction zones.
📊 Initial Market Structure
Axis Bank showed upward momentum from the first 15-minute candle.
The low of the opening candle (~1148) was treated as the 0-degree reference level, following standard Square of 9 practice.
This reference point acts as the base for mapping the day’s expected upward vibration.
Correct identification of the 0-degree is essential for meaningful Square of 9 observations.
🔢 Gann Square of 9 Level Mapping
Based on Square of 9 calculations:
0 Degree: ~1148
45 Degree (Observed Normal Capacity): ~1165
In intraday studies, the 45-degree level often represents a stock’s normal price expansion range under regular market conditions.
⏱️ Price & Time Interaction (Observed Behavior)
Price reached the 45-degree level early in the session (around the second 15-minute candle).
Completion of the normal price capacity well before the later part of the trading day has historically shown temporary price pressure.
After interacting with this zone, the market displayed rejection behavior and short-term downside expansion.
This reflects a commonly observed Gann principle:
Early completion of expected price capacity can increase the probability of a reaction.
📘 Key Educational Takeaways
Square of 9 helps define logical intraday price limits
Normal (45-degree) reactions occur more frequently than rare cases
Combining price structure with time context improves clarity
The method supports rule-based observation, not prediction
Small variations around levels are part of normal market behavior
📌 Shared purely for educational and historical chart-study purposes.
#AxisBank #GannSquareOf9 #WDGann #IntradayAnalysis #MarketEducation #TechnicalAnalysis #PriceTime

Axis Bank | Gann Square of 9 Intraday Study (Normal Case)Disclaimer:
This analysis is for educational purposes only. I am not a SEBI-registered advisor. This is not financial advice.
Symbol: AXISBANK (NSE)
Date Observed: 14 November 2024
Time Frame: 15-Minute Chart
This post is a historical intraday case study showing how the Gann Square of 9 can be used to identify potential reaction zones by combining price movement capacity with time.
📊 Opening Market Observation
Axis Bank showed bullish intent from the first 15-minute candle.
The low of the opening candle (~1131.60) was treated as the 0-degree reference, following standard Gann methodology.
This reference level acts as the base point for measuring upward price vibration for the session.
🔢 Square of 9 Level Structure
Based on Square of 9 calculations:
0 Degree: ~1131
45 Degree (Observed Normal Capacity): ~1148
In intraday studies, the 45-degree level often represents the stock’s normal directional movement range.
⏱️ Price & Time Interaction (Educational Observation)
Price reached the 45-degree level very early in the session (around the second 15-minute candle).
Completion of the normal movement range well before the latter part of the trading session has historically shown temporary price pressure or hesitation.
After interacting with this zone, the market displayed rejection behavior and short-term weakness.
This reflects a commonly observed Gann principle:
When price completes its expected movement capacity too early in time, the probability of a reaction increases.
📘 Key Educational Takeaways
Square of 9 levels can be projected in advance for structured observation
Correct identification of the 0-degree reference is critical
Alignment of price and time improves analytical context
Normal (45-degree) cases occur more frequently than rare (90-degree) cases
This approach supports disciplined chart reading rather than emotional decisions
📌 Shared purely for learning and historical chart-study purposes.
#AxisBank #GannSquareOf9 #WDGann #IntradayAnalysis #MarketEducation #TechnicalAnalysis #PriceTime

Nifty50 analysis(3/2/2026)Expiry day.CPR: wide + overlapping cpr: slightly bullish and consolidtion
FII: -1,832.46 sold
DII: 2,446.33 sold.
Highest OI:
cant say whats oi because of hugeeeeeeeeee gap up.
Resistance: -
Support : -
conclusion:.
My pov:
1.price has crossed the range 25500, this will be the strong support for today.
2.there is a huge gap up so market makes another rally because of short covering wait for first one and trade.
3. today is expiry that also has volatality, mind that.
What IF:
1.today market can break ATH.
2.can retest from high because most of the smart money try to entry at low .
psychology fact:
Trading fails not because of lack of opportunity,
but because most minds can’t handle unlimited freedom.
note:
8moving average ling is blue colour.
20moving average line is green colour
50moving average line is red colour.
200moving average line is black colour.
cpr is for trend analysis.
MA line is for support and resistance.
Disclaimer:
Iam not Sebi registered so i started this as a hobby, please do your own analysis, any profit/loss you gained is not my concern. I can be wrong please do not take it seriously thank you.

Automotive Axles - ATH Breakout - Investment Ideas#Automotive Axles Limited - Technical Analysis
Current Price: 1,790.80
#Breakout & Retest = Opportunity
#Technical Setup
Strategy: Swing to Short Term Trade
✅ **ATH Breakout + Retest** - Successfully retested breakout zone
✅ **Higher High Formation** - Clear uptrend structure
✅ **EMAs Sorted** - Bullish alignment confirmed
✅ **Trendline Breakout** - Long-term resistance conquered
#Key Levels
Support: 1,520 (Tight SL) | 1,504 (Major support)
Swing Targets:
- T1: 2,078
- T2: 2,189
- T3: 2,284
Short-Term Targets:
- T1: 2,546
- T2: 2,800
- T3: 2,933
- Grand T4: 3,125
#tradesetup
Entry: Current levels (1,790 - 1,800)
Stop Loss: 1,520 (daily closing basis)
Risk-Reward: 1:3+ (excellent)
Timeframe: 2-6 months
Disclaimer: For educational purposes only. Not investment advice. Trading involves substantial risk. Consult a SEBI-registered financial advisor before making investment decisions. Past performance doesn't guarantee future results.
#AutomotiveAxles #SwingTrading #BreakoutTrading #TechnicalAnalysis #NSE #AutoStocks #ShortTermTrading #StockMarket #ATHBreakout #IndianStocks

NIFTY trapped between two magnets - A flat Kijun & flat Senkou BNIFTY's daily chart price action is stuck between two magnetic levels that tend to attract price towards them - A flat Kijun & a flat Senkou B. Which magnet is more powerful? With union budget round the corner, expecting one of the level to play out very soon
This analysis is for educational purposes only

Nifty spot 25320.65 by Daily Chart view - Weekly UpdateNifty spot 25320.65 by Daily Chart view - Weekly Update
- Support Zone 24775 to 25075 for Nifty Index
- Resistance Zone 25325 to 25625 for Nifty Index
- Nothing major Domestically except for the unwarranted Geo-Political scenario affecting our Stock Markets

NIFTY | 15-Min Chart Update
Nifty is forming a descending triangle on the 15-minute timeframe.
Trendline acting as resistance, limiting upside attempts.
Key support placed near 24,971.
A decisive break below support may trigger further downside, while a breakout above the trendline could signal short-term recovery.
Watch for volume confirmation before taking trades.

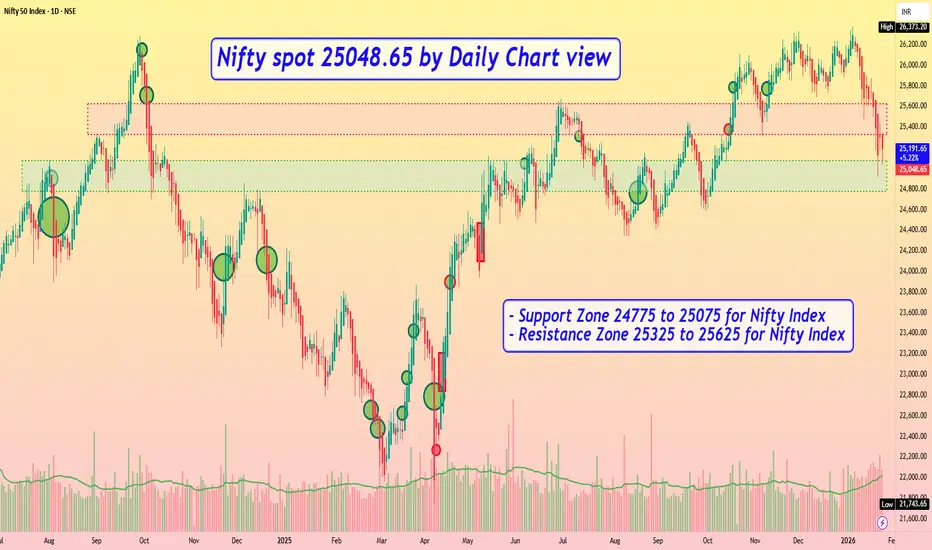
Nifty spot 25048.65 by Daily Chart view - Weekly UpdateNifty spot 25048.65 by Daily Chart view - Weekly Update
- Support Zone 24775 to 25075 for Nifty Index
- Resistance Zone 25325 to 25625 for Nifty Index
- Since a while the indicative Support and Resistance Zone are just an eyewash, as they hardly sustain by the unprecedented Geo-Political happenings
Axis Bank | Intraday Price Behavior Using Square-Based GeometryDisclaimer:
This analysis is for educational purposes only. I am not a SEBI-registered advisor. This is not financial advice.
Educational Case Study | 1 April 2024
This idea shares an educational intraday case study on Axis Bank, focusing on how price capacity and time awareness were observed using square-based geometric methods discussed in classical market studies.
The objective is to study historical chart behavior, not to suggest trades or outcomes.
📊 Chart Context
Instrument: Axis Bank Ltd. (NSE)
Date: 1 April 2024
Timeframe: 15-minute (Intraday)
During the early part of the session, Axis Bank showed upward movement. A structured framework was applied to observe how price interacted with predefined reference levels as the session progressed.
🔍 Observational Framework Used
The low of the initial intraday structure was treated as a reference point (around 1048)
From this reference, square-based projections were observed
A level near 1064 aligned with a 45-degree projection, often associated with normal intraday price reach in historical studies
A higher projection was noted only as a contextual boundary, not an expectation
All levels were considered potential reaction zones, not fixed resistance points.
📈 Observed Intraday Behavior
Price gradually moved toward the projected zone during the session
Near this area, the market showed temporary pressure and difficulty sustaining above the level
A short-term response was observed around the projected zone
Minor price variation around the level was consistent with normal market behavior
This observation aligns with how price has historically interacted with similar geometric areas.
📘 Educational Takeaways
Square-based geometry can help outline logical intraday price capacity
The 45-degree projection often acts as an area of interest, not a precise barrier
Time awareness adds structure when observing intraday movement
Small deviations around projected zones are normal and expected
This approach encourages rule-based observation rather than precision fixation
All insights are based on historical chart study only.
📌 Important Note
This case study is shared strictly for learning and research purposes.
Geometric levels and time windows do not guarantee outcomes and should be treated as contextual analytical tools.
Market behavior may include:
Temporary pauses
Short-term pressure
Continuation or expansion depending on broader structure
🚀 Summary
This intraday case study demonstrates how price geometry and time alignment can be used to observe market behavior objectively and systematically.
More educational chart studies will follow.

NIFTY 50 | Time-Cycle Observation Using Gann-Based MethodsDisclaimer:
This analysis is for educational purposes only. I am not a SEBI-registered advisor. This is not financial advice.
Educational Case Study | March–April 2023
This idea shares an educational case study highlighting how time-cycle concepts, often discussed in classical Gann literature, were observed on the NIFTY 50 index during March–April 2023.
The focus of this post is to study how time completion and price behavior interacted, rather than to present a forecast or trading outcome.
📊 Background of the Observation
On 13 March 2023, NIFTY 50 was trading near a time–price balance area identified through time-based analysis methods.
Rather than relying on indicators or news flow, the study examined how time progression aligned with subsequent price behavior — an approach commonly referenced as time leading price in classical analysis.
A 9-day time window was identified as an area of interest, with 24 March 2023 marking a notable time point for observation.
🔍 Market Behavior After Time Completion
Following the completion of the identified time window:
The index began showing positive momentum
Price expanded upward over the subsequent sessions
Part of the observed movement unfolded shortly after the time cycle completed
Additional price expansion continued as the broader structure evolved
This sequence provided an example of how price activity may increase after time completion, depending on market conditions.
📘 Key Educational Takeaways
Market expansion is often observed after time completion, rather than at obvious price levels
Time analysis can help identify periods of potential expansion or contraction
Studying time reduces emotional bias and improves patience
Gann-based methods focus on structure and rhythm, not precise prediction
All observations are based on historical chart behavior, not future expectations.
📌 Important Clarification
This post is shared only for study and research purposes.
No directional advice, trade execution, or performance guarantee is implied.
Time-based zones should be treated as:
Areas of observation
Potential reaction windows
Not fixed outcomes
📚 Additional Learning Resource
For readers interested in a detailed educational explanation of time-cycle concepts used in this chart study, a longer learning resource is available below:
nirajmsuratwala.in
(Shared strictly for educational reference)
🚀 Summary
This case study demonstrates how time-cycle observation, when combined with structure, can help traders study market rhythm objectively.
More educational case studies will follow.

NIFTY – Intraday Structure | Breakout from Bullish ConsolidationOn 5m, 15m and 1H timeframes, NIFTY formed a bearish trendline breakout around 2 PM, followed by a pullback and formation of a bullish intraday consolidation channel.
Price is currently consolidating inside this bullish channel, and a decisive break on either side can define the next intraday move.
🔹 Intraday Plan
Upside Scenario:
Break above bullish channel
Targets:
T1: 25,500
T2: 25,550
T3: 25,650
Stop Loss: 25,300 – 25,280
Downside Scenario:
Break below bullish channel
Targets:
T1: 25,150
T2: 25,000
T3: 24,900 – 24,920
Stop Loss: 25,360 – 25,380
This is a pure intraday range-break setup based on post-breakout bullish consolidation.
⚠️ Disclaimer
I am not a SEBI registered advisor or trader.
This analysis is shared only for educational purposes.
Please consult a registered financial advisor before taking any trading decisions.

NIFTY – Multi-Timeframe Parallel Channel | Long-Term ViewOn Daily, 4H and 1H timeframes, NIFTY continues to trade inside a bullish parallel channel.
This consolidation has been active from April to December, with price repeatedly respecting both the lower and upper channel boundaries.
At the same time, the upper bullish trendline has been continuously extending from April till date, showing that the primary trend remains intact despite time-wise consolidation.
This reflects a time-based consolidation inside an ongoing uptrend, not a distribution structure.
🔹 Key Observations
Same parallel channel aligned on 1H, 4H and Daily
Consolidation range active from April to December
Upper bullish trendline continuing from April till date
Repeated rejections from both channel boundaries
RSI consistently rejects from oversold zones
Strong historical rejection zone near 24,900 – 24,500
🔹 Long-Term Plan (Positional)
Buy on Dips Zone: Around 25,000
Stop Loss (Invalidation): 24,700 – 24,600 (closing basis)
Targets:
T1: 26,000
T2: 26,400
T3: 26,500 – 26,700 (on trendline breakout)
🔹 Scenarios
Sustained breakout above 26,400 and above the upper channel can lead to further upside continuation.
Breakdown below 25,000 can turn the bias negative.
Historically, deep breakdowns have occurred only during extreme events.
Until any major impact news appears, channel continuation remains the higher-probability structure.
⚠️ Disclaimer
I am not a SEBI registered advisor or trader.
This analysis is shared only for educational purposes.
Please consult a registered financial advisor before taking any trading or investment decisions

Lets Talk about Nifty I make educational content videos on Trading - Swing Trading in Indian markets especially
In this video I am talking about Nifty in general as a index nothing else - no direction - no predication - I am a setup and data backed trader and follow my setups and not general trends or bias shared commonly .

Why Every Trend Needs an Anchor Markets Are Test Matches, Not T20s — Why Every Trend Needs an Anchor
Understanding AVWAP: Learning to Read Where the Market Remembers
One of the biggest challenges for traders is knowing which levels actually matter.
Markets print hundreds of candles, but only a few prices carry memory.
Anchored VWAP (AVWAP) is a tool that helps us identify those prices — where meaningful participation occurred.
Yesterday’s price action in Nifty Futures offers a very good learning example.
During a sharp, emotional sell-off, price declined and stopped precisely at the AVWAP anchored from the 7th April 2025 low — a day that also marked the highest traded volume of the last year (~20 million contracts).
This outcome wasn’t accidental. It was structural.
What AVWAP Really Represents
AVWAP is not just another indicator.
It shows:
The average price paid by participants since a chosen point
Weighted by volume, not time
Reflecting real positioning, not theoretical averages
In simple terms:
AVWAP tells us where the market’s money is positioned from a specific event.
Because large participants manage risk around their average price, AVWAP often becomes a decision zone, not just a line.
Why the Anchor Is More Important Than the Indicator
AVWAP is only as effective as the event you anchor it to.
The market does not respect arbitrary dates.
It respects events that forced commitment.
High-quality anchor points include:
Days with exceptionally high volume
All-time highs or major breakouts
Crash lows (2008, COVID)
Major structural bottoms (such as 2023)
Panic or capitulation candles
These are the moments when positioning changes hands and long-term inventory is created.
April 2025: A Lesson in Confluence
Let’s break this down step by step.
1. The 2023 Bottom
This was not just another swing low.
It was a cycle-defining bottom for Nifty.
Anchoring an AVWAP from this point gives us a long-term cost reference for market participants who entered near that structural low.
2. April 7, 2025
On this day:
Nifty Futures formed a swing low
Volumes expanded to the highest level of the past year (~20M)
Price was trading very close to the AVWAP from the 2023 bottom
This alignment is important.
When a new high-volume low forms near an older structural AVWAP, it tells us larger players are engaging at a familiar cost zone.
3. What Happened After
Following April 2025:
Price trended higher
Pullbacks repeatedly found support near this AVWAP
Buyers defended the level consistently
This behavior shows acceptance above the anchor — a sign of healthy structure.
4. The Recent Panic Sell-Off
During yesterday’s sell-off:
Emotion dominated price action
Weak hands exited positions
Price declined directly into the April 7 AVWAP
Selling pressure slowed and price stabilized
This is exactly how strong reference levels behave — they don’t prevent volatility, but they absorb it.
Why AVWAP Works During Volatile Markets
AVWAP becomes especially useful when volatility expands.
That’s because:
Institutions track their average cost
Risk is adjusted near those levels
Decisions are made where positioning is concentrated
As a general framework:
Above AVWAP → structure remains constructive
Below AVWAP → supply increases, caution required
Reclaim of AVWAP → trend strength resumes
AVWAP doesn’t predict direction.
It highlights where decisions are likely to happen.
Practical Guidance for Using AVWAP
1. Be Selective With Anchors
Before anchoring, ask:
“Was this a moment when the market was forced to commit?”
If not, skip it.
2. Always Look at Volume
The best AVWAPs come from:
Highest volume days
Breakdowns or breakouts with expansion
Panic or capitulation events
Volume validates relevance.
3. Look for Confluence, Not Precision
AVWAP works best when it aligns with:
Prior swing lows or highs
Trend structure
Higher timeframe context
April 2025 was powerful because it aligned with the AVWAP from the 2023 bottom.
4. Let Volatility Confirm the Level
Quiet markets don’t test conviction.
Volatile markets do.
If a level holds during panic, it deserves respect.
My Perspective
AVWAP is not about drawing more lines.
It’s about learning which prices the market remembers.
When price reacts during fear — not comfort — you are seeing real structure, not coincidence.
Study those reactions.
Over time, you’ll begin to see that the market leaves clear footprints — and AVWAP is one of the best tools to track them.
My Take on markets vsTest Matches
In Test cricket, great innings aren’t built on constant aggression.
They are built around an anchor — the batsman who:
Absorbs pressure
Respects good deliveries
Holds one end while others play around him
This is exactly how great players likes of Sachin Tendulkar, Rahul Dravid Virat Kohli et all have built his best Test knocks — not by chasing every ball, but by playing around a stable base.
Markets behave the same way.
Price can swing, panic can spread, momentum players can come and go — but long-term structure holds around anchored reference points.
AVWAP acts like that anchor batsman.
It doesn’t score flashy runs every session.
It doesn’t predict the next ball.
But as long as price respects it, the innings stays intact.
When panic arrives, the anchor absorbs it.
When momentum returns, the innings continues.
As traders and investors, our job is not to play every delivery.
Our job is to recognize where the market is anchoring, and then build positions with patience — just like a Test match, not a highlight reel.
Because in both cricket and markets:
Those who stay anchored, stay in the game the longest.

NIFTY : Trading levels and Plan for 20-Jan📘 NIFTY Trading Plan – 20 Jan 2026
Timeframe: 15-minute
Gap Criteria Considered: 100+ points
Market Structure: Short-term corrective phase after rejection from upper range, base formation near intraday support
🔼 SCENARIO 1: GAP UP OPENING (100+ points) 🚀
If NIFTY opens above 25,667, it signals bullish intent with short-covering momentum.
Immediate resistance zone lies at 25,667 – 25,682 (Opening / Last Resistance).
Sustained price acceptance above 25,682 on a 15-min close can trigger upside continuation.
Upside targets to watch:
• 25,740
• 25,791
Expect minor pullbacks near resistance; fresh longs only on pullback + hold above broken levels.
Avoid chasing gap-up candles without retest confirmation.
📌 Options Strategy (Gap Up):
• Bull Call Spread (ATM Buy + OTM Sell)
• Avoid naked CE buying near resistance
• Trail profits aggressively as volatility expands 📈
➡️ SCENARIO 2: FLAT / RANGE OPENING ⚖️
If NIFTY opens within 25,529 – 25,568, market enters a balance / no-trade zone.
This zone acts as Opening Support Zone for flat markets.
Expect whipsaws and fake breakouts initially.
Upside trade activates only above 25,682.
Downside pressure increases below 25,529.
Best environment for patience and structure-based entries.
📌 Options Strategy (Flat Market):
• Short Strangle / Iron Condor (only for experienced traders)
• Focus on theta decay ⏳
• Keep strict SL on breakout from range
🔽 SCENARIO 3: GAP DOWN OPENING (100+ points) 📉
If NIFTY opens below 25,529, bears gain control early.
First support zone is 25,422 – 25,364 (Intraday Demand Zone).
Expect a technical bounce, but trend remains weak below resistance.
Breakdown below 25,364 can open deeper downside.
Avoid bottom fishing until strong bullish reversal candle appears.
📌 Options Strategy (Gap Down):
• Bear Put Spread preferred
• Avoid aggressive PE selling in trending markets
• Quick scalps only, book fast 📉
🧠 Risk Management Tips for Options Trading 🛡️
Risk only 1–2% of capital per trade.
Expiry week = faster premium decay & sharp moves.
Prefer spreads over naked option buying.
No revenge trading after SL hits.
Always wait for 15-min structure confirmation before entry.
📌 Summary & Conclusion ✨
NIFTY is currently trading near a short-term balance zone.
📍 25,529 – 25,568 is the key decision-making area.
📍 Sustained move above 25,682 may revive bullish momentum.
📍 Below 25,529, downside risk increases sharply toward 25,422.
Trade light, respect levels, and let price confirm direction.
⚠️ Disclaimer
This content is for educational purposes only.
I am not a SEBI registered analyst.
Markets are uncertain, and I can be wrong.
Please consult your financial advisor before trading.

Part 1 Technical VS. Institutionalinstitutional trading focuses on large-scale transactions, often executed by financial institutions like banks, hedge funds, or pension funds. They typically have access to significant capital and advanced market insights, and their trades can influence market trends.
On the other hand, technical trading relies on analyzing price charts, patterns, and indicators to make decisions. Technical traders look at historical price movements and use tools like moving averages, support and resistance levels, and oscillators to predict future price movements.
In summary, institutional trading is more about the scale, resources, and market impact, while technical trading is more about patterns, price action, and chart-based strategies.

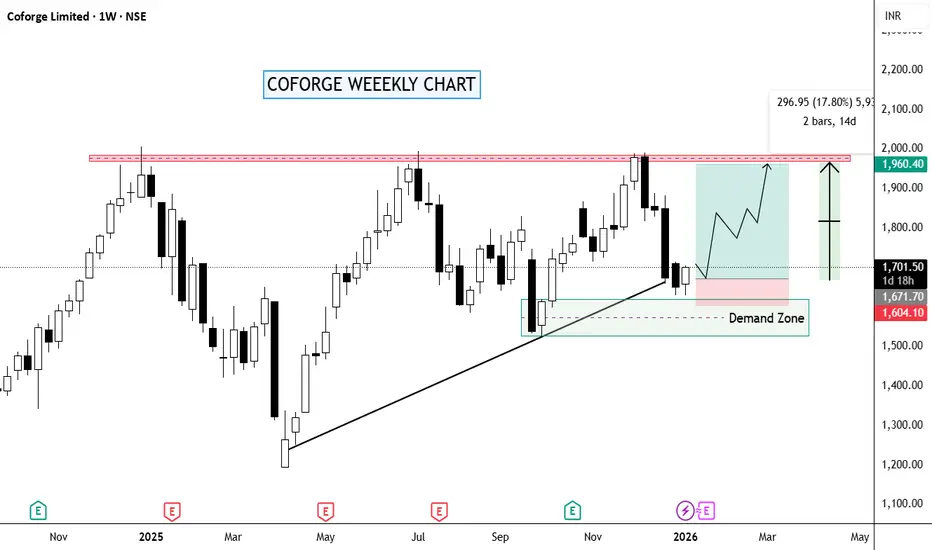
COFORGE – Weekly Chart | Clean Technical ViewNSE:COFORGE
🔹 Trendline + 50 EMA Support:
Price has pulled back into a rising weekly trendline, and the 50 EMA is sitting right there. This confluence is the key zone.
🔹 Price Action:
Rejection from 1950–2000 came with a controlled pullback, not panic selling. That tells me distribution isn’t aggressive yet.
🟢 Buy Zone (Support-based): 1680 – 1700
NIFTYIT Sector About to go for a Breakout attempt
🔹 Bias:
Above trendline + 50 EMA → bullish bias intact
Weekly close above 1750–1780 → scope to retest 1900–2000
Weekly close below demand → bullish view invalid
Keep Learning,
Happy Trading.