Class for Advanced Intradat Trading part 7Best Intraday Trading Tips for Beginners
Choose Highly Liquid Stocks. ...
Trade in Stocks with Moderate Volatility. ...
Set Realistic Profit and Loss Targets. ...
Use Stop-Loss Orders to Limit Risks. ...
Avoid Overtrading. ...
Focus on a Few Select Stocks. ...
Monitor Market Trends and News Updates. ...
Time Your Entry and Exit Points Wisely.
NIFTY

Advanced Trading part 2The first step should be to approach trading as a business: draft a business plan, create a budget, determine the necessary tools, and determine the markets and strategies you'll trade. Organize and keep on file all important documents: trading plans, brokerage statements, trading journals, and other resources.

Advanced Trading part 1Advanced trading encompasses sophisticated strategies, tools, and techniques used by experienced traders to navigate financial markets effectively. It often involves a deeper understanding of market dynamics, technical analysis, and the use of advanced instruments like options and futures. Traders who embrace advanced trading seek to improve their performance and potentially increase profits by leveraging a broader range of tools and strategies.

What is Relative Strength Index (RSI) ?The Relative Strength Index (RSI) is a momentum indicator used in technical analysis to measure the magnitude of recent price changes to evaluate overbought or oversold conditions in the market. It ranges from 0 to 100, with values below 30 generally indicating an oversold condition and values above 70 suggesting an overbought condition.

Technical TradingTechnical trading is a broader style that is not necessarily limited to trading. Generally, a technician uses historical patterns of trading data to predict what might happen to stocks in the future. This is the same method practiced by economists and meteorologists: looking to the past for insight into the future.

Database Trading **Database trading**, often referred to as **algorithmic trading** or **quantitative trading**, involves using large sets of structured data to make trading decisions and execute trades automatically. It relies heavily on databases to store, process, and analyze market data (historical prices, volumes, order books, etc.) and other relevant information (like economic indicators, news, etc.). The goal is to identify patterns, trends, or anomalies that can be leveraged for profitable trading strategies.

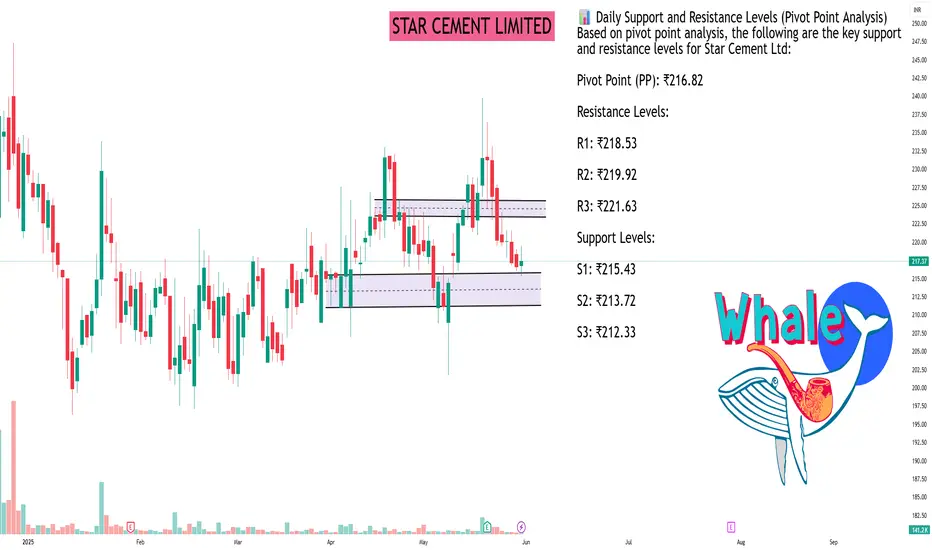
STAR CEMENT LIMITEDAs of May 30, 2025, Star Cement Ltd (NSE: STARCEMENT) closed at ₹217.37. The stock experienced a slight decline of 0.46% from the previous close of ₹216.55.
📊 Daily Support and Resistance Levels (Pivot Point Analysis)
Based on pivot point analysis, the following are the key support and resistance levels for Star Cement Ltd:
Pivot Point (PP): ₹216.82
Resistance Levels:
R1: ₹218.53
R2: ₹219.92
R3: ₹221.63
Support Levels:
S1: ₹215.43
S2: ₹213.72
S3: ₹212.33
📈 Technical Overview
52-Week Range: ₹171.55 – ₹247.30
Market Capitalization: ₹8,785.66 crore
P/E Ratio: 51.96
P/B Ratio: 0.33
Volume (May 30, 2025): Approximately 141,204 shares traded
🔍 Analyst Insights
Analysts have given Star Cement Ltd a "Buy" rating for the long term.
The stock has shown a 33.69% return over six months, closing at ₹231.26 on May 20, 2025.
✅ Summary
Star Cement Ltd is currently trading near its immediate support level of ₹215.43. A breakdown below this could lead to further downside towards ₹213.72 and ₹212.33. Conversely, if the stock sustains above the pivot point of ₹216.82, it may face resistance at ₹218.53 and ₹219.92. Traders should monitor these key levels for potential trading opportunities.
NETWORK 18 MEDIA & INV LTDAs of May 30, 2025, Network18 Media & Investments Ltd (NSE: NETWORK18) closed at ₹54.54. Over the past week, the stock has shown an upward trend, appreciating approximately 11.76%.
📊 Weekly Support and Resistance Levels
Based on recent price movements and technical analysis, the following are the key support and resistance levels for the upcoming week:
Support Levels:
S1: ₹52.82
S2: ₹50.90
S3: ₹49.15
Resistance Levels:
R1: ₹55.57
R2: ₹56.61
R3: ₹57.78
These levels are derived from pivot point analysis and recent trading ranges.
📈 Technical Overview
Trend: The stock has been in an uptrend over the past week, gaining approximately 11.76%.
Volume: On May 30, 2025, the trading volume was approximately 7.23 million shares, indicating healthy investor interest.
🔍 Key Observations
Price Range: The stock traded between ₹53.16 and ₹55.40 on May 30, 2025.
52-Week Range: The stock's 52-week low is ₹39.55, and the 52-week high is ₹106.01.
✅ Summary
Network18 Media & Investments Ltd is currently exhibiting bullish momentum. Traders should monitor the ₹55.57 resistance level; a breakout above this could signal further upside potential. Conversely, if the stock retraces, it may find support around ₹52.82. As always, it's advisable to consider broader market conditions and conduct thorough research before making trading decisions.

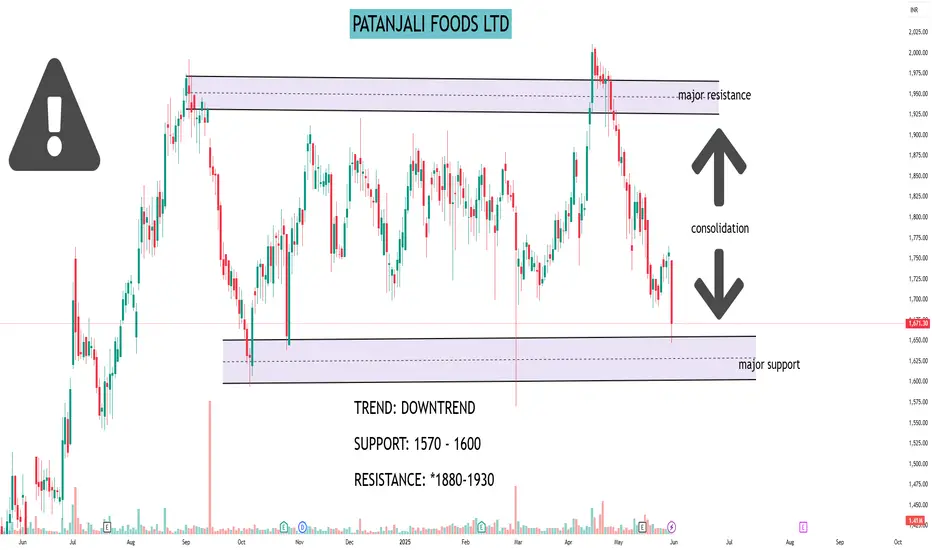
PATANJALI FOODS LTD#PATANJALI
STOCK NAME: PATANJALI FOODS LTD (NSE)
CHART ANALYSIS:
Price has broken out of a long consolidation range. Strong bearish candles indicate downside momentum. Ideal shorting opportunity for swing traders.
TREND: DOWNTREND
SUPPORT: 1570 - 1600
RESISTANCE: *1880-1930
TRADE:
SELL BELOW 1670
Target 1: *1620
Target 2: *1575
Target 3: *1520
Stop Loss: *1750
▲ I AM NOT SEBI REGISTERED. THIS IS ONLY FOR EDUCATIONAL PURPOSES.
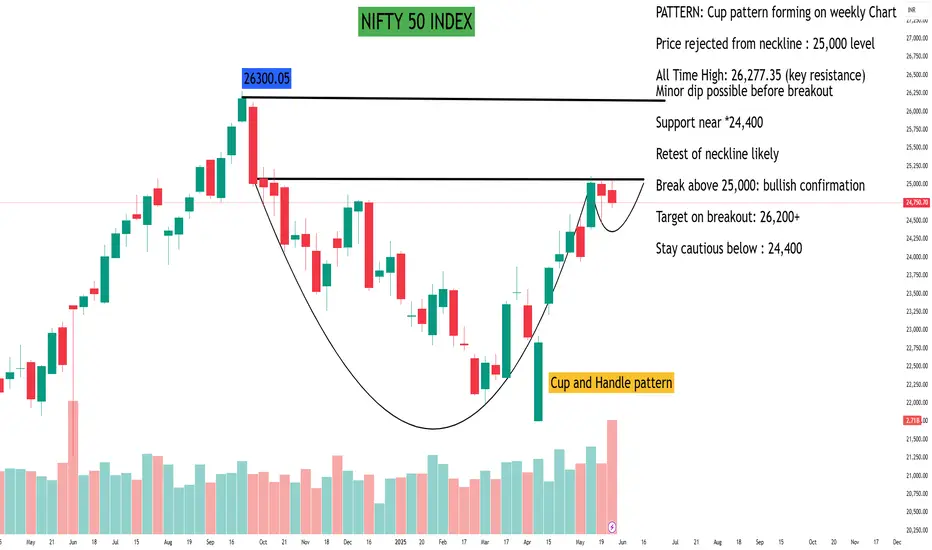
NIFTY 50 INDEXDate - June 2, 2025
CMP : *24,750.70
PATTERN: Cup pattern forming on weekly Chart
Price rejected from neckline : 25,000 level
All Time High: 26,277.35 (key resistance) Minor dip possible before breakout
Support near *24,400
Retest of neckline likely
Break above 25,000: bullish confirmation
Target on breakout: 26,200+
Stay cautious below : 24,400
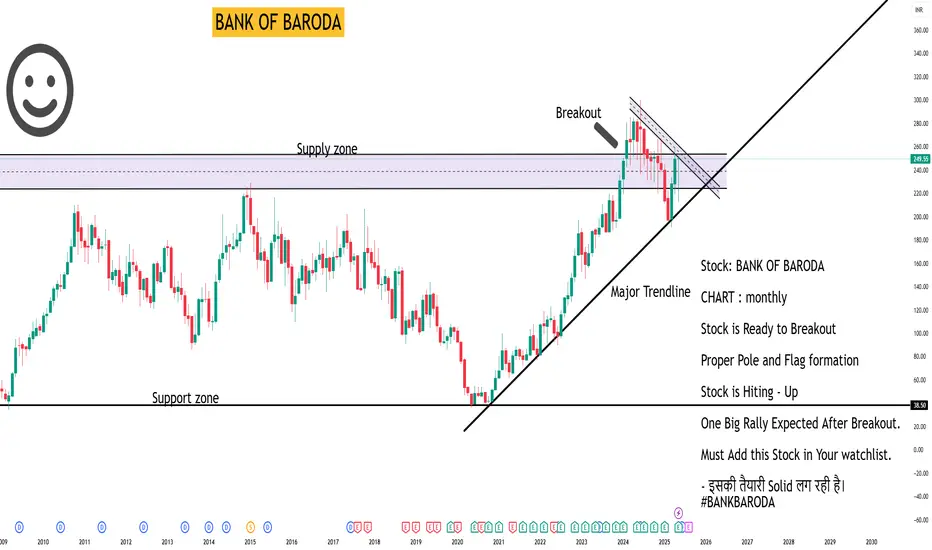
BANK OF BARODAAs of May 30, 2025, Bank of Baroda (NSE: BANKBARODA) closed at ₹249.55, reflecting a 2.59% increase from the previous close.
📊 Monthly Support and Resistance Levels (May 2025)
Based on pivot point analysis, the following are the key support and resistance levels for Bank of Baroda for May 2025:
Support Levels:
S1: ₹238.06
S2: ₹224.04
S3: ₹198.52
Resistance Levels:
R1: ₹263.58
R2: ₹277.60
R3: ₹303.12
📈 Technical Overview
52-Week Range: ₹190.70 – ₹299.70
Recent High (May 30): ₹251.53
Recent Low (May 30): ₹242.16
Volume: Approximately 18.9 million shares traded on May 30
🔍 Analyst Insights
Nomura maintains a 'Buy' rating with a target price of ₹265, suggesting an 18% upside from the current price.
JM Financial also recommends a 'Buy' with a target of ₹250, aligning closely with the current market price.
✅ Summary
Bank of Baroda is currently trading near its immediate resistance level of ₹254.85. A breakout above this level could signal further upward momentum towards ₹260.15 and ₹268.77. Conversely, if the stock fails to sustain above ₹254.85, it may find support at ₹240.93 and ₹232.31.
Given the positive analyst outlook and current technical indicators, monitoring the stock's movement around these key levels could provide potential trading opportunities.
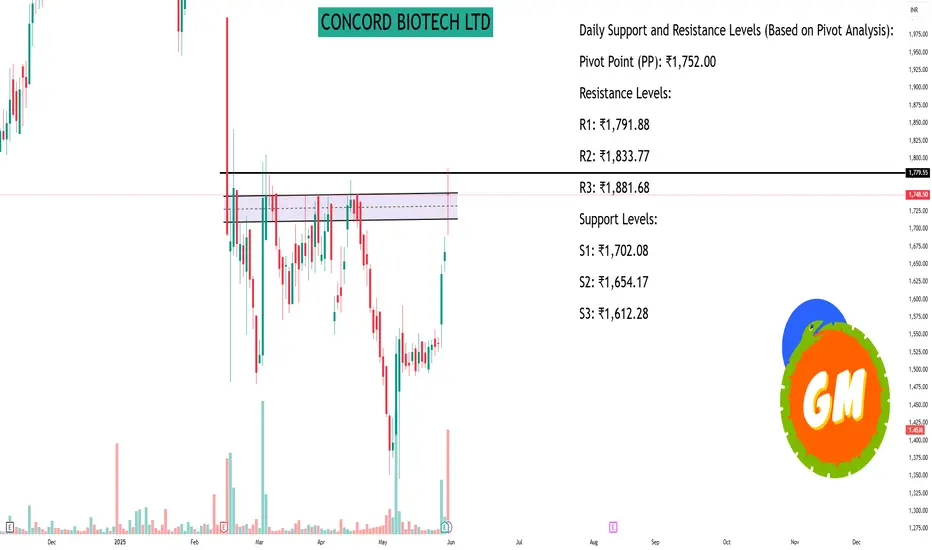
CONCORD BIOTECH LTDAs of May 30, 2025, Concord Biotech Ltd (NSE: CONCORDBIO) closed at ₹1,748.50, marking a 4.9% increase from the previous close of ₹1,666.90 .
Daily Support and Resistance Levels (Based on Pivot Analysis):
Pivot Point (PP): ₹1,743.97
Resistance Levels:
R1: ₹1,791.88
R2: ₹1,833.77
R3: ₹1,881.68
Support Levels:
S1: ₹1,702.08
S2: ₹1,654.17
S3: ₹1,612.28
These levels are derived from the previous day's trading range and can serve as reference points for intraday trading decisions .
Technical Indicators:
Relative Strength Index (RSI): Over 65, indicating bullish momentum.
MACD: The MACD line has crossed above the signal line, suggesting a potential upward trend.
Volume: An increase in trading volume supports the bullish sentiment.
These indicators suggest that the stock is experiencing positive momentum, but it's essential to monitor for any changes in trend .
Key Observations:
Short-Term Range: The stock is trading between ₹1,600 (support) and ₹1,800 (resistance). A breakout above ₹1,800 could signal further upside potential.
Recent Performance: The stock has shown a 15.14% increase over the past month, indicating strong short-term performance .
Conclusion:
Concord Biotech Ltd is exhibiting bullish technical indicators with key support at ₹1,600 and resistance at ₹1,800. Traders should watch for a breakout above ₹1,800 for potential upward movement, while also being cautious of any reversal signals.
Class for Intraday Trader part 7Intraday trading, also known as day trading, involves buying and selling stocks or other financial instruments within the same trading day. The goal is to profit from short-term price fluctuations by holding positions only for a part of the day.

Management and psychology in Trading Trading psychology is the emotional component of an investor's decision-making process, which may help explain why some decisions appear more rational than others. Trading psychology is characterized primarily by the influence of both greed and fear. Greed drives decisions that might be too risky.

Institutional Trading StrategiesInstitutional traders incorporate strategies that emphasize both long-term value and diversification in their trading practices. They leverage significant amounts of capital to build portfolios diversified across multiple assets, which helps reduce risk while seeking improved market prices.

Learn Institutional Trading Institutional trading involves the buying and selling of securities by large financial institutions on behalf of their clients or for their own portfolios. These institutions, such as hedge funds, mutual funds, and insurance companies, handle substantial volumes of trades, potentially impacting market prices.

MACD TradingThe Moving Average Convergence/Divergence indicator is a momentum oscillator primarily used to trade trends. Although it is an oscillator, it is not typically used to identify over bought or oversold conditions. It appears on the chart as two lines which oscillate without boundaries.

RSI Divergence part 2RSI Divergence is among technical analyses allowing traders to discover a possible market reversal by comparing price movements with the Relative Strength Index. The RSI tool measures how fast and strong price movements are, ranging between 0 and 100. Typically, when the RSI is below 30, the asset is considered oversold; when it's above 70, it's seen as overbought.

What is RSI Divergence?RSI (Relative Strength Index) divergence in technical analysis occurs when the price of an asset moves in one direction while the RSI moves in the opposite direction. This divergence can signal a potential trend reversal or weakening momentum.

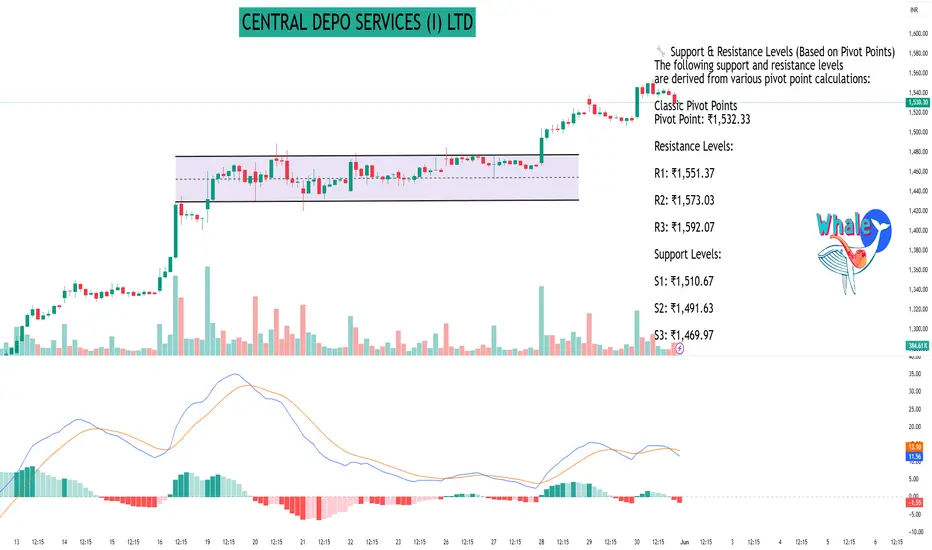
CENTRAL DEPO SERVICES (I) LTDAs of May 30, 2025, here are the 45-minute interval support and resistance levels for Central Depository Services (India) Ltd (NSE: CDSL), based on the latest available data:
📊 Current Price Snapshot
Last Traded Price: ₹1,529.70
Day’s Range: ₹1,513.30 – ₹1,554.00
52-Week Range: ₹917.63 – ₹1,989.80
Volume: 5,711,655 shares
VWAP: ₹1,539.78
Market Capitalization: ₹31,971 crore
Beta: 1.34
Dividend Yield: 0.82%
Book Value per Share: ₹73.16
Upper Circuit Limit: ₹1,664.30
Lower Circuit Limit: ₹1,361.70
🔧 Support & Resistance Levels (Based on Pivot Points)
The following support and resistance levels are derived from various pivot point calculations:
Classic Pivot Points
Pivot Point: ₹1,532.33
Resistance Levels:
R1: ₹1,551.37
R2: ₹1,573.03
R3: ₹1,592.07
Support Levels:
S1: ₹1,510.67
S2: ₹1,491.63
S3: ₹1,469.97
Fibonacci Pivot Points
Pivot Point: ₹1,532.33
Resistance Levels:
R1: ₹1,547.88
R2: ₹1,557.49
R3: ₹1,573.03
Support Levels:
S1: ₹1,516.79
S2: ₹1,507.18
S3: ₹1,491.63
Camarilla Pivot Points
Pivot Point: ₹1,532.33
Resistance Levels:
R1: ₹1,533.43
R2: ₹1,537.16
R3: ₹1,540.89
Support Levels:
S1: ₹1,525.97
S2: ₹1,522.24
S3: ₹1,518.51
📈 Technical Indicators Summary
Relative Strength Index (RSI): Data not available
MACD: Data not available
ADX: Data not available
Stochastic RSI: Data not available
Supertrend: Data not available
Parabolic SAR (PSAR): Data not available
🧭 Trading Outlook
Trend: Neutral to Slightly Bullish
Recommendation: The stock is trading near its pivot point, indicating a neutral stance. Traders should monitor for a breakout above R1 (₹1,551.37) for bullish confirmation or a breakdown below S1 (₹1,510.67) for bearish signals.
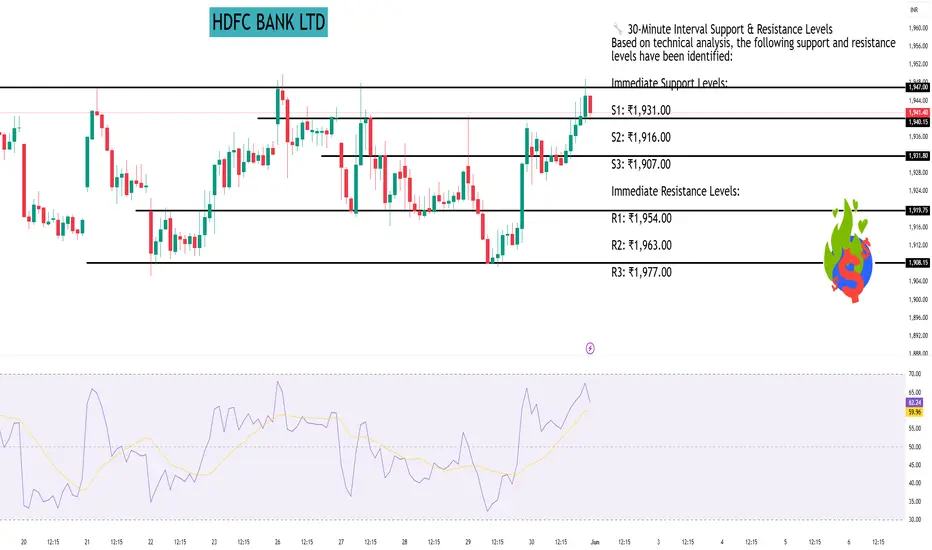
HDFC BANK LTDAs of May 30, 2025, here are the 30-minute interval support and resistance levels for HDFC Bank Ltd (NSE: HDFCBANK), based on the latest available data:
📊 Current Price Snapshot
Last Traded Price: ₹1,944.90
Day’s Range: ₹1,925.10 – ₹1,948.60
52-Week Range: ₹1,490.00 – ₹1,978.90
Market Capitalization: ₹14.77 trillion
Beta: 0.77
Volatility: 1.22%
🔧 30-Minute Interval Support & Resistance Levels
Based on technical analysis, the following support and resistance levels have been identified:
Immediate Support Levels:
S1: ₹1,931.00
S2: ₹1,916.00
S3: ₹1,907.00
Immediate Resistance Levels:
R1: ₹1,954.00
R2: ₹1,963.00
R3: ₹1,977.00
📈 Technical Indicators Summary
Relative Strength Index (RSI): 55.32 (Neutral)
MACD: 0.333 (Bullish)
ADX: 16.63 (Indicates a weak trend)
Stochastic RSI: 55.28 (Neutral)
Supertrend: ₹384.44 (Bullish)
Parabolic SAR (PSAR): ₹385.89 (Bullish)
🧭 Trading Outlook
Trend: Neutral to Slightly Bullish
Recommendation: The stock is trading near its immediate resistance level of ₹1,954.00. A breakout above this level could indicate a bullish trend, while a drop below the immediate support of ₹1,931.00 might suggest bearish momentum. Traders should monitor these levels closely for potential entry or exit points.
EXIDE INDUSTRIES LTDAs of May 30, 2025, here are the monthly support and resistance levels for Exide Industries Ltd (NSE: EXIDEIND) based on various technical analysis methods:
📊 Current Price Snapshot
Last Traded Price: ₹386.85
Day’s Range: ₹383.15 – ₹390.20
52-Week Range: ₹328.00 – ₹620.35
Volume: 1,888,195 shares
VWAP: ₹386.58
Market Capitalization: ₹32,882 crore
Beta: 1.37
Dividend Yield: 0.52%
Book Value per Share: ₹162.65
Upper Circuit Limit: ₹427.65
Lower Circuit Limit: ₹349.95
Face Value: ₹1.00
🔧 Monthly Support & Resistance Levels
Standard Pivot Points
Pivot Point: ₹384.23
Resistance Levels:
R1: ₹416.72
R2: ₹444.83
Support Levels:
S1: ₹356.12
S2: ₹323.63
Fibonacci Pivot Points
Pivot Point: ₹356.12
Resistance Levels:
R1: ₹379.27
R2: ₹393.57
R3: ₹416.72
Support Levels:
S1: ₹332.97
S2: ₹318.67
S3: ₹295.52
Camarilla Pivot Points
Pivot Point: ₹356.12
Resistance Levels:
R1: ₹357.31
R2: ₹362.86
R3: ₹368.42
R4: ₹385.08
Support Levels:
S1: ₹346.19
S2: ₹340.64
S3: ₹335.08
S4: ₹318.42
📈 Technical Indicators Summary
Relative Strength Index (RSI): 55.32 (Neutral)
MACD: 0.333 (Bullish)
ADX: 16.63 (Indicates a weak trend)
Stochastic RSI: 55.28 (Neutral)
Supertrend: ₹384.44 (Bullish)
Parabolic SAR (PSAR): ₹385.89 (Bullish)
🧭 Trading Outlook
Trend: Neutral to Slightly Bullish
Recommendation: The stock is trading near its monthly pivot point, indicating a neutral stance. Traders should monitor for a breakout above R1 (₹416.72) for bullish confirmation or a breakdown below S1 (₹356.12) for bearish signals.

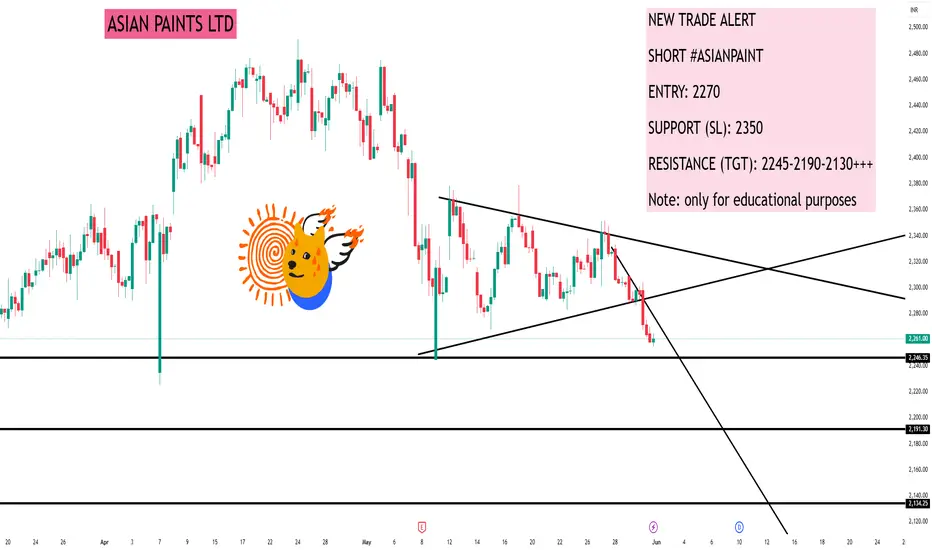
ASIAN PAINTS LTDNEW TRADE ALERT
SHORT #ASIANPAINT
ENTRY: 2270
SUPPORT (SL): 2350
RESISTANCE (TGT): 2245-2190-2130+++
Note: only for educational purposes