Advanced Trading part 2The first step should be to approach trading as a business: draft a business plan, create a budget, determine the necessary tools, and determine the markets and strategies you'll trade. Organize and keep on file all important documents: trading plans, brokerage statements, trading journals, and other resources.
NIFTY

Advanced Trading part 1Advanced trading encompasses sophisticated strategies, tools, and techniques used by experienced traders to navigate complex market dynamics and potentially maximize profits. It involves utilizing a range of analytical tools, including technical indicators, chart patterns, and quantitative analysis, as well as employing instruments like options and futures.

What is Divergence?In technical trading, divergence refers to when an asset's price and a technical indicator move in opposite directions. This discrepancy can signal a potential trend reversal or a weakening trend, prompting traders to consider a change in the direction of their trades.

Technical Trading Technical trading is a broader style that is not necessarily limited to trading. Generally, a technician uses historical patterns of trading data to predict what might happen to stocks in the future. This is the same method practiced by economists and meteorologists: looking to the past for insight into the future.

Database Trading **Database trading**, often referred to as **algorithmic trading** or **quantitative trading**, involves using large sets of structured data to make trading decisions and execute trades automatically. It relies heavily on databases to store, process, and analyze market data (historical prices, volumes, order books, etc.) and other relevant information (like economic indicators, news, etc.). The goal is to identify patterns, trends, or anomalies that can be leveraged for profitable trading strategies.

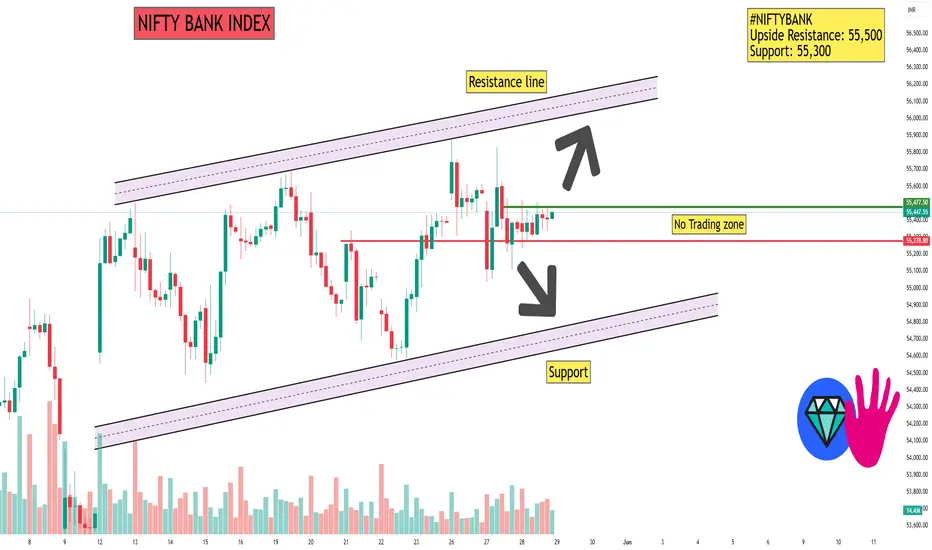
NIFTY BANK INDEX📊 1-Hour Support & Resistance Levels (Classic Pivot Points)
Based on the latest technical analysis, the key support and resistance levels for the Nifty Bank Index on a 1-hour timeframe are:
Support Levels:
S1: ₹55,261.10
S2: ₹55,105.20
S3: ₹54,974.85
Resistance Levels:
R1: ₹55,547.35
R2: ₹55,677.70
R3: ₹55,833.60
These levels are derived from the price range of the previous trading day.
🔍 Technical Indicators Overview
Relative Strength Index (RSI): Currently, the RSI is hovering around 60, indicating a neutral to slightly bullish momentum.
Moving Averages: The index is trading above its 5-day and 10-day simple moving averages, suggesting a short-term bullish trend.
MACD (12,26): The MACD line is above the signal line, indicating positive momentum.
📈 Market Sentiment
The technical indicators collectively suggest a cautiously bullish sentiment for the Nifty Bank Index. However, the RSI indicates that the index is approaching overbought territory, which may lead to a short-term correction. Investors should monitor the support and resistance levels closely for potential breakout or pullback scenarios.
Please note that stock market investments are subject to market risks, and it's essential to conduct thorough research or consult with a financial advisor before making investment decisions.
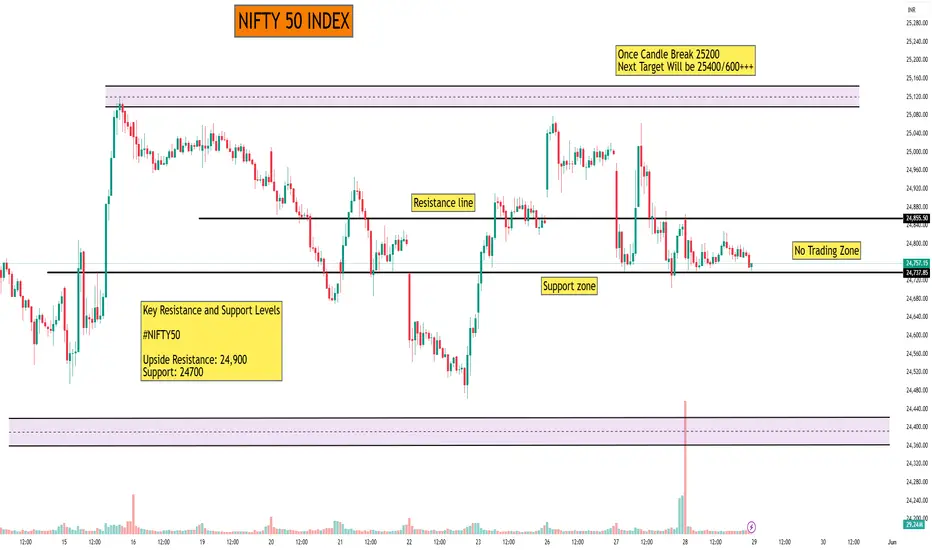
NIFTY 50 INDEXAs of May 29, 2025, the Nifty 50 Index is trading at 24,752.45, reflecting a 0.00% change from the previous close.
📊 15-Minute Support & Resistance Levels (Classic Pivot Points)
Based on the latest technical analysis, the key support and resistance levels for the Nifty 50 Index on a 15-minute timeframe are:
Support Levels:
S1: 24,784.57
S2: 24,704.93
S3: 24,657.47
Resistance Levels:
R1: 24,911.67
R2: 24,959.13
R3: 25,038.77
These levels are derived from the price range of the previous trading day.
🔍 Market Sentiment
The technical indicators suggest that the Nifty 50 Index is currently in a consolidation phase. Traders should monitor the support and resistance levels closely for potential breakout or pullback scenarios. A sustained move above the resistance levels may indicate bullish momentum, while a drop below the support levels could signal bearish sentiment.
Please note that stock market investments are subject to market risks, and it's essential to conduct thorough research or consult with a financial advisor before making investment decisions.
SIGACHI INDUSTRIES LTDAs of May 29, 2025, Sigachi Industries Ltd. (NSE: SIGACHI) is trading at ₹50.35, reflecting a 6.95% increase over the previous close.
📊 Daily Support & Resistance Levels
Based on the latest technical analysis, the key support and resistance levels for Sigachi Industries Ltd. are as follows:
Support Levels:
S1: ₹49.60
S2: ₹48.11
S3: ₹45.88
Resistance Levels:
R1: ₹53.32
R2: ₹55.55
R3: ₹58.00
These levels are derived from pivot point calculations based on the previous trading day's price range.
🔍 Technical Indicators Overview
Relative Strength Index (RSI): The RSI is currently at 87, indicating that the stock is in overbought territory. This suggests that the stock may be due for a short-term correction.
Moving Averages: Sigachi Industries is trading above its 5-day, 10-day, 20-day, 50-day, 100-day, and 200-day simple and exponential moving averages, indicating a strong bullish trend.
MACD (12,26): The MACD is currently at 2.15, suggesting bullish momentum.
📈 Market Sentiment
The technical indicators collectively suggest a strong bullish sentiment for Sigachi Industries Ltd. However, the RSI indicates that the stock is in overbought territory, which may lead to a short-term correction. Investors should monitor the support and resistance levels closely for potential breakout or pullback scenarios.
Please note that stock market investments are subject to market risks, and it's essential to conduct thorough research or consult with a financial advisor before making investment decisions.

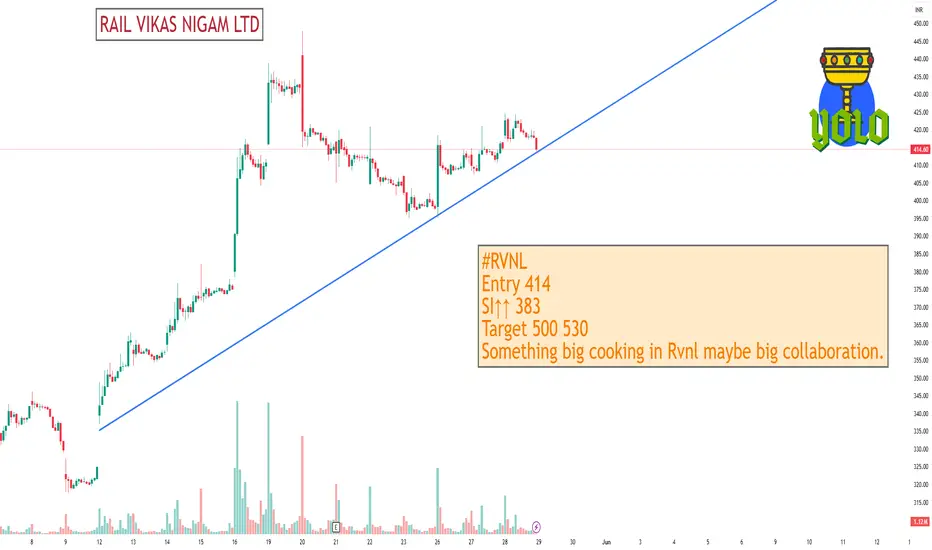
RAIL VIKAS NIGAM LTDAs of May 29, 2025, Rail Vikas Nigam Ltd. (NSE: RVNL) is trading at approximately ₹416.15, reflecting a 0.85% increase over the previous close.
📊 30-Minute Support & Resistance Levels
Based on recent technical analysis and pivot point calculations, the following support and resistance levels are identified for RVNL:
Support Levels:
S1: ₹411.93
S2: ₹407.72
S3: ₹401.43
Resistance Levels:
R1: ₹422.43
R2: ₹428.72
R3: ₹432.93
These levels are derived from the price range of the previous trading day.
🔍 Technical Indicators Overview
Relative Strength Index (RSI): The RSI is currently hovering around 70, indicating that the stock is approaching overbought territory.
Moving Averages: RVNL is trading above its 5-day, 10-day, 20-day, 50-day, 100-day, and 200-day simple and exponential moving averages, indicating a strong bullish trend.
📈 Market Sentiment
The technical indicators collectively suggest a strong bullish sentiment for Rail Vikas Nigam Ltd. However, the RSI indicates that the stock is approaching overbought territory, which may lead to a short-term correction. Investors should monitor the support and resistance levels closely for potential breakout or pullback scenarios.
Please note that stock market investments are subject to market risks, and it's essential to conduct thorough research or consult with a financial advisor before making investment decisions.
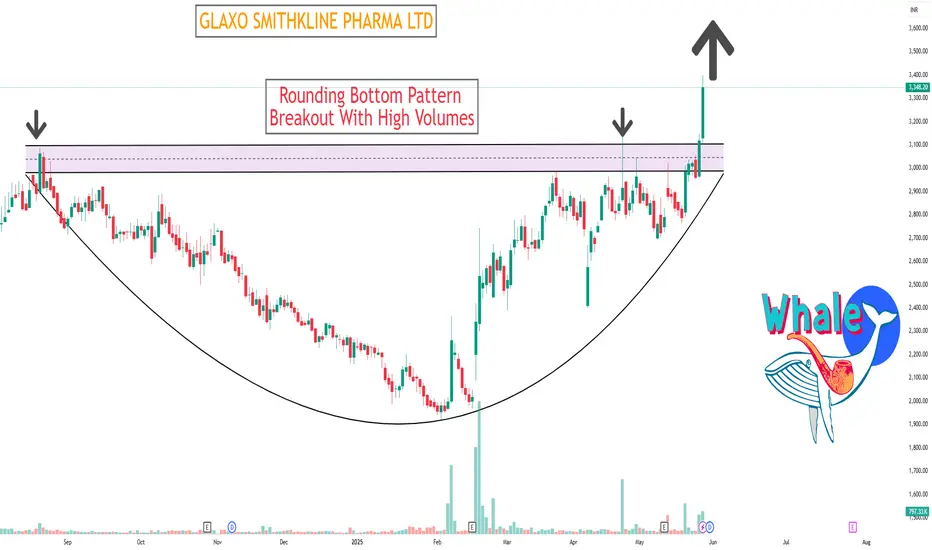
GLAXO SMITHKLINE PHARMA LTDAs of May 29, 2025, GlaxoSmithKline Pharmaceuticals Ltd. (NSE: GLAXO) is trading at ₹3,348.20, reflecting a 7.38% increase over the previous close.
📊 Daily Support & Resistance Levels
Based on the latest technical analysis, the key support and resistance levels are:
Support Levels:
S1: ₹3,174.33
S2: ₹2,998.67
S3: ₹2,887.83
Resistance Levels:
R1: ₹3,460.83
R2: ₹3,571.67
R3: ₹3,747.33
These levels are derived from the price range of the previous trading day.
🔍 Technical Indicators Overview
Relative Strength Index (RSI): The RSI is currently hovering around 70, indicating that the stock is approaching overbought territory.
Moving Averages: GLAXO is trading above its 5-day, 10-day, 20-day, 50-day, 100-day, and 200-day simple and exponential moving averages, indicating a strong bullish trend.
📈 Market Sentiment
The technical indicators collectively suggest a strong bullish sentiment for GlaxoSmithKline Pharmaceuticals Ltd. However, the RSI indicates that the stock is approaching overbought territory, which may lead to a short-term correction. Investors should monitor the support and resistance levels closely for potential breakout or pullback scenarios.
Please note that stock market investments are subject to market risks, and it's essential to conduct thorough research or consult with a financial advisor before making investment decisions.
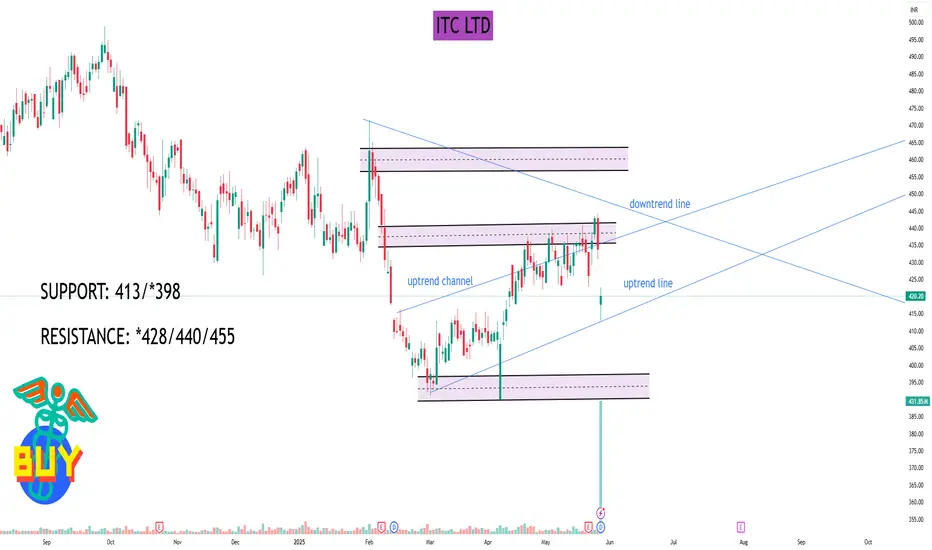
ITC LTD#ITC
STOCK NAME: ITC LTD (NSE)
CHART ANALYSIS: Symmetrical triangle within an uptrend channel.
Approaching apex, breakout or breakdown will give major move. Trading near critical support.
TREND: Consolidation inside Medium-term Uptrend
SUPPORT: 413/*398
RESISTANCE: *428/440/455
TRADE SETUP:
BUY above 428 | SL 416 | Targets 440 / €455
X SELL below *413 | SL 423 | Targets ₹400 / €388
I AM NOT SEBI REGISTERED. THIS IS ONLY FOR EDUCATIONAL PURPOSE.
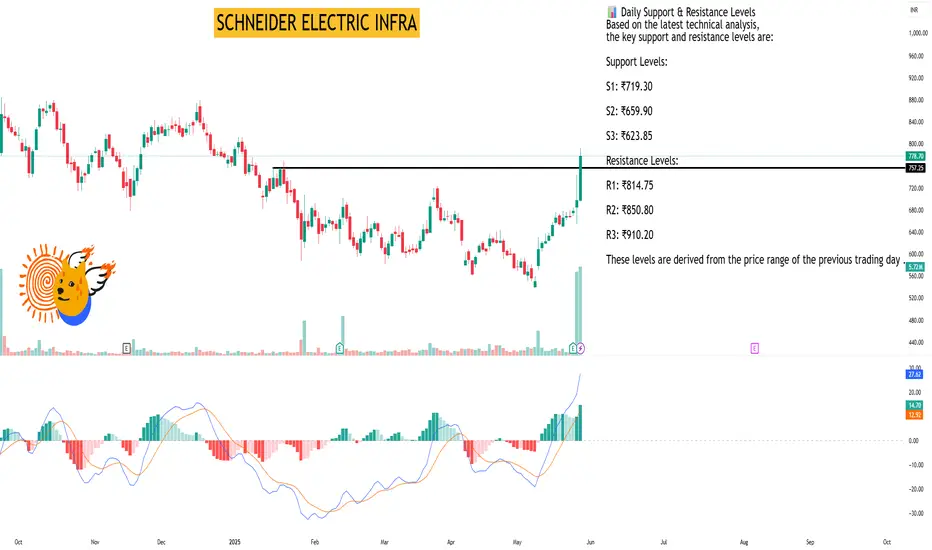
SCHNEIDER ELECTRIC INFRAAs of May 29, 2025, Schneider Electric Infrastructure Ltd. (NSE: SCHNEIDER) is trading at ₹778.70, reflecting an 11.57% increase over the past 24 hours .
📊 Daily Support & Resistance Levels
Based on the latest technical analysis, the key support and resistance levels are:
Support Levels:
S1: ₹719.30
S2: ₹659.90
S3: ₹623.85
Resistance Levels:
R1: ₹814.75
R2: ₹850.80
R3: ₹910.20
These levels are derived from the price range of the previous trading day .
🔍 Technical Indicators Overview
Relative Strength Index (RSI): 79.38 – Indicates overbought conditions.
MACD (12,26): 27.62 – Suggests bullish momentum.
ADX: 28.53 – Points to a strong trend.
Stochastic Oscillator: 90.63 – Suggests overbought territory.
Rate of Change (ROC): 25.57 – Indicates strong upward momentum.
Supertrend: 634.53 – Below current price, indicating bullish trend.
Parabolic SAR (PSAR): 646.47 – Below current price, supporting bullish sentiment.
These indicators collectively suggest a strong bullish trend for Schneider Electric Infrastructure Ltd. .
📈 Market Sentiment
The technical indicators collectively suggest a strong bullish sentiment for Schneider Electric Infrastructure Ltd. However, the RSI and Stochastic Oscillator indicate that the stock is in overbought territory, which may lead to a short-term correction. Investors should monitor the support and resistance levels closely for potential breakout or pullback scenarios.
Please note that stock market investments are subject to market risks, and it's essential to conduct thorough research or consult with a financial advisor before making investment decisions.
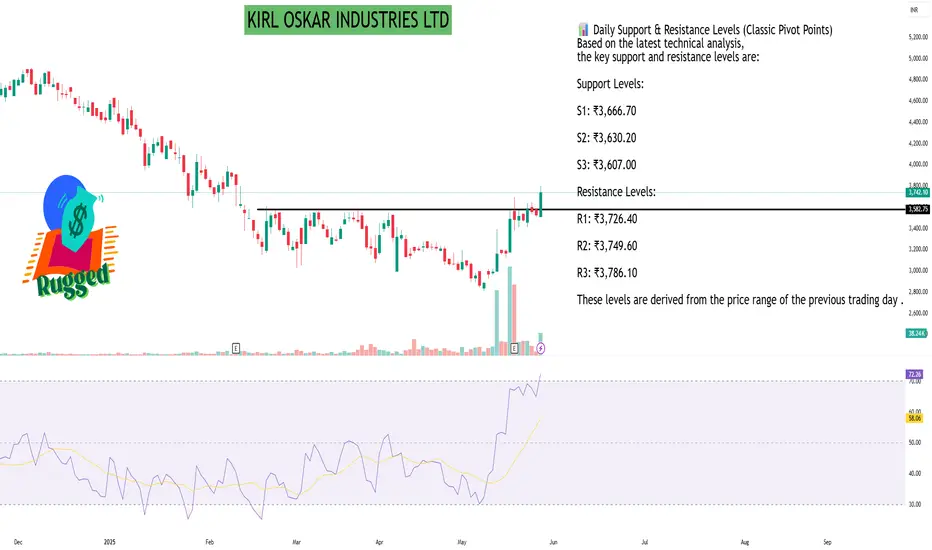
KIRL OSKAR INDUSTRIES LTDAs of May 28, 2025, Kirloskar Industries Ltd. (NSE: KIRLOSIND) is trading at ₹3,739.20, marking a 6.03% increase from the previous close .
📊 Daily Support & Resistance Levels (Classic Pivot Points)
Based on the latest technical analysis, the key support and resistance levels are:
Support Levels:
S1: ₹3,666.70
S2: ₹3,630.20
S3: ₹3,607.00
Resistance Levels:
R1: ₹3,726.40
R2: ₹3,749.60
R3: ₹3,786.10
These levels are derived from the price range of the previous trading day .
📈 Technical Indicators Overview
Relative Strength Index (RSI): 77.5 – Indicates overbought conditions.
MACD (12,26): 47.84 – Suggests bullish momentum.
Commodity Channel Index (CCI): 165.79 – Points to strong upward movement.
Moving Averages: The stock is trading above its 5-day, 10-day, 20-day, 50-day, 100-day, and 200-day simple and exponential moving averages, indicating a strong bullish trend .
🔍 Market Sentiment
The technical indicators collectively suggest a strong bullish sentiment for Kirloskar Industries Ltd. However, the RSI indicates that the stock is in overbought territory, which may lead to a short-term correction. Investors should monitor the support and resistance levels closely for potential breakout or pullback scenarios.
Please note that stock market investments are subject to market risks, and it's essential to conduct thorough research or consult with a financial advisor before making investment decisions.
MANGLORE REFINERY & PETROCHEMICALS LIMITEDAs of May 29, 2025, Mangalore Refinery & Petrochemicals Ltd. (MRPL) is trading at ₹148.83, reflecting a 5.82% increase over the past 24 hours .
📊 Daily Support & Resistance Levels
Based on technical indicators and pivot point analysis, here are the key support and resistance levels for MRPL:
Support Levels:
₹135.08 – Identified as a significant support level across multiple analyses .
₹138.76 – Another support level noted in recent technical assessments .
₹142.37 – Derived from Fibonacci retracement levels .
Resistance Levels:
₹153.75 – Recognized as a primary resistance point .
₹158.68 – A higher resistance level based on pivot point calculations .
₹165.55 – An upper resistance level identified through standard pivot analysis .
🔍 Technical Indicators Overview
Relative Strength Index (RSI): The RSI is currently hovering around 50, indicating a neutral momentum. Values between 45 and 55 suggest a lack of strong bullish or bearish trends .
Moving Averages: MRPL is trading above its 200-day Exponential Moving Average (EMA), which is generally considered a bullish sign, suggesting potential upward momentum .
📈 Market Sentiment
The recent price movement and technical indicators suggest that MRPL is experiencing a neutral to mildly bullish trend. Traders should monitor the support and resistance levels closely for potential breakout or breakdown scenarios.
Please note that stock market investments are subject to market risks, and it's essential to conduct thorough research or consult with a financial advisor before making investment decisions.

Option Chain AnalysisTo effectively analyze an option chain, start by understanding the key components like strike price, open interest, volume, and implied volatility. Then, use this data to assess market sentiment, identify potential support and resistance levels, and develop trading strategies.

Divergence SecretsDivergence trading identifies potential trend reversals or continuations by comparing price action with a technical indicator. When a price makes a new high or low, but an indicator doesn't confirm it, a divergence emerges, suggesting a possible shift in momentum. Traders use this information to make more informed decisions about entering or exiting trades.

Institutional Trading part 6Institutional trading involves large-scale buying and selling of financial instruments, such as stocks, bonds, currencies, and commodities, executed by major organizations like mutual funds, pension funds, insurance firms, and banks.

Institutional Trading part 4Institutional trading refers to the buying and selling of securities on behalf of large organizations or institutions like mutual funds, pension funds, and insurance companies. These institutions manage money for a group of people, often trading in large volumes that can significantly impact the market.

Price Action Trading Price action trading is a strategy where traders make decisions based on the price movements of an asset, rather than relying on technical indicators or other external factors. It involves analyzing historical price patterns and movements to identify potential trading opportunities and predict future price direction.

PCR ( Put Call Ratio) Trading StrategyThe Put Call Ratio (PCR) is a market sentiment indicator calculated by dividing the total volume of put options by the total volume of call options. It's used to gauge whether traders are predominantly betting on a market decline (puts) or rise (calls). A high PCR suggests bearish sentiment, while a low PCR indicates bullish sentiment.

Overview of Financial Markets Financial markets, from the name itself, are a type of marketplace that provides an avenue for the sale and purchase of assets such as bonds, stocks, foreign exchange, and derivatives. Often, they are called by different names, including “Wall Street” and “capital market,” but all of them still mean one and the same thing. Simply put, businesses and investors can go to financial markets to raise money to grow their business and to make more money, respectively.

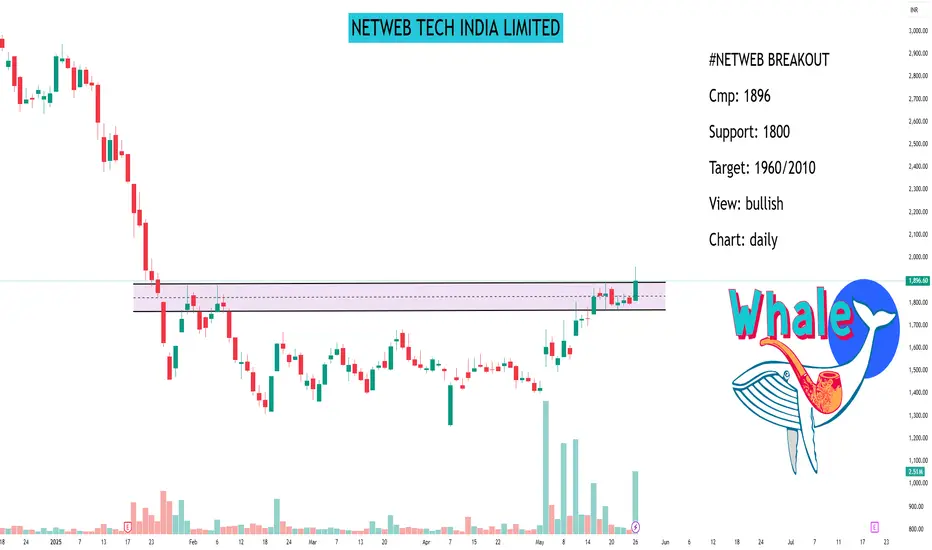
NETWEB TECH INDIA LIMITED#NETWEB BREAKOUT
Cmp: 1896
Support: 1800
Target: 1960/2010
View: bullish
Chart: daily
| Netweb Technologies India is trading 5.51% upper at Rs 1,896.60 as compared to its last closing price. Netweb Technologies India has been trading in the price range of 1,959.75 & 1,823.95. Netweb Technologies India has given -34.03% in this year & -1.85% in the last 5 days. Netweb Technologies India has TTM P/E ratio 74.80 as compared to the sector P/E of 17.79.
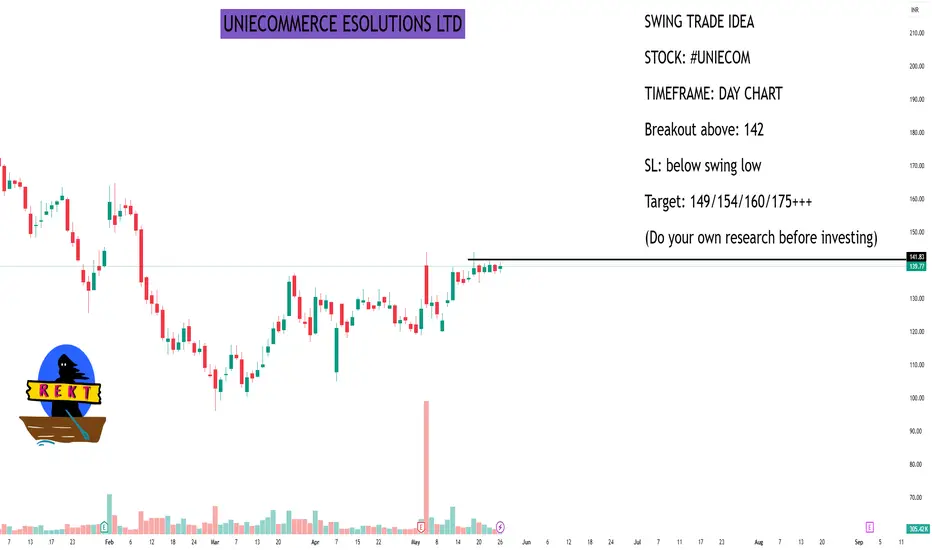
UNIECOMMERCE ESOLUTIONS LTDSWING TRADE IDEA
STOCK: #UNIECOM
TIMEFRAME: DAY CHART
Breakout above: 142
SL: below swing low
Target: 149/154/160/175+++
(Do your own research before investing)