RSI and RSI Divergence RSI: Divergence appears when the RSI's highs or lows diverge from price. For example, if the price makes new lows but the RSI bottoms at higher levels, it signals bullish divergence; if the price makes new highs but the RSI peaks at lower levels, it signals bearish divergence.
NIFTY

Technical Concept A "technical concept" refers to a term or idea that has a specific meaning within a particular technical field, often different from its everyday meaning. These concepts are fundamental to understanding and working within that field.

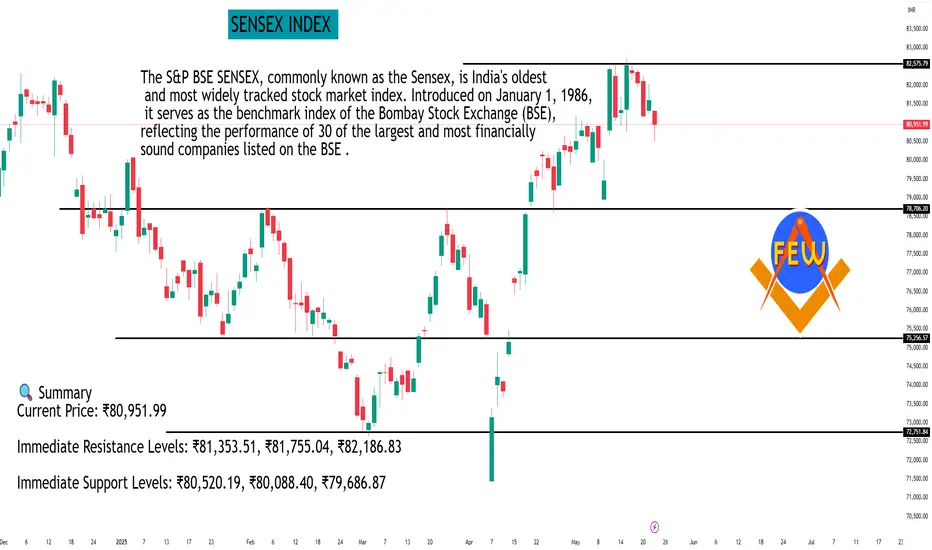
SENSEX INDEX As of the close on May 22, 2025, the BSE Sensex stood at 80,951.99, marking a decline of 0.79% from the previous session.
📊 Daily Support and Resistance Levels
Based on technical analysis, the following support and resistance levels have been identified for the BSE Sensex:
Classic Pivot Points:
Pivot Point: ₹80,921.72
Resistance Levels:
R1: ₹81,353.51
R2: ₹81,755.04
R3: ₹82,186.83
Support Levels:
S1: ₹80,520.19
S2: ₹80,088.40
S3: ₹79,686.87
Fibonacci Pivot Points:
Resistance Levels:
R1: ₹81,240.04
R2: ₹81,436.71
R3: ₹81,755.04
Support Levels:
S1: ₹80,603.39
S2: ₹80,406.72
S3: ₹80,088.40
Camarilla Pivot Points:
Resistance Levels:
R1: ₹81,028.38
R2: ₹81,104.77
R3: ₹81,181.15
Support Levels:
S1: ₹80,875.60
S2: ₹80,799.21
S3: ₹80,722.83
📈 Technical Outlook
The Sensex has entered a negative trend in the last trading session. It is considered bearish until it trades above ₹81,974 on a daily closing basis.
🔍 Summary
Current Price: ₹80,951.99
Immediate Resistance Levels: ₹81,353.51, ₹81,755.04, ₹82,186.83
Immediate Support Levels: ₹80,520.19, ₹80,088.40, ₹79,686.87
Bearish Threshold: A daily close below ₹81,974 indicates a bearish trend.
Traders should monitor these levels closely and consider broader market trends and economic indicators when making investment decisions.
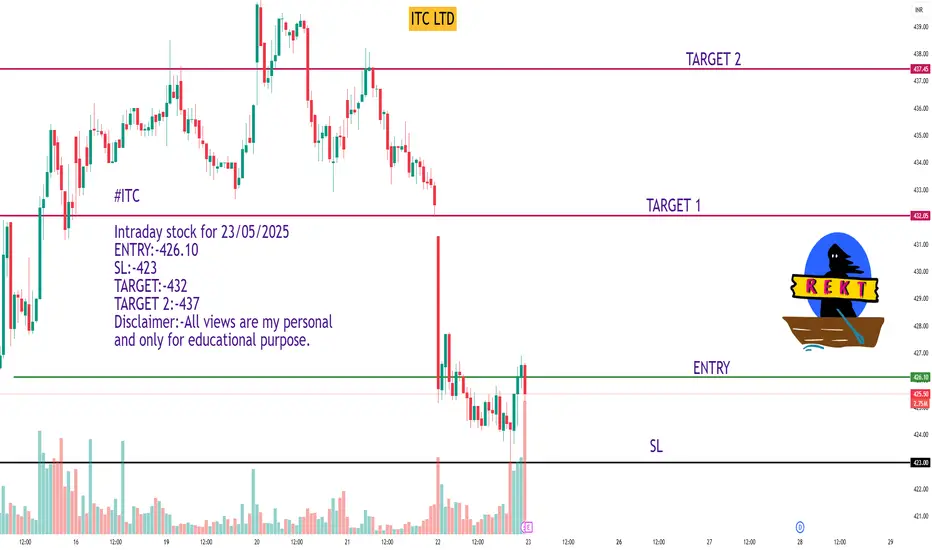
ITC LTD#ITC
Intraday stock for 23/05/2025
ENTRY:-426.10
SL:-423
TARGET:-432
TARGET 2:-437
Disclaimer:-All views are my personal and only for educational purpose.
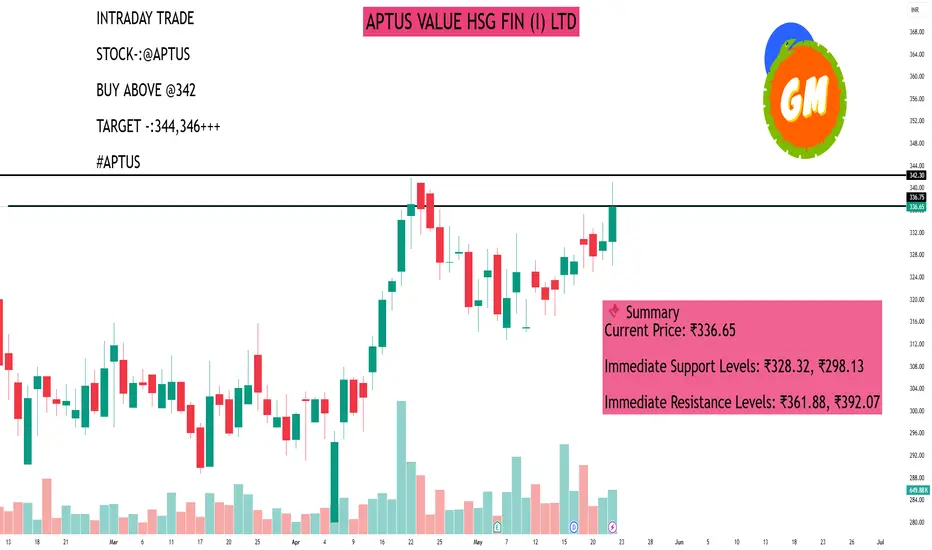
APTUS VALUE HSG FIN (I) LTDAs of May 22, 2025, Aptus Value Housing Finance India Ltd (NSE: APTUS) closed at ₹336.65, marking a 1.89% increase from the previous session.
📊 Daily Support and Resistance Levels
Based on technical analysis, the following support and resistance levels have been identified for Aptus Value Housing Finance India Ltd:
Classic Pivot Points:
Pivot Point: ₹328.32
Support Levels:
S1: ₹298.13
S2: ₹264.57
S3: ₹234.38
Resistance Levels:
R1: ₹361.88
R2: ₹392.07
R3: ₹425.63
Fibonacci Retracement Levels (from recent downtrend):
Resistance Levels:
23.6%: ₹319.49
38.2%: ₹323.75
50%: ₹327.20
61.8%: ₹330.65
76.4%: ₹334.91
📈 Technical Indicators Overview
Relative Strength Index (RSI): 43.56 (indicates a bearish trend)
Stochastic RSI: 11.05 (oversold condition)
MACD: 0.47 (bullish crossover)
Average Directional Index (ADX): 31.01 (indicates a strong trend)
Commodity Channel Index (CCI): -165.91 (suggests the stock is oversold)
📌 Summary
Current Price: ₹336.65
Immediate Support Levels: ₹328.32, ₹298.13
Immediate Resistance Levels: ₹361.88, ₹392.07
Given the current technical indicators and support/resistance levels, traders should exercise caution. Monitoring the stock's movement around these key levels can provide insights into potential trading opportunities. It's advisable to consider these technical factors in conjunction with broader market trends and fundamental analysis before making investment decisions.
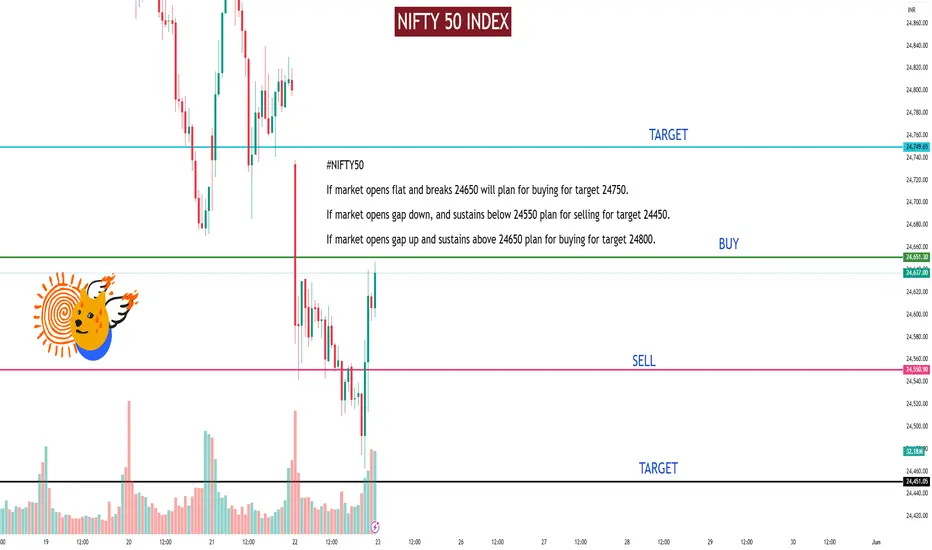
NIFTY 50 INDEXPre Market analysis for 23/05/2025
#NIFTY50
If market opens flat and breaks 24650 will plan for buying for target 24750.
If market opens gap down, and sustains below 24550 plan for selling for target 24450.
If market opens gap up and sustains above 24650 plan for buying for target 24800.
Disclaimer:-All views are my personal and only for educational purpose.
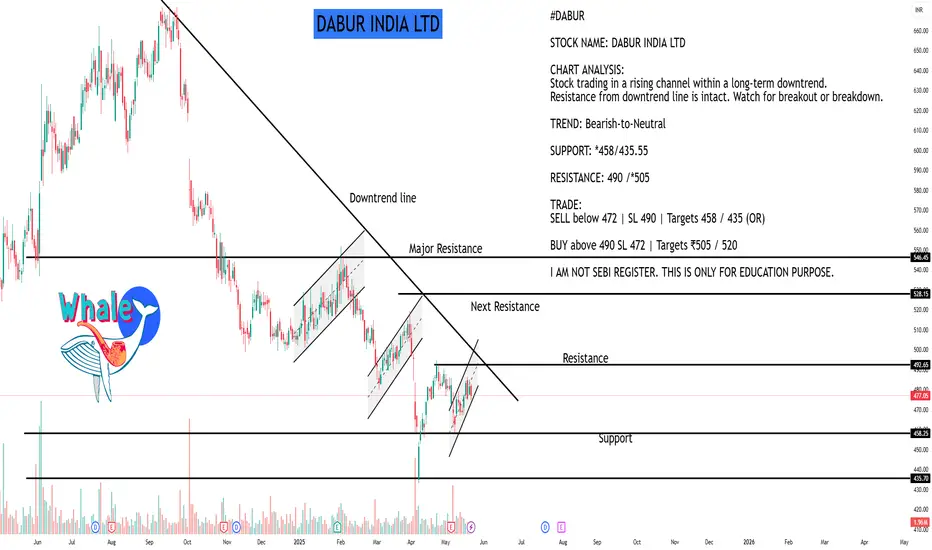
DABUR INDIA LTDAs of May 22, 2025, Dabur India Ltd (NSE: DABUR) closed at ₹477.05, reflecting a 0.98% decline from the previous session.
📊 Daily Support and Resistance Levels
Based on technical analysis, the following support and resistance levels have been identified for Dabur India Ltd:
Classic Pivot Points:
Pivot Point: ₹476.48
Support Levels:
S1: ₹474.61
S2: ₹473.23
S3: ₹471.36
Resistance Levels:
R1: ₹477.86
R2: ₹479.73
R3: ₹481.11
Additional Support and Resistance Levels:
Support: ₹470.28, ₹473.67, ₹478.38
Resistance: ₹481.77, ₹486.48, ₹489.87
📈 Technical Indicators Overview
The current technical indicators suggest a bearish outlook for Dabur India Ltd:
Relative Strength Index (RSI): 43.56 (indicates a bearish trend)
Stochastic RSI: 11.05 (oversold condition)
MACD: 0.47 (bullish crossover)
Average Directional Index (ADX): 31.01 (indicates a strong trend)
Commodity Channel Index (CCI): -165.91 (suggests the stock is oversold)
📌 Summary
Current Price: ₹477.05
Immediate Support Levels: ₹474.61, ₹473.23, ₹471.36
Immediate Resistance Levels: ₹477.86, ₹479.73, ₹481.11
Given the current technical indicators and support/resistance levels, traders should exercise caution. Monitoring the stock's movement around these key levels can provide insights into potential trading opportunities. It's advisable to consider these technical factors in conjunction with broader market trends and fundamental analysis before making investment decisions.
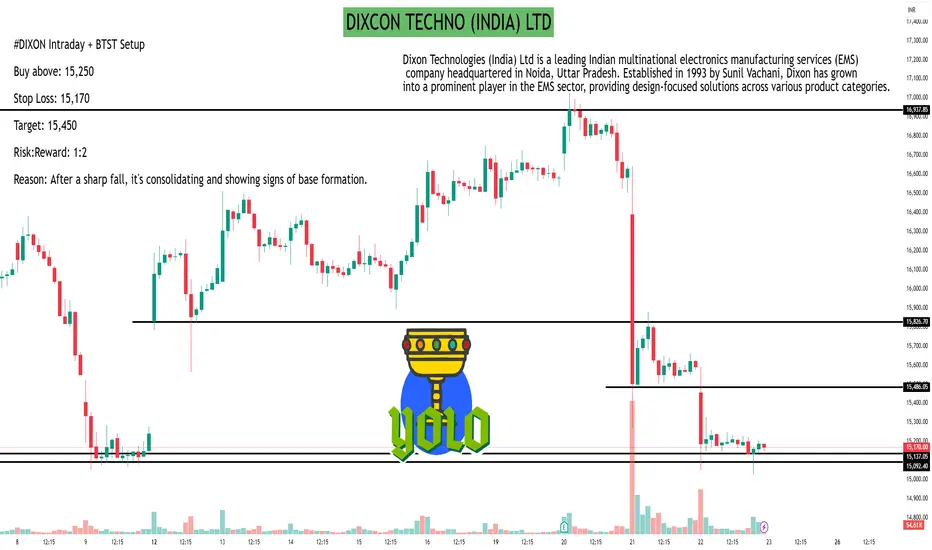
DIXCON TECHNO (INDIA) LTDAs of May 22, 2025, Dixon Technologies (India) Ltd (NSE: DIXON) closed at ₹15,170.00, reflecting a 2.84% decline from the previous close of ₹15,612.00.
30-Minute Support and Resistance Levels
Based on the 30-minute technical analysis, the following pivot points have been identified:
Classic Pivot Points:
Resistance Levels:
R1: ₹15,184.66
R2: ₹15,305.33
R3: ₹15,383.66
Support Levels:
S1: ₹14,985.66
S2: ₹14,907.33
S3: ₹14,786.66
Pivot Point: ₹15,106.33
Fibonacci Pivot Points:
Resistance Levels:
R1: ₹15,182.35
R2: ₹15,229.31
R3: ₹15,305.33
Support Levels:
S1: ₹15,030.31
S2: ₹14,983.35
S3: ₹14,907.33
Pivot Point: ₹15,106.33
Camarilla Pivot Points:
Resistance Levels:
R1: ₹15,082.24
R2: ₹15,100.48
R3: ₹15,118.73
Support Levels:
S1: ₹15,045.76
S2: ₹15,027.52
S3: ₹15,009.27
Pivot Point: ₹15,106.33
These levels can serve as reference points for intraday trading strategies.
Technical Indicators Overview
The current technical indicators suggest a bearish outlook:
Relative Strength Index (RSI): 30.31, indicating the stock is approaching oversold territory.
Moving Average Convergence Divergence (MACD): -311.32, signaling downward momentum.
Average Directional Index (ADX): 53.38, suggesting a strong trend.
Commodity Channel Index (CCI): -112.93, indicating a potential oversold condition.
Rate of Change (ROC): -8.43, reflecting negative momentum.
Bull/Bear Power: -681.10, emphasizing bearish dominance.
Overall, the technical analysis points to a strong sell signal.
Analyst Ratings
Analyst consensus on Dixon Technologies is mixed:
Strong Buy: 8 analysts
Buy: 8 analysts
Hold: 3 analysts
Sell: 6 analysts
Strong Sell: 1 analyst
This distribution indicates a cautious stance among analysts, with a notable number recommending buying the stock, while others advise selling.
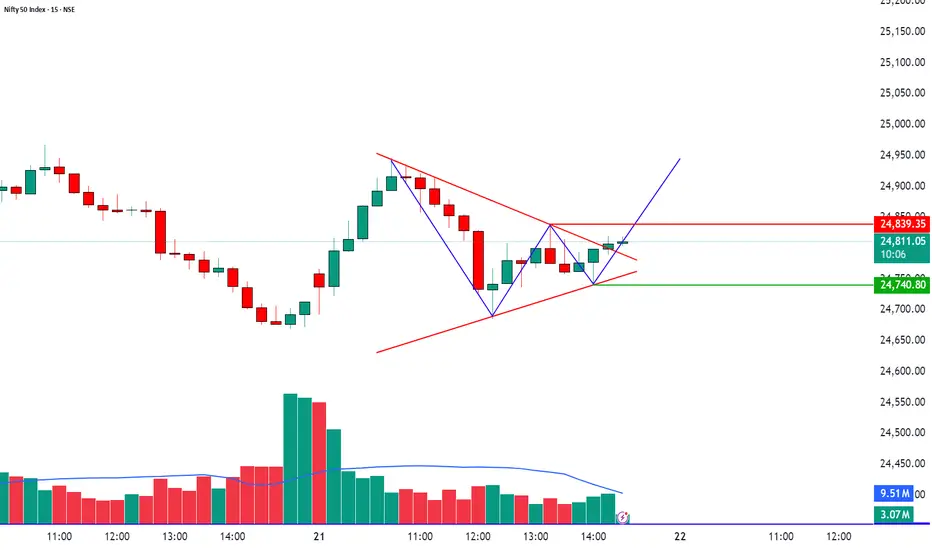
Breakout Building Up from Falling Wedge PatternIndex: Nifty 50
Timeframe: 15-minute
Date: 21st May 2025
Price Action Insight
After a strong sell-off, NIFTY 50 formed a solid V-shaped recovery, followed by a series of higher lows, indicating a shift in momentum from sellers to buyers. Price is now consolidating near a key resistance level at 24,839.35, suggesting a potential breakout or rejection setup.
Chart Patterns in Focus
Falling Wedge (Bullish Reversal)
Breakout occurred after price compressed into the wedge.
A textbook reversal pattern signaling buying interest returning.
Bullish Flag / Pennant Formation
Post-wedge breakout, price is consolidating in a narrow range (flag).
Typically seen as a continuation pattern before another bullish leg.
Trendline Support
Price is holding above an ascending trendline, forming higher lows, reinforcing bullish bias.
Volume Analysis
Volume spiked during the wedge breakout – confirming buyer participation.
Current consolidation shows declining volume, indicating a possible volume expansion ahead.
Watch for a volume surge during breakout or breakdown for trade confirmation.
Educational Insight: How to Read This Setup
Why this matters for traders:
A falling wedge + bullish flag is a high-conviction combo.
Volume contraction during consolidation is healthy and often precedes explosive moves.
Price rejecting or sustaining above resistance gives traders directional edge.
Always wait for confirmation with price action + volume to avoid fakeouts.
Trade Scenarios
✅ Bullish Scenario (Long Trade)
Entry: Above 24,839.35
Target Zones: 24,900 / 24,950
Stop-Loss: Below 24,740.80 (below consolidation and trendline support)
Confirmation: Breakout candle with above-average volume
❌ Bearish Scenario (Short Trade)
Entry: Below 24,740.80
Target Zones: 24,650 / 24,580
Stop-Loss: Above 24,839.35
Confirmation: Breakdown from trendline support + rise in selling volume
Nifty 16th may directionAny kind of gap down
less than 1%, will see a
chance for me to buy and
take it higher
I have been stating 25234 for very long
IT WILL GET HIT

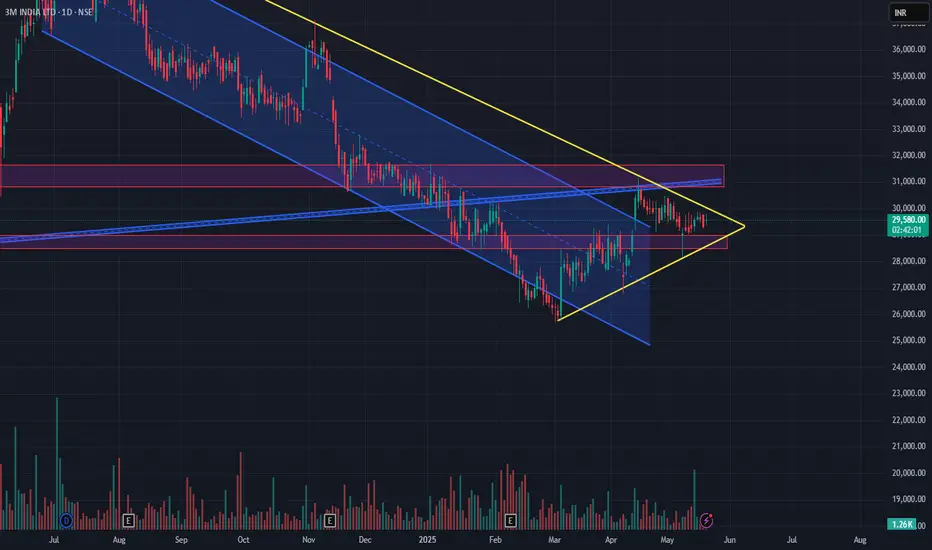
3MINDIA at Breakout Crossroads📅 Chart Type: Daily
📉 Structure Observed: Downtrend Channel → Breakout Attempt → Symmetrical Triangle
📌 Current Price: ₹29,620
🔍 Chart Analysis Summary:
3M India has been under a prolonged downtrend since mid-2023, clearly respecting the falling channel (highlighted in blue). However, since March 2025, a base seems to be forming, and price action has converged into a symmetrical triangle pattern (yellow lines), signaling a potential breakout.
💥 Trade Ideas
✅ Long Trade (High Risk, High Reward):
If price decisively breaks out above the triangle resistance (~₹30,000+), it could be the first real sign of trend reversal after months of weakness. Potential targets could be:
₹31,200 (resistance zone)
₹33,500+ (previous swing highs)
Stop-loss: Below ₹28,800 (lower triangle boundary)
Risk: Moderate-High (False breakout possibility due to low volume)
⚠️ Risky Trade:
Given the triangle formation at the end of a downtrend, this could also be a bearish continuation pattern. A fake breakout followed by rejection could trap bulls.
💡 Avoid trading until confirmation (volume spike + close above resistance or breakdown)
📉 Short Trade:
If price breaks below ₹28,800 with volume, the stock could revisit:
₹27,000 (March support)
₹25,000 (channel support retest)
Stop-loss: ₹30,100 (triangle resistance)
Risk: Medium
Reward: High if channel resumes downward
🔁 Swing Trade Perspective:
This setup is ideal for swing traders who thrive on breakouts or breakdowns from tight consolidations.
📈 Breakout Swing: Enter above ₹30,000 with target ₹33,500
📉 Breakdown Swing: Enter below ₹28,800 with target ₹25,000
🧠 Wait for confirmation candle (daily close + volume) before entry.
📌 Key Zones to Watch:
Resistance: ₹30,000 – ₹31,200
Support: ₹28,800, ₹27,000
Volume Spike: Needed to confirm move direction
🧠 Final Thoughts:
This is a make-or-break level for 3M India. Traders should be cautious but alert. Whether you're bullish or bearish, this consolidation is unlikely to last much longer — and a sharp move is imminent.
"In the market, the biggest profits often come from waiting for the right setup. This might be one."
📉💰 Trade responsibly. Always manage your risk.
Institution Trading Strategies part 5Institutional traders incorporate strategies that emphasize both long-term value and diversification in their trading practices. They leverage significant amounts of capital to build portfolios diversified across multiple assets, which helps reduce risk while seeking improved market prices.

Institution Trading part 4Institutional trading involves the buying and selling of large quantities of financial assets, typically conducted by institutional investors like hedge funds, mutual funds, and pension funds. These entities manage money for others and trade in securities, including stocks, bonds, and derivatives.

Support and Resistance part 2Support is a price point below the current market price that indicate buying interest. Resistance is a price point above the current market price that indicate selling interest. S&R can be used to identify targets for the trade. For a long trade, look for the immediate resistance level as the target.

Basic to Advance Trading The very best way to get into trading is to find a platform you trust, learn as much as you can about trading beforehand and then practise to get your skill, technique and strategies right. Thereafter, all that remains to be done is to create a trading plan and open a live account.

Divergence Trading Divergence occurs when the stochastic oscillator's peaks or troughs disagree with the price. For instance, if the stochastic makes lower highs while the price is rising, it indicates a bearish divergence. Likewise, higher stochastic lows against lower price lows indicate a bullish divergence.

Price Action Trading Price action trading is a strategy where traders make decisions based on the movement of an asset's price, without relying heavily on technical indicators. It focuses on understanding price patterns, trends, and key levels like support and resistance to anticipate future market direction.

Put and Call RatioThe put-call ratio (PCR) is a technical indicator in options trading that reflects the overall sentiment of the market. It compares the volume of put options traded to the volume of call options traded. Put options give the holder the right to sell an asset at a specific price, while call options give the right to buy it.

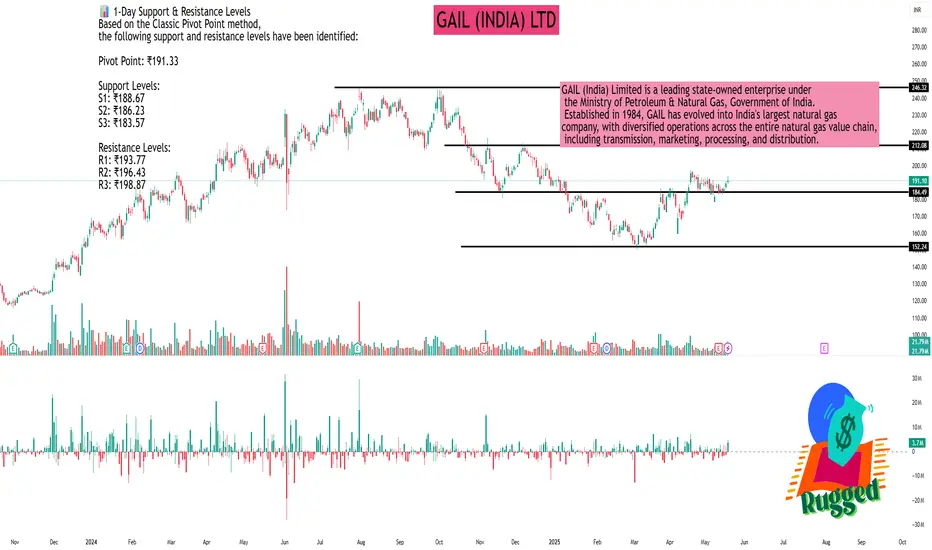
GAIL (INDIA) LTDAs of May 21, 2025, GAIL (India) Ltd. (NSE: GAIL) is trading at ₹191.10, reflecting a 0.86% increase from the previous close.
📊 1-Day Support & Resistance Levels
Based on the Classic Pivot Point method, the following support and resistance levels have been identified:
Pivot Point: ₹191.33
Support Levels:
S1: ₹188.67
S2: ₹186.23
S3: ₹183.57
Resistance Levels:
R1: ₹193.77
R2: ₹196.43
R3: ₹198.87
📈 Technical Indicators
Relative Strength Index (RSI): 60.63 – Indicates bullish momentum.
MACD (12,26): 1.34 – Suggests a bullish crossover.
Average Directional Index (ADX): 35.59 – Reflects a strong trend.
Commodity Channel Index (CCI): 48.46 – Neutral.
Rate of Change (ROC): 2.75 – Positive momentum.
Money Flow Index (MFI): Not specified.
📉 Moving Averages
50-day EMA: ₹226.29
200-day EMA: Not specified.
The current price is below the 50-day EMA, indicating a potential bearish trend in the short term.
🔍 Market Outlook
GAIL (India) Ltd. is exhibiting mixed signals. While technical indicators like RSI and MACD suggest bullish momentum, the stock trading below its 50-day EMA indicates caution. Traders should monitor the support and resistance levels closely; a breach above R1 (₹193.77) could indicate further upside, while a drop below S1 (₹188.67) might suggest a potential decline.
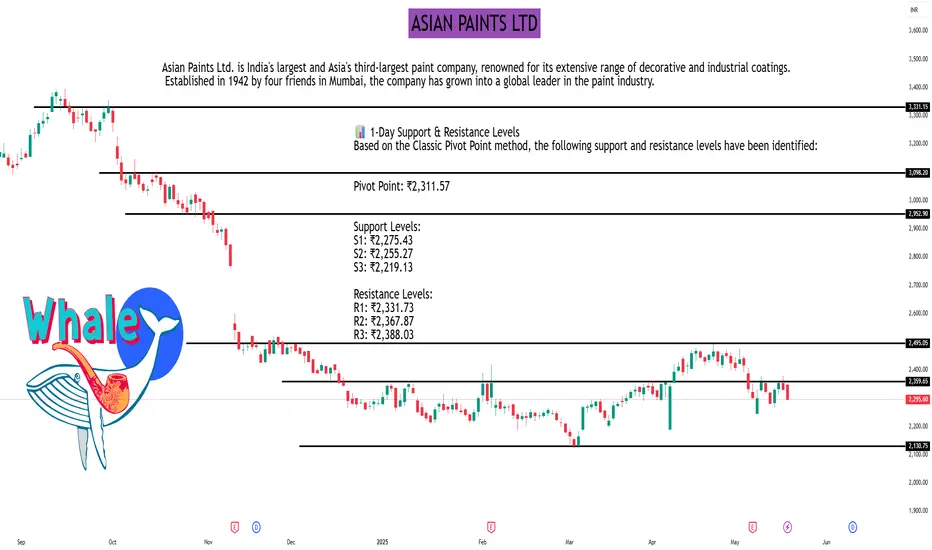
ASIAN PAINTS LTDAs of May 21, 2025, Asian Paints Ltd. (NSE: ASIANPAINT) closed at ₹2,295.60, reflecting a 1.54% decline from the previous day. The stock is currently trading approximately 32% below its 52-week high of ₹3,394.00, reached on September 16, 2024.
📊 1-Day Support & Resistance Levels
Based on the Classic Pivot Point method, the following support and resistance levels have been identified:
Pivot Point: ₹2,311.57
Support Levels:
S1: ₹2,275.43
S2: ₹2,255.27
S3: ₹2,219.13
Resistance Levels:
R1: ₹2,331.73
R2: ₹2,367.87
R3: ₹2,388.03
📈 Technical Indicators
Relative Strength Index (RSI): 41.88 – Indicates neutral momentum.
Moving Average Convergence Divergence (MACD): -15.56 – Suggests bearish momentum.
Average Directional Index (ADX): 17.09 – Reflects a weak trend strength.
Rate of Change (ROC): -5.80 – Points to a declining price momentum.
Money Flow Index (MFI): 29.47 – Indicates potential oversold conditions.
Supertrend: ₹2,468.26 – The current price is below this level, signaling a bearish trend.
📉 Moving Averages
50-day Simple Moving Average (SMA): ₹2,342.83
100-day SMA: ₹2,304.44
200-day SMA: ₹2,614.84
The current price is below all these moving averages, indicating a bearish outlook.
🔍 Market Outlook
Asian Paints Ltd. is exhibiting bearish signals across multiple technical indicators. The stock's position below key moving averages and a declining RSI suggest continued downward pressure. Traders should monitor the support levels closely; a breach below S1 (₹2,275.43) could indicate further downside, while a move above R1 (₹2,331.73) might suggest a potential reversal.
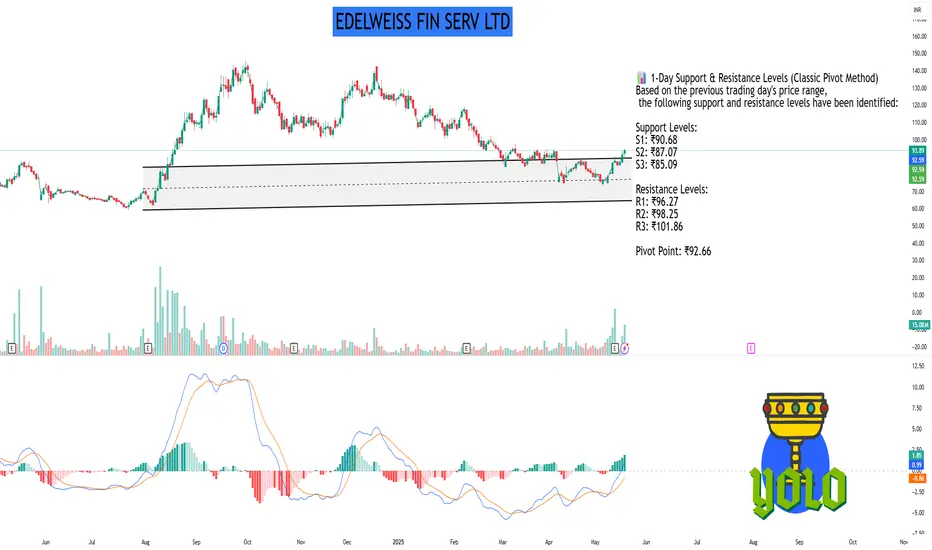
EDELWEISS FIN SERV LTDAs of May 21, 2025, Edelweiss Financial Services Ltd. (NSE: EDELWEISS) is trading at ₹93.89, marking a 2.84% increase over the previous day.
TradingView
📊 1-Day Support & Resistance Levels (Classic Pivot Method)
Based on the previous trading day's price range, the following support and resistance levels have been identified:
Support Levels:
S1: ₹90.68
S2: ₹87.07
S3: ₹85.09
Resistance Levels:
R1: ₹96.27
R2: ₹98.25
R3: ₹101.86
Pivot Point: ₹92.66
🔍 Technical Indicators
Relative Strength Index (RSI): 58.01 (indicates uptrend)
Commodity Channel Index (CCI): 62.68 (indicates uptrend)
Money Flow Index (MFI): 74.25 (indicates strong uptrend)
📈 Moving Averages
20-day EMA: ₹90.32
50-day EMA: ₹88.93
100-day EMA: ₹86.66
200-day EMA: ₹84.35
📝 Trading Insights
The current price is above the pivot point, suggesting a bullish stance. If the price continues to rise, it may test the resistance levels. Conversely, a drop below the pivot could lead to testing the support levels.
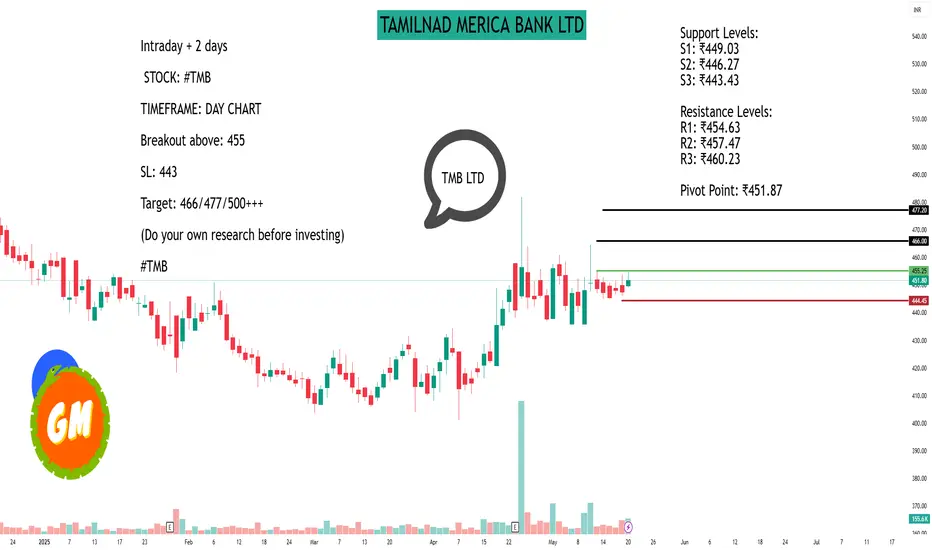
TAMILNAD MERICA BANK LTDAs of May 21, 2025, Tamilnad Mercantile Bank Ltd. (NSE: TMB) is trading at ₹451.80, reflecting a 0.97% increase over the previous day.
📊 1-Day Support & Resistance Levels (Classic Pivot Method)
Based on the previous trading day's price range, the following support and resistance levels have been identified:
Support Levels:
S1: ₹449.03
S2: ₹446.27
S3: ₹443.43
Resistance Levels:
R1: ₹454.63
R2: ₹457.47
R3: ₹460.23
Pivot Point: ₹451.87
📈 Technical Indicators
Moving Averages:
20-day EMA: ₹444.47
50-day EMA: ₹437.38
100-day EMA: ₹438.24
200-day EMA: ₹446.85
Oscillators:
Relative Strength Index (RSI 14): 58.01 (indicates uptrend)
Commodity Channel Index (CCI 14): 62.68 (indicates uptrend)
Money Flow Index (MFI): 74.25 (indicates strong uptrend)
🔍 Trading Insights
The current price is slightly below the pivot point, suggesting a neutral to slightly bullish stance. If the price moves above the pivot point, it may test the resistance levels. Conversely, a drop below the pivot could lead to testing the support levels.
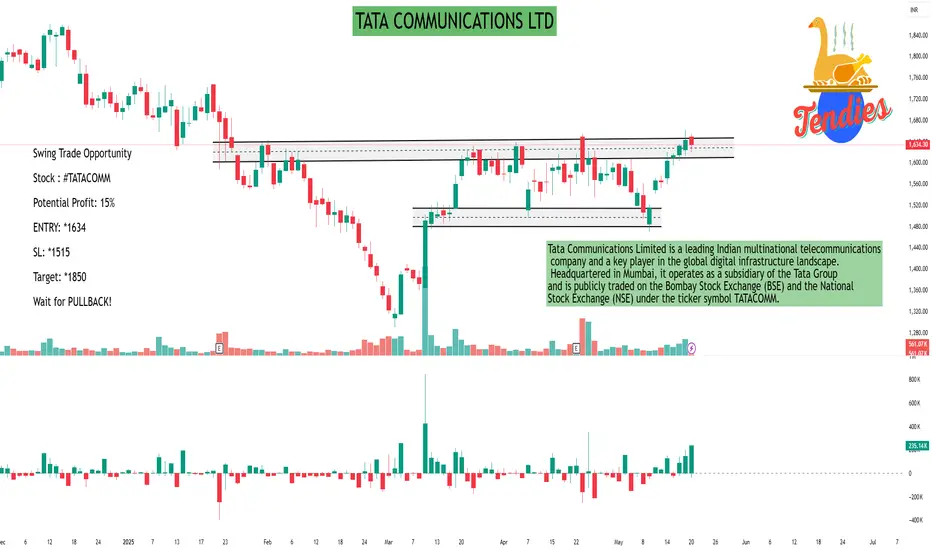
TATA COMMUNICATIONS LTDTata Communications Limited is a leading Indian multinational telecommunications company and a key player in the global digital infrastructure landscape. Headquartered in Mumbai, it operates as a subsidiary of the Tata Group and is publicly traded on the Bombay Stock Exchange (BSE) and the National Stock Exchange (NSE) under the ticker symbol TATACOMM.
🏢 Company Overview
Founded: 1986 as Videsh Sanchar Nigam Limited (VSNL); rebranded to Tata Communications in 2008.
Ownership: Majority-owned by Tata Group (58.87%), with the remaining shares held by public investors.
Global Reach: Operates in over 190 countries and territories, carrying approximately 30% of the world's internet routes.
Leadership:
MD & CEO: Amur Lakshminarayanan
Chairperson: Renuka Ramnath
🌐 Services & Solutions
Tata Communications positions itself as a digital ecosystem enabler, offering a comprehensive suite of services:
Network & Connectivity: Global IP networks, Ethernet, MPLS, and SD-WAN solutions.
Cloud & Edge Computing: Multi-cloud connectivity, edge computing platforms, and managed cloud services.
Cybersecurity: Advanced threat detection, cloud security, and managed security services.
Unified Communications: Solutions like GlobalRapide and JAMVEE for seamless collaboration.
IoT & Mobility: IoT connectivity solutions, including LoRaWAN and private networks.
Content Delivery: Robust CDN services for optimized content delivery.
These offerings cater to diverse industries, including automotive, manufacturing, logistics, aviation, and retail.
📈 Financial Highlights
In the first quarter of fiscal year 2024, Tata Communications reported:
Revenue: ₹56.33 billion (approx. $673.4 million), marking an 18% year-over-year increase.
Data Services Growth: 20% rise, contributing over 80% to total revenue.
Digital Portfolio Expansion: 52% growth, driven by increased demand for digital services.
Net Profit: ₹3.33 billion, a 13% decline due to a 20% rise in expenses.
EBITDA Margin: Contracted to 20% from 21.5% the previous year.
The company aims to achieve data business revenue of ₹280 billion by FY27, up from ₹178.98 billion in FY24.
🔄 Strategic Initiatives
Acquisition of Kaleyra: In October 2023, Tata Communications acquired Kaleyra, a Communications Platform as a Service (CPaaS) company, enhancing its capabilities in cloud communications and customer engagement.
Infrastructure Expansion: Continues to invest in subsea cable systems, including the Tata Global Network, to strengthen global connectivity.
Digital Transformation Focus: Emphasizes enabling digital transformation for enterprises, supporting borderless growth and innovation.