MACD ( Moving Average Convergence Divergence)When To Use And How To Read The MACD Indicator - short for Moving Average Convergence Divergence, is a popular momentum indicator in technical analysis used to identify trends and potential reversals in stock prices. It's a tool that helps traders understand the strength, direction, and duration of a trend by analyzing the relationship between two moving averages.
NIFTY

Technical Conpet"Technical Concept" refers to a specialized knowledge or understanding of technical aspects, often within a particular field like engineering, computer science, or a specific industry. It's not a standardized term with a single, fixed meaning, but rather a concept that can be interpreted in various ways depending on the context.

Option TradingIn trading, an option is a contract that gives the holder the right, but not the obligation, to buy or sell an underlying asset (like a stock, ETF, or commodity) at a predetermined price (the strike price) before a specific date (the expiration date). There are two main types: call options (the right to buy) and put options (the right to sell).

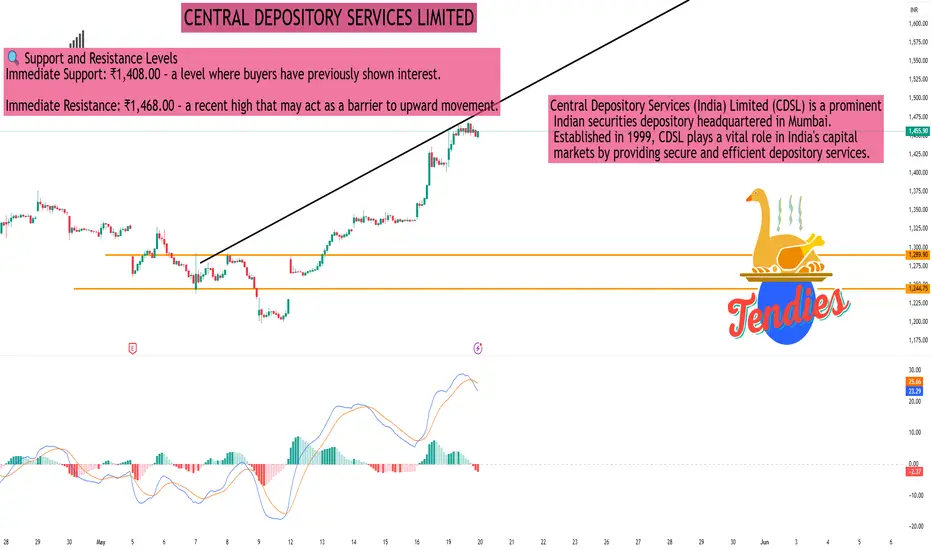
CENTRAL DEPOSITORY SERVICES LIMITEDAs of the close on Monday, May 19, 2025, Central Depository Services (India) Ltd (NSE: CDSL) was trading at ₹1,450.80, marking a 2.98% increase from the previous session.
📊 30-Minute Timeframe Technical Overview
Price Action:
Day's Range: ₹1,408.00 – ₹1,468.00
52-Week Range: ₹1,047.45 – ₹2,989.00
Volume: Approximately 9.5 million shares traded, indicating heightened market activity.
Technical Indicators:
Relative Strength Index (RSI): 69.89 – approaching overbought territory, suggesting caution.
Moving Average Convergence Divergence (MACD): 36.23 – indicating bullish momentum.
Average Directional Index (ADX): 16.44 – suggesting a weak trend strength.
Stochastic Oscillator: 80.92 – in the overbought zone, which may precede a price correction.
Indicator: ₹1,280.03 – acting as a support level.
Parabolic SAR (PSAR): ₹1,209.57 – indicating an upward trend.
🔍 Support and Resistance Levels
Immediate Support: ₹1,408.00 – a level where buyers have previously shown interest.
Immediate Resistance: ₹1,468.00 – a recent high that may act as a barrier to upward movement.
🔭 Outlook
The technical indicators suggest that CDSL is experiencing a strong bullish trend. However, the RSI and Stochastic Oscillator indicate that the stock is nearing overbought conditions, which could lead to a short-term consolidation or minor correction. Investors should monitor the support and resistance levels closely and consider the heightened trading volume, which may affect the strength of the current trend.
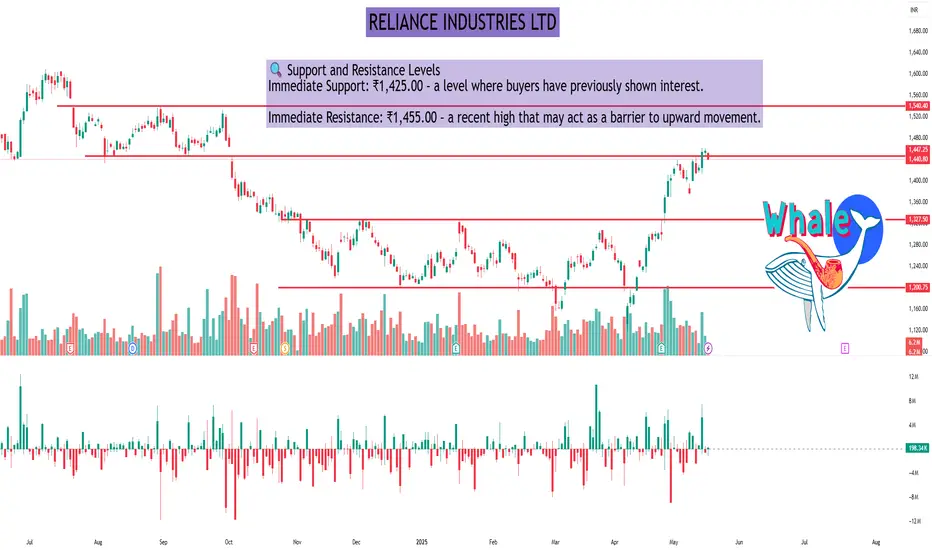
RELIANCE INDUSTRIES LTDAs of the close on Monday, May 19, 2025, Reliance Industries Ltd (NSE: RELIANCE) traded at ₹1,440.80, reflecting a 1.07% decrease from the previous session.
📊 Daily Technical Overview
Price Action:
Opening Price: ₹1,452.10
Day's Range: ₹1,438.20 – ₹1,454.60
52-Week Range: ₹1,114.85 – ₹1,608.80
Volume: Approximately 6.2 million shares traded, below the 50-day average of 8.4 million, indicating reduced market activity.
Technical Indicators:
Relative Strength Index (RSI): 69.84 – approaching overbought territory, suggesting caution.
Moving Average Convergence Divergence (MACD): Bullish crossover, indicating potential upward momentum.
Stochastic Oscillator: 76.17 – in the overbought zone, which may precede a price correction.
Average Directional Index (ADX): Indicates a strong trend, supporting the current price movement.
🔍 Support and Resistance Levels
Immediate Support: ₹1,425.00 – a level where buyers have previously shown interest.
Immediate Resistance: ₹1,455.00 – a recent high that may act as a barrier to upward movement.
🔭 Outlook
The technical indicators suggest that Reliance Industries Ltd is experiencing a strong bullish trend. However, the RSI and Stochastic Oscillator indicate that the stock is nearing overbought conditions, which could lead to a short-term consolidation or minor correction. Investors should monitor the support and resistance levels closely and consider the reduced trading volume, which may affect the strength of the current trend.
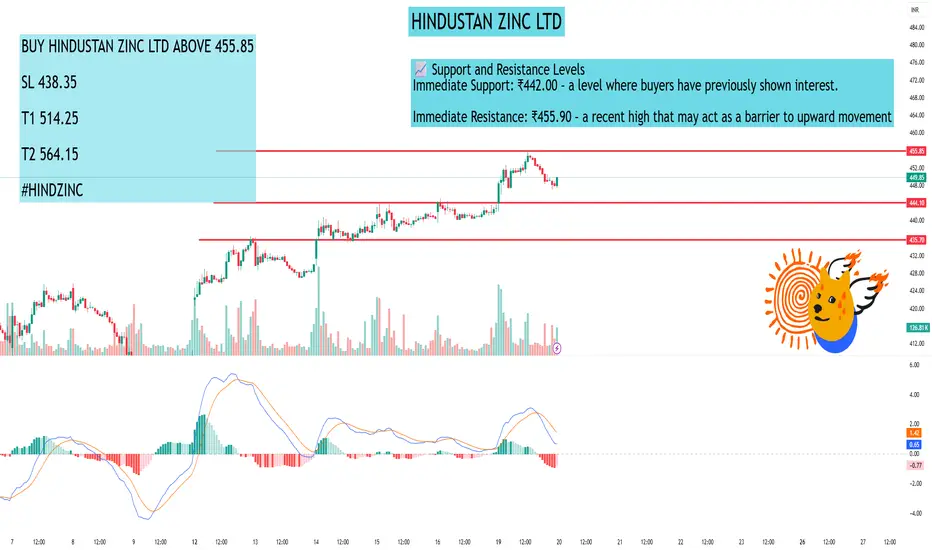
HINDUSTAN ZINC LTDAs of the close on Monday, May 19, 2025, Hindustan Zinc Ltd (NSE: HINDZINC) was trading at ₹448.20, reflecting a 1.33% increase from the previous session.
📊 15-Minute Timeframe Technical Overview
Analyzing the 15-minute chart, the stock exhibits a mild bullish trend:
Price Action: The current price is ₹428.25.
Moving Averages:
The 5-period Exponential Moving Average (EMA) is at ₹440.66.
The 15-period EMA stands at ₹435.01.
The 50-period EMA is at ₹435.91.
The 100-period EMA is at ₹446.19.
The 15-period EMA trending above the 50-period EMA indicates a bullish crossover.
Trend Analysis: The 5 and 15 EMAs are on an upward trajectory, suggesting a mild bullish sentiment in the short term.
🔍 Technical Indicators
Relative Strength Index (RSI): The RSI is approximately 56.70, indicating a neutral momentum without being overbought or oversold.
Moving Average Convergence Divergence (MACD): The MACD is at 0.811, suggesting a bullish crossover.
Average Directional Index (ADX): The ADX is at 13.22, indicating a weak trend strength.
Stochastic Oscillator: The Stochastic Oscillator is at 63.96, pointing to neutral momentum.
Indicator: The supertrend is at ₹406.99, acting as a support level.
Parabolic SAR (PSAR): The PSAR is at ₹400.77, indicating an upward trend.
📈 Support and Resistance Levels
Immediate Support: ₹442.00 – a level where buyers have previously shown interest.
Immediate Resistance: ₹455.90 – a recent high that may act as a barrier to upward movement.
🔭 Outlook
The current indicators suggest a cautious approach:
If the price sustains above ₹442.00, there may be potential for a rebound towards ₹455.90.
Conversely, a drop below ₹442.00 could lead to further declines, possibly testing lower support levels.
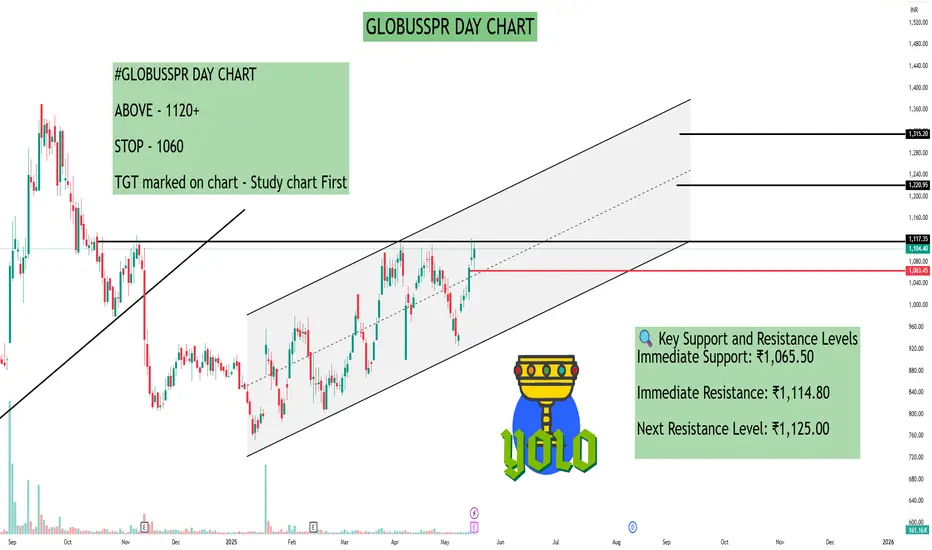
GLOBUSSPR DAY CHARTAs of the close on Monday, May 19, 2025, Globus Spirits Ltd (NSE: GLOBUSSPR) traded at ₹1,104.40, reflecting a 1.62% increase from the previous session.
📊 Daily Technical Overview
Price Action:
Day's Range: ₹1,065.50 – ₹1,114.80
52-Week Range: ₹670.00 – ₹1,369.75
Volume: 161,165 shares traded
Technical Indicators:
Relative Strength Index (RSI): 61.68 – indicating neutral to slightly bullish momentum.
Moving Average Convergence Divergence (MACD): 6.03 – suggesting a bullish crossover.
Average Directional Index (ADX): 15.29 – indicating a weak trend strength.
Stochastic Oscillator: 62.44 – pointing to neutral momentum.
Indicator: ₹957.02 – acting as a support level.
Parabolic SAR (PSAR): ₹927.02 – indicating an upward trend.
🔍 Key Support and Resistance Levels
Immediate Support: ₹1,065.50
Immediate Resistance: ₹1,114.80
Next Resistance Level: ₹1,125.00
📈 Outlook
The technical indicators suggest that Globus Spirits Ltd is experiencing a mild bullish trend. The RSI and MACD indicate positive momentum, while the ADX suggests that the trend strength is currently weak. If the stock maintains its position above the immediate support level of ₹1,065.50, it may attempt to break through the resistance at ₹1,114.80. A successful breakout could lead to testing the next resistance level at ₹1,125.00.
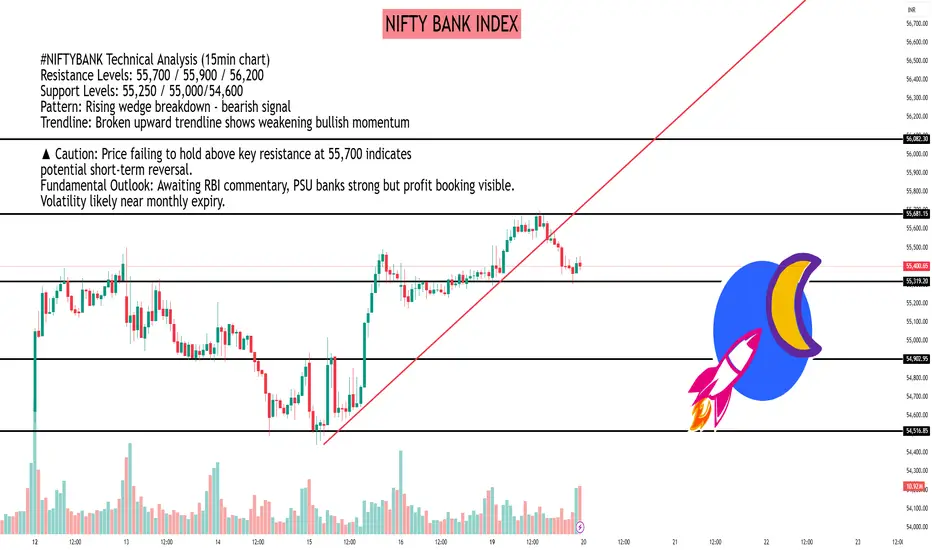
NIFTY BANK INDEX #NIFTYBANK Technical Analysis (15min chart)
Resistance Levels: 55,700 / 55,900 / 56,200
Support Levels: 55,250 / 55,000/54,600
Pattern: Rising wedge breakdown - bearish signal
Trendline: Broken upward trendline shows weakening bullish momentum
▲ Caution: Price failing to hold above key resistance at 55,700 indicates
potential short-term reversal.
Fundamental Outlook: Awaiting RBI commentary, PSU banks strong but profit booking visible. Volatility likely near monthly expiry.
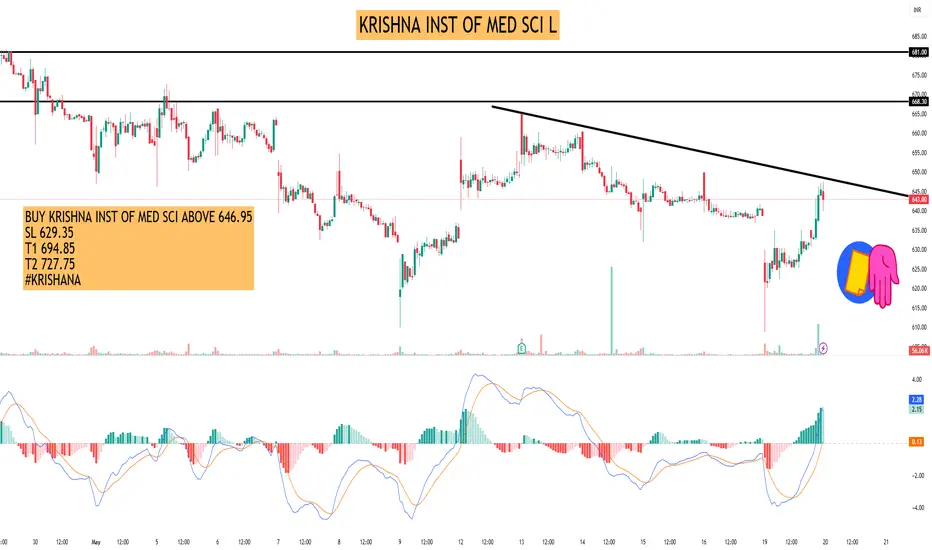
KRISHNA INST OF MED SCI LAs of the close on Monday, May 19, 2025, Krishna Institute of Medical Sciences Ltd (NSE: KIMS) traded at ₹645.10, marking a 0.75% increase from the previous session.
📊 15-Minute Timeframe Technical Overview
Analyzing the 15-minute chart, the stock exhibits a mild bearish trend:
Price Action: The current price is ₹535.65.
Moving Averages:
The 5-period Weighted Moving Average (WMA) is at ₹535.65.
The 15-period WMA stands at ₹536.93.
The 100-period WMA is at ₹542.10.
The 15-period WMA trending below the 100-period WMA indicates a bearish crossover.
Trend Analysis: Both the 5 and 15 WMAs are on a downward trajectory, suggesting a mild bearish sentiment in the short term.
🔍 Technical Indicators
Relative Strength Index (RSI): The 14-day RSI is approximately 54.7, indicating a neutral momentum without being overbought or oversold.
Volume: The trading volume is around 507,339 shares, significantly higher than the 20-day average of 91,758 shares, pointing to increased market activity.
📈 Support and Resistance Levels
Support: ₹640.00 – a level where buyers have previously shown interest.
Resistance: ₹650.00 – a recent high that may act as a barrier to upward movement.
🔭 Outlook
The current indicators suggest a cautious approach:
If the price sustains above ₹640.00, there may be potential for a rebound towards ₹650.00.
Conversely, a drop below ₹640.00 could lead to further declines, possibly testing lower support levels.
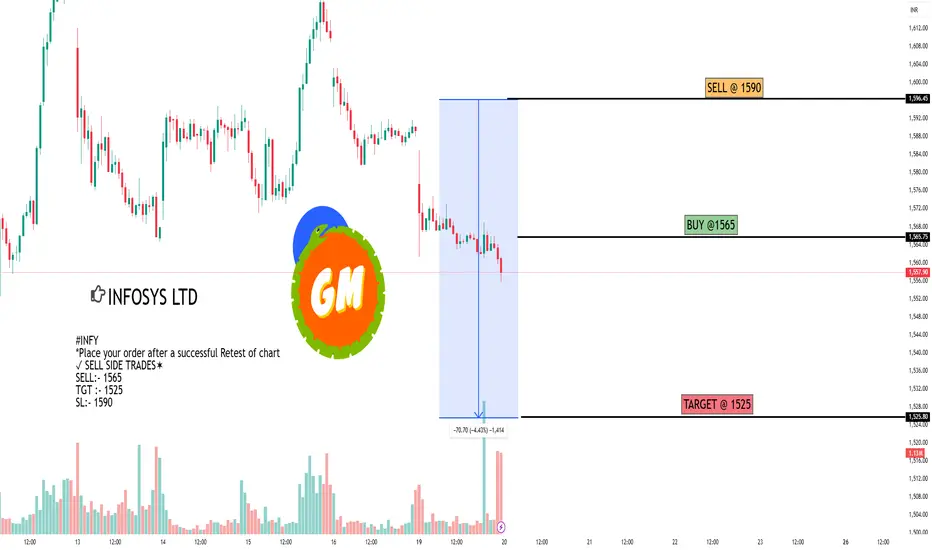
INFOSYS LTDAs of the close on Monday, May 19, 2025, Infosys Ltd (NSE: INFY) traded at ₹1,559.80, reflecting a decrease of ₹30.10 or 1.89% from the previous session.
In the 15-minute timeframe, the stock exhibited a downward trend throughout the day, with prices ranging between ₹1,555.70 and ₹1,585.00.
Technical Indicators (15-Minute Timeframe):
Moving Averages: The 20-period Exponential Moving Average (EMA) is trending downward, indicating short-term bearish momentum.
Relative Strength Index (RSI): The RSI is hovering around 45, suggesting that the stock is approaching oversold territory but hasn't reached it yet.
Support Levels: Immediate support is observed around ₹1,550, with a stronger support level near ₹1,540.
Resistance Levels: The stock faces resistance at ₹1,570, followed by a more significant resistance near ₹1,585.
Outlook:
If Infosys maintains its position above the ₹1,550 support level, a short-term rebound towards ₹1,570 is possible. However, a break below ₹1,550 could lead to further declines, potentially testing the ₹1,540 support.
Support and Resistance part 1In stock market technical analysis, support and resistance are certain predetermined levels of the price of a security at which it is thought that the price will tend to stop and reverse. These levels are denoted by multiple touches of price without a breakthrough of the level.

Support and Resistance part 2Support is a price point below the current market price that indicate buying interest. Resistance is a price point above the current market price that indicate selling interest. S&R can be used to identify targets for the trade. For a long trade, look for the immediate resistance level as the target.

Institutional Trading Part 4Institutional trading involves the buying and selling of securities by large financial institutions on behalf of clients or for their own account. These institutions include hedge funds, mutual funds, pension funds, insurance companies, and banks. They often engage in larger-scale trades and have access to more complex financial instruments than retail investors.

Learn Institutional Level Trading part 6The buying and selling of financial assets are conducted by sizable entities, including banks, credit unions, pension funds, hedge funds, and mutual funds, in the process known as institutional trading.

Database Trading part 3Trading data is typically collected from stock exchanges such as the New York Stock Exchange (NYSE) or NASDAQ. This can be a useful source for trades that are made over the listed exchanges and can provide many different data poitns, such as trade prices and times.

MACD part 2Moving average convergence/divergence (MACD) is a technical indicator to help investors identify price trends, measure trend momentum, and identify entry points for buying or selling. Moving average convergence/divergence (MACD) is a trend-following momentum indicator that shows the relationship between two exponential moving averages (EMAs) of a security’s price. MACD was developed in the 1970s by Gerald Appel, and is one of the most popular technical tools, readily available on most trading platforms offered by online stock brokers.

What is Moving Average Convergence Divergence (MACD) ?The Moving Average Convergence Divergence (MACD) is a momentum indicator used in technical analysis to identify changes in the strength, direction, momentum, and duration of a trend in a stock or other asset's price. It's essentially a bar chart that visually displays the relationship between two moving averages of a price series.

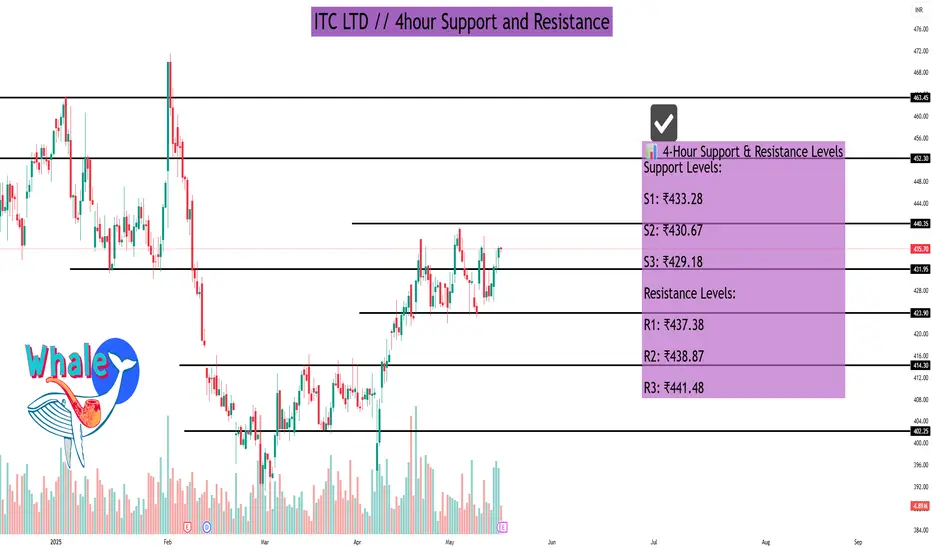
ITC LTD As of May 16, 2025, ITC Ltd. (NSE: ITC) is trading around ₹435.70. Analyzing the 4-hour timeframe, the following support and resistance levels have been identified based on various technical indicators:
📊 4-Hour Support & Resistance Levels
Support Levels:
S1: ₹433.28
S2: ₹430.67
S3: ₹429.18
Resistance Levels:
R1: ₹437.38
R2: ₹438.87
R3: ₹441.48
These levels are derived from pivot point calculations and can serve as potential areas where the price might experience support or resistance.
🔍 Technical Indicators Overview
Relative Strength Index (RSI): 58.98 – Indicates neutral momentum.
Moving Average Convergence Divergence (MACD): 3.86 – Suggests mild bullish momentum.
Average Directional Index (ADX): 17.89 – Points to a weak trend strength.
Stochastic Oscillator: 51.37 – Reflects neutral conditions.
Supertrend Indicator: ₹413.32 – Below current price, indicating a bullish signal.
Parabolic SAR: ₹437.35 – Slightly above current price, suggesting potential resistance.
📈 Fibonacci Retracement Levels
Considering the downtrend from ₹491.00 (Jan 3, 2025) to ₹390.15 (Apr 7, 2025), the key Fibonacci retracement levels are:
23.6%: ₹413.95
38.2%: ₹428.67
50%: ₹440.57
61.8%: ₹452.48
76.4%: ₹467.20
These levels can act as potential support or resistance zones as the price retraces its previous move.
🧠 Trading Insights
The current price is approaching the R1 resistance level at ₹437.38.
If the price breaks above this level with strong volume, it may test higher resistance levels.
Conversely, if it fails to break through, it might retrace to the support levels mentioned above.
Traders should monitor these levels closely and consider using stop-loss orders to manage risk.
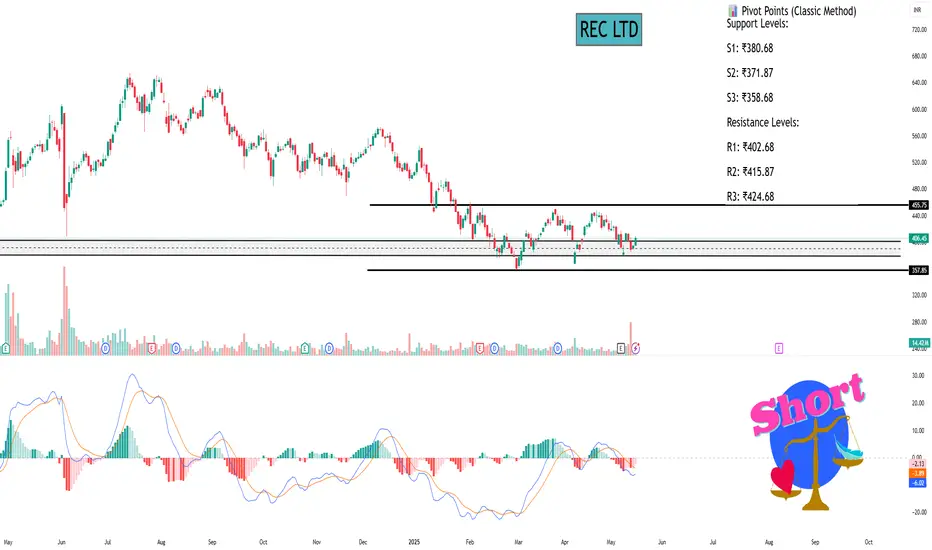
REC LTDAs of May 16, 2025, REC Ltd. (NSE: RECLTD) demonstrated a positive movement on the daily chart, with the stock closing at ₹406.45, marking a 3.07% increase from the previous close of ₹394.35. The day's trading range spanned from a low of ₹395.10 to a high of ₹409.65, with a substantial trading volume of approximately 14.4 million shares, indicating heightened investor interest.
📈 Technical Indicators (Daily Timeframe)
Relative Strength Index (RSI): 53.25 – Positioned in the neutral zone, suggesting neither overbought nor oversold conditions.
Moving Average Convergence Divergence (MACD): 0.37 – A positive value indicating bullish momentum, albeit modest.
Money Flow Index (MFI): 58.15 – Reflects moderate buying pressure, aligning with the day's positive price movement.
Average Directional Index (ADX): 31.99 – Suggests a developing trend strength, which traders should monitor for potential continuation or reversal.
Stochastic Oscillator (20,3): Approximately 55–80 – Indicates a bullish condition, but approaching overbought territory, warranting caution.
Commodity Channel Index (CCI): Positive territory – Signifies that the stock is trading above its average price, supporting the bullish outlook.
📊 Pivot Points (Classic Method)
Support Levels:
S1: ₹380.68
S2: ₹371.87
S3: ₹358.68
Resistance Levels:
R1: ₹402.68
R2: ₹415.87
R3: ₹424.68
The stock's closing price is above the first resistance level (R1), suggesting potential to test higher resistance levels if bullish momentum continues.
🔍 Trend Analysis
Recent technical assessments indicate that REC Ltd. may be entering a critical phase. A head and shoulders pattern was identified on the daily chart, with a breakout observed on March 19, 2024. This pattern typically signals a potential reversal, and the breakout was accompanied by increased trading volume and a bearish signal on the MACD indicator. Currently, the RSI is at a low level, and sustained momentum from the breakout may lead to further downward movement.
⚠️ Investor Considerations
Volatility: The stock has a beta of approximately 2.01, indicating higher volatility compared to the broader market.
Valuation Metrics:
P/E Ratio: 6.74 – Suggests the stock is trading at a relatively low multiple compared to the industry average.
P/B Ratio: 1.35 – Indicates a reasonable valuation in terms of book value.
Dividend Yield: 4.43% – Reflects a strong return to shareholders.
52-Week Range: ₹127.40 – ₹654.00 – The current price is significantly below the 52-week high, offering potential upside if the stock rebounds.
📌 Summary
REC Ltd.'s recent price action and technical indicators suggest a cautiously optimistic outlook. While the stock has shown a positive movement, the presence of a head and shoulders pattern and other technical signals warrant careful monitoring. Investors should watch for confirmation of trend continuation or reversal, particularly around the identified support and resistance levels.
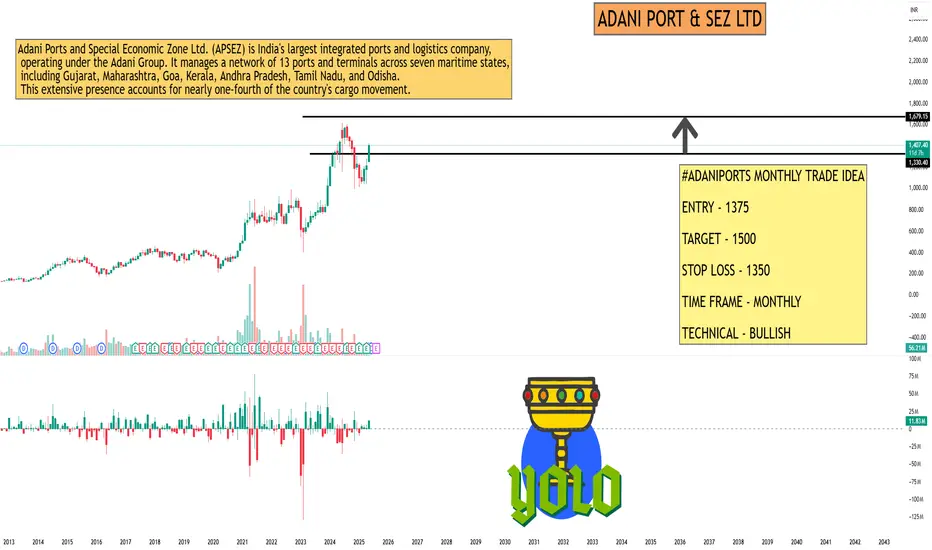
ADANI PORT & SEZ LTDAs of May 16, 2025, Adani Ports and Special Economic Zone Ltd. (NSE: ADANIPORTS) continues to exhibit a bullish trend on the monthly timeframe, supported by key technical indicators and significant price movements.
📊 Monthly Technical Overview
Current Price: ₹1,407.40
1-Month Gain: +16.31%
52-Week Range: ₹703.00 – ₹1,621.40
All-Time High: ₹1,621.40 (June 3, 2024)
📈 Key Technical Indicators
Relative Strength Index (RSI): 68.19 – Approaching overbought territory, indicating strong buying momentum.
MACD: +6.97 – Positive value suggests bullish momentum.
Stochastic Oscillator: 88.40 – In overbought zone, which may signal a potential pullback.
Commodity Channel Index (CCI): 252.86 – Indicates the stock is overbought.
Williams %R: -19.29 – Also suggests overbought conditions.
Average Directional Index (ADX): 16.45 – Points to a weak trend strength, implying that while the trend is upward, it may not be strongly established.
🧮 Moving Averages
10-Day EMA: ₹235.52
20-Day EMA: ₹229.64
50-Day EMA: ₹220.86
100-Day EMA: ₹222.11
200-Day EMA: ₹244.28
The current price is trading well above all key EMAs, reinforcing the bullish outlook.
📌 Pivot Points (Classic Method)
Support Levels:
S1: ₹239.67
S2: ₹233.63
S3: ₹229.72
Resistance Levels:
R1: ₹249.62
R2: ₹253.53
R3: ₹259.57
The stock is nearing R1, and a breakout above this could lead to testing R2 and R3.
💡 Summary
Adani Ports & SEZ Ltd. demonstrates strong bullish momentum on the monthly timeframe, trading above key moving averages and supported by high trading volumes. However, several indicators suggest overbought conditions, which may lead to short-term consolidation or a minor pullback. Investors should monitor the stock's movement around the ₹1,407–₹1,621 range for potential resistance and watch for confirmation before making new entries.
Bharat Heavy Electricals LtdAs of May 16, 2025, Bharat Heavy Electricals Ltd. (BHEL) exhibited a strong bullish trend on the daily chart, supported by various technical indicators.
📊 Daily Technical Overview
Closing Price: ₹250.35
Day’s Range: ₹244.16 – ₹259.99
Volume: ~50.24 million shares, significantly higher than the 20-day average of ~12.66 million shares, indicating strong trading activity.
📈 Key Technical Indicators
Relative Strength Index (RSI): 68.19 – Approaching overbought territory, suggesting strong buying momentum.
MACD: 6.97 – Indicates bullish momentum.
Stochastic Oscillator: 88.40 – In overbought zone, which may signal a potential pullback.
Commodity Channel Index (CCI): 252.86 – Suggests the stock is overbought.
Williams %R: -19.29 – Also indicates overbought conditions.
Average Directional Index (ADX): 16.45 – Points to a weak trend strength, implying that while the trend is upward, it may not be strongly established.
🧭 Moving Averages
Short-Term:
10-Day EMA: ₹235.52
20-Day EMA: ₹229.64
Medium-Term:
50-Day EMA: ₹220.86
100-Day EMA: ₹222.11
Long-Term:
200-Day EMA: ₹244.28
The current price is above all these moving averages, reinforcing the bullish outlook.
TipRanks
🔍 Pivot Points (Classic Method)
Support Levels:
S1: ₹239.67
S2: ₹233.63
S3: ₹229.72
Resistance Levels:
R1: ₹249.62
R2: ₹253.53
R3: ₹259.57
The stock is nearing R1, and a breakout above this could lead to testing R2 and R3.
📌 Summary
BHEL's stock demonstrates strong bullish momentum, trading above key moving averages and supported by high trading volumes. However, several indicators suggest overbought conditions, which may lead to short-term consolidation or a minor pullback. Investors should monitor the stock's movement around the ₹250–₹260 range for potential resistance and watch for confirmation before making new entries.

#NIFTY50 #NIFTYBANK#NIFTY50
#NIFTYBANK
This is not a buy or sell recommendation only for educational purposes and I am not a SEBI registered.
Indian Stock Market Outlook - Monday, May 19, 2025
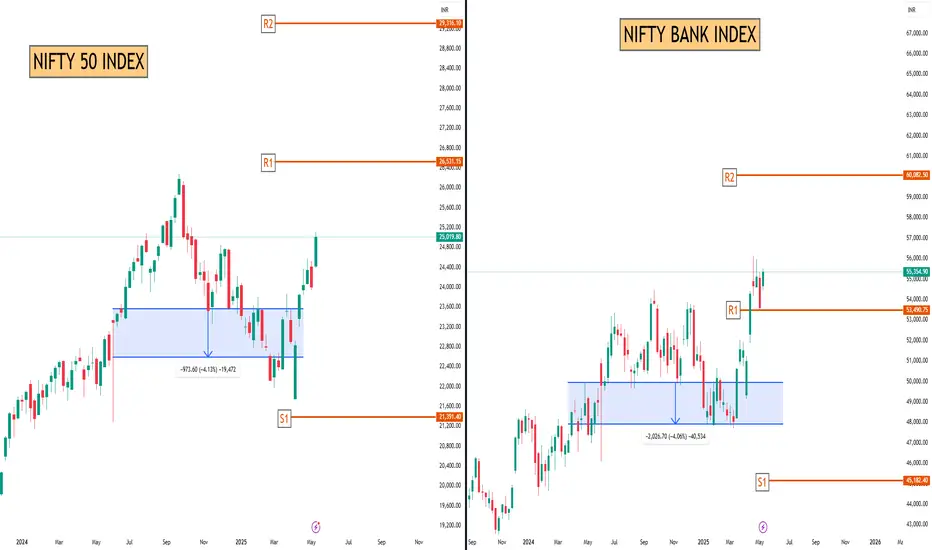
Market Overview
The Indian equity markets are poised for a cautious start to the week, following a volatile session on Friday, May 16, where the Nifty 50 closed at 25,019.8 and the Bank Nifty at 55,354.9.
The recent rally has been underpinned by easing geopolitical tensions, notably the India-Pakistan ceasefire, and renewed Foreign Institutional Investor (FII) interest. However, profit-booking at higher levels and global uncertainties may temper bullish sentiments.
Global & Domestic Factors Influencing the Market
India-Pakistan Ceasefire: The ceasefire agreement effective from May 10 has alleviated immediate geopolitical concerns, potentially supporting market stability.
FIl Activity: Renewed FII inflows have been observed, driven by easing global tensions and attractive valuations in Indian equities.
India-US Trade Relations: Ongoing negotiations between India and the US aim to resolve tariff disputes, with potential implications for sectors like pharmaceuticals and automotive.
US Economic Indicators: Recent US jobless claims and PMI data will be closely watched for cues on global economic health and potential impacts on emerging markets.
Q4 Earnings Season: Corporate earnings announcements will continue to influence stock-specific movements and sectoral trends.
Fundamental Analysis
Valuation Metrics: The Nifty 50's Price-to-Earnings (P/E) ratio remains elevated, suggesting cautious optimism among investors.
Sectoral Performance: Banking and Financial Services have shown resilience, while Information Technology and Metal sectors may face headwinds due to global factors.
Currency Fluctuations: The INR's performance against the USD will be critical, especially in light of recent US credit rating concerns.
✰ Stocks in Focus
1. IRFC (Indian Railway Finance Corporation):
Anticipated to benefit from increased infrastructure spending and government initiatives in the railway sector.
2. SJVN (Satluj Jal Vidyut Nigam):
Positive outlook due to its involvement in renewable energy projects and recent capacity expansions.
3. NBCC (India) Limited:
Expected to gain from government contracts and urban development projects.
4. Yes Bank:
Recent quarterly results indicate a significant improvement in profitability, suggesting a potential turnaround.
5. Tata Elxsi:
Despite a dip in net profit, the company's focus on design and technology services positions it well for future growth.
6. Mastek:
While facing short-term challenges, its strategic acquisitions and digital transformation services offer long-term potential.
7. State Bank of India (SBI):
Continues to demonstrate strength in asset quality and credit growth, reinforcing its leadership in the banking sector.
8. LTIMindtree:
Upcoming ex-dividend date and consistent performance in IT services make it a stock to watch.
9. Page Industries:
Investor interest may be piqued due to its impending ex-dividend date and strong brand presence in the apparel sector.
10. Havells India:
Focus on consumer electricals and expansion into new markets could drive future earnings.
Strategic Considerations for Traders
Risk Management: Given the current market volatility, implementing strict stop- loss orders is advisable.
Sector Rotation: Monitor shifts in sectoral leadership, particularly between defensives like FMCG and cyclicals like infrastructure.
Global Cues: Stay attuned to international developments, especially US economic data and geopolitical events, which could impact market sentiment.
*Note: This analysis is based on information available as of May 19, 2025, and is intended for informational purposes only. Investors should conduct their own research or consult financial advisors before making investment decisions.*
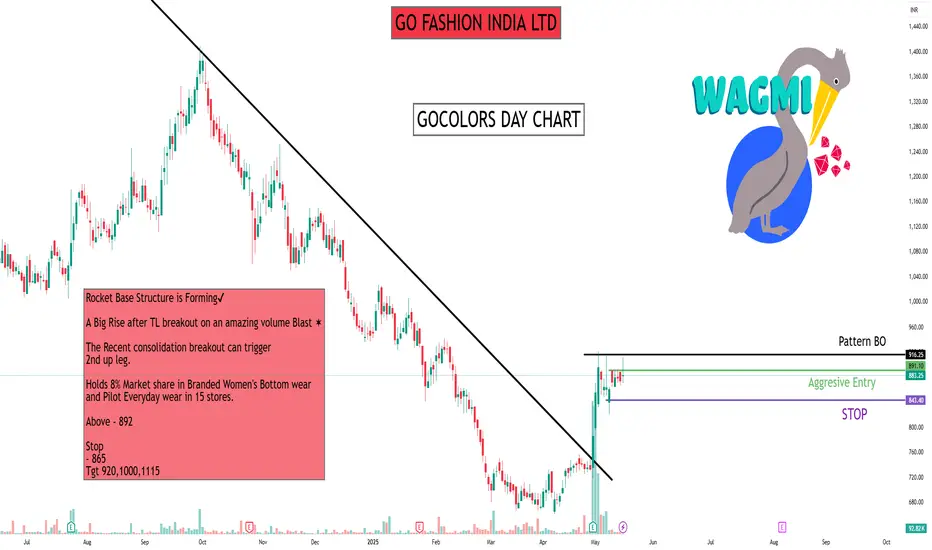
GO FASHION INDIA LTDGo Fashion (India) Ltd., operating under the brand name Go Colors, is a prominent Indian apparel company specializing in women's bottom-wear. Established in 2010 and headquartered in Chennai, Tamil Nadu, the company has carved a niche in the fashion industry by focusing exclusively on this segment.
#GOCOLORS DAY CHART -
Rocket Base Structure is Forming✔
A Big Rise after TL breakout on an amazing volume Blast ✶
The Recent consolidation breakout can trigger
2nd up leg.
Holds 8% Market share in Branded Women's Bottom wear and Pilot Everyday wear in 15 stores.
Above - 892
Stop
- 865
Tgt 920,1000,1115
Keep learning happy trading