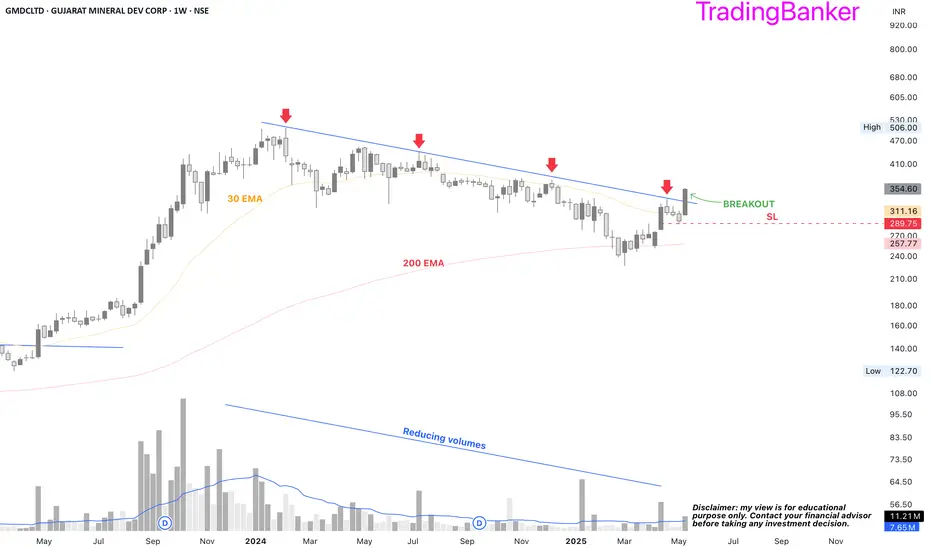
GMDC: a probable long🔸Trendline breakout
🔸30 EMA breakout
🔸Decent financials with 2nd highest ever sales and 3rd highest PAT
🔸Substantial promoter holding
🔸Increase in FII folding although marginal
🔸Capacity expansion underway would pave the way for the highest ever sales and PAT
🔸PE below the industry PE and PEG below 0.50
NIFTY
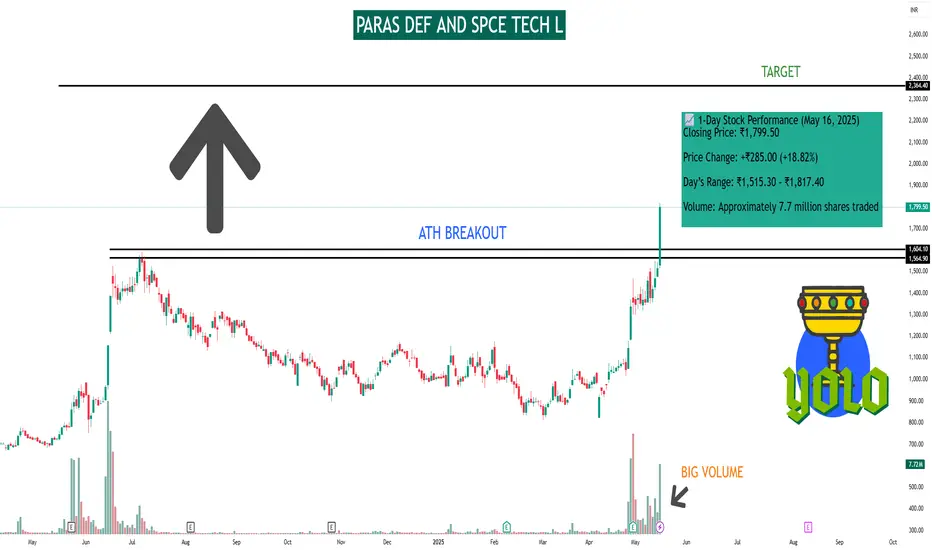
PARAS DEF AND SPCE TECH LAs of May 16, 2025, Paras Defence and Space Technologies Ltd (NSE: PARAS) experienced a significant surge in its stock price.
📈 1-Day Stock Performance (May 16, 2025)
Closing Price: ₹1,799.50
Price Change: +₹285.00 (+18.82%)
Day’s Range: ₹1,515.30 – ₹1,817.40
Volume: Approximately 7.7 million shares traded
📊 Recent Performance Overview
1-Week Gain: +32.39%
1-Month Gain: +73.35%
Year-to-Date (YTD) Return: +63.05%
📰 Key Developments
Stock Split Announcement: The company declared a 1:2 stock split, enhancing liquidity and making shares more affordable for investors.
Strong Q1 Financials: Paras Defence reported a 97% year-over-year increase in net profit for Q1 FY25, indicating robust operational performance.
Sectoral Momentum: The defense sector has been on an upswing, with Paras Defence among the leading gainers amid a broader rally in defense stocks.
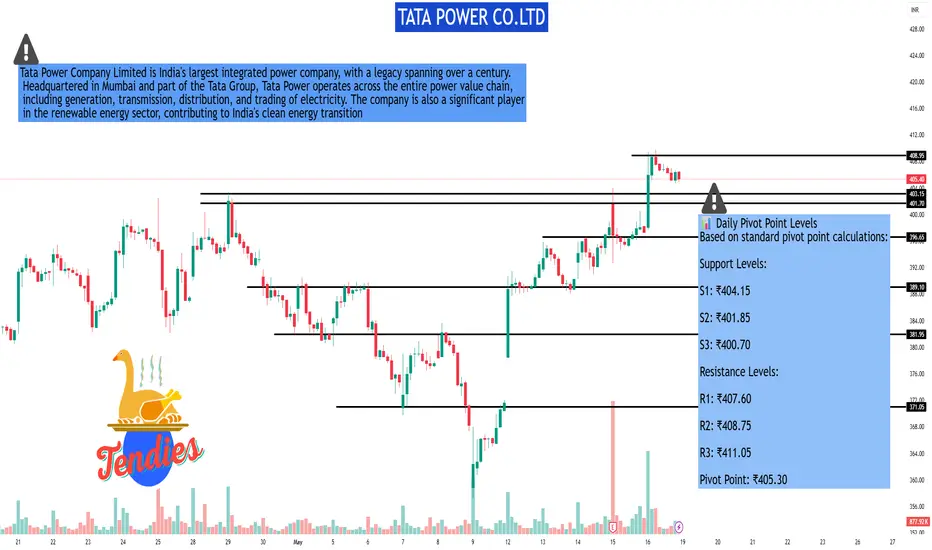
TATA POWER CO.LTDAs of May 16, 2025, Tata Power Co. Ltd. (NSE: TATAPOWER) closed at ₹405.80, marking a 1.97% increase for the day.
📊 45-Minute Timeframe Technical Analysis
Analyzing the 45-minute chart provides insights into the stock's short-term movements.
📈 Moving Averages
50 EMA: ₹350.38
200 EMA: ₹355.60
Signal: The 50 EMA is below the 200 EMA, indicating a mild bearish trend.
📈 Simple Moving Averages (SMA)
15 SMA: ₹358.10
50 SMA: ₹344.82
Signal: The 15 SMA is above the 50 SMA, suggesting a mild bullish trend.
🔍 Summary
Current Price: ₹405.80
Short-Term Trend: Mixed signals with a mild bearish indication from EMA crossover and a mild bullish indication from SMA crossover.
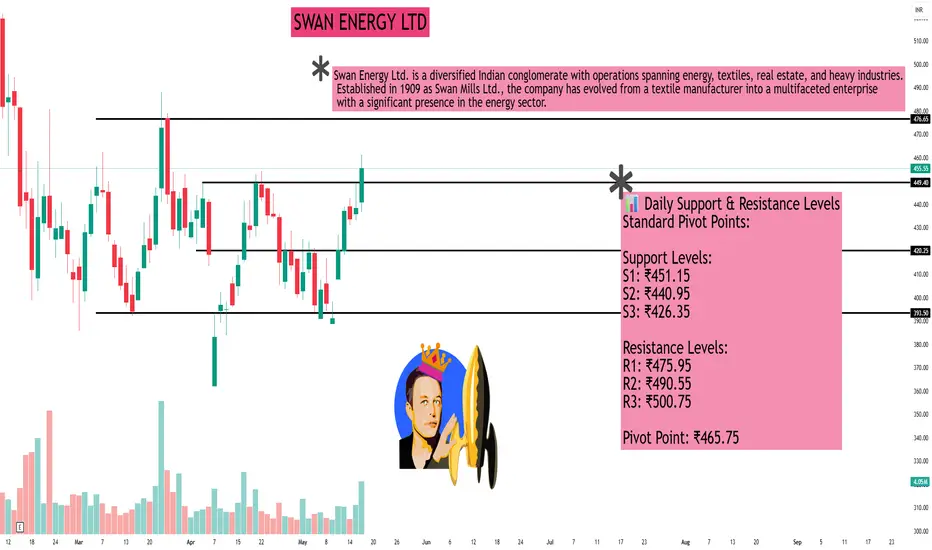
SWAN ENERGY LTDAs of the close on May 16, 2025, Swan Energy Ltd. (NSE: SWANENERGY) ended the trading day at ₹455.00. Based on daily technical analysis and pivot point calculations, here are the key support and resistance levels to consider:
📊 Daily Support & Resistance Levels
Standard Pivot Points:
Support Levels:
S1: ₹451.15
S2: ₹440.95
S3: ₹426.35
Resistance Levels:
R1: ₹475.95
R2: ₹490.55
R3: ₹500.75
Pivot Point: ₹465.75
Fibonacci Retracement Levels (from recent downtrend):
Support Levels:
23.6%: ₹391.87
38.2%: ₹410.22
50%: ₹425.05
61.8%: ₹439.88
76.4%: ₹458.23
Resistance Levels:
23.6%: ₹425.88
38.2%: ₹407.53
50%: ₹392.70
61.8%: ₹377.87
76.4%: ₹359.52
Accumulated Volume Support & Resistance:
Support Levels:
S1: ₹442.45
S2: ₹434.55
S3: ₹430.25
Resistance Level:
R1: ₹472.85
📈 Technical Indicators Overview
Relative Strength Index (RSI): 72.385 (indicates overbought conditions)
MACD: 7.690 (suggests bullish momentum)
5-Day Moving Average: ₹448.94
50-Day Moving Average: ₹424.67
These indicators suggest that while the stock is currently experiencing bullish momentum, the RSI indicates it may be overbought, which could lead to a short-term pullback.
🔍 Trading Insights
The immediate support level at ₹442.45 is crucial; a break below this could signal further downside.
On the upside, resistance at ₹472.85 is significant; a break above this could indicate continued bullish momentum.
Given the current RSI and MACD readings, traders should exercise caution and monitor for potential reversals or consolidations.
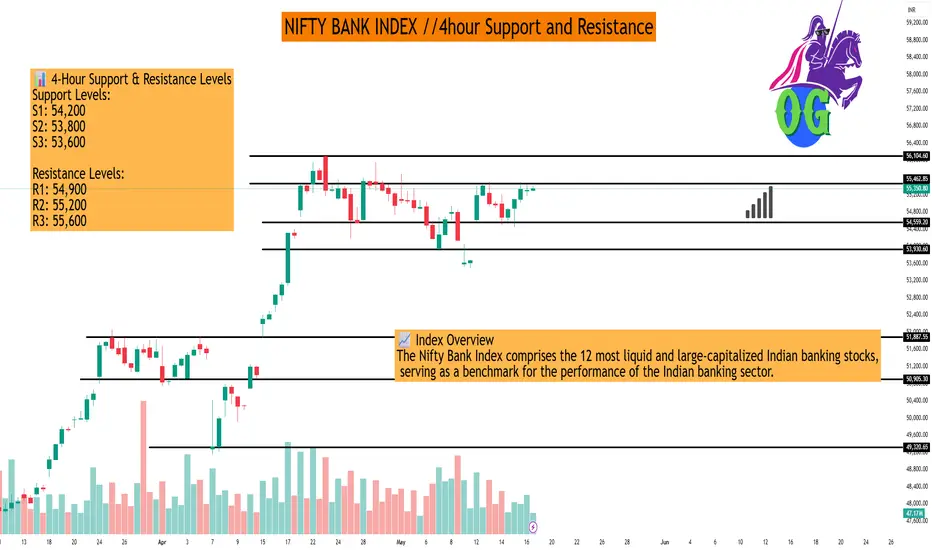
NIFTY BANK INDEX //4hour Support and ResistanceAs of May 17, 2025, here are the key 4-hour support and resistance levels for the Nifty Bank Index (BANKNIFTY), based on recent technical analyses:
📊 4-Hour Support & Resistance Levels
Support Levels:
S1: 54,200
S2: 53,800
S3: 53,600
Resistance Levels:
R1: 54,900
R2: 55,200
R3: 55,600
These levels are derived from recent price actions and technical indicators, indicating potential zones where the index might find buying or selling pressure.
📈 Exponential Moving Averages (EMA) on 4-Hour Chart
EMA 50: 54,750
EMA 100: 54,400
EMA 200: 54,000
EMA 400: 53,600
These EMAs can act as dynamic support or resistance levels, providing insights into the index's short to medium-term trend.
🔍 Technical Outlook
Trend: The 4-hour timeframe indicates a bullish trend, with the index trading above key EMAs.
Momentum Indicators: Indicators such as RSI and MACD suggest positive momentum, supporting the bullish outlook.
Price Action: The index has recently bounced from the 54,500 support zone, indicating buying interest at lower levels.
📌 Summary
Immediate Support: 54,200
Immediate Resistance: 54,900
Trend: Bullish on 4-hour timeframe
Traders should monitor these levels closely, as a break above resistance could signal further upside, while a drop below support might indicate a potential reversal or consolidation.
If you need more detailed analysis or information on specific indicators, feel free to ask!
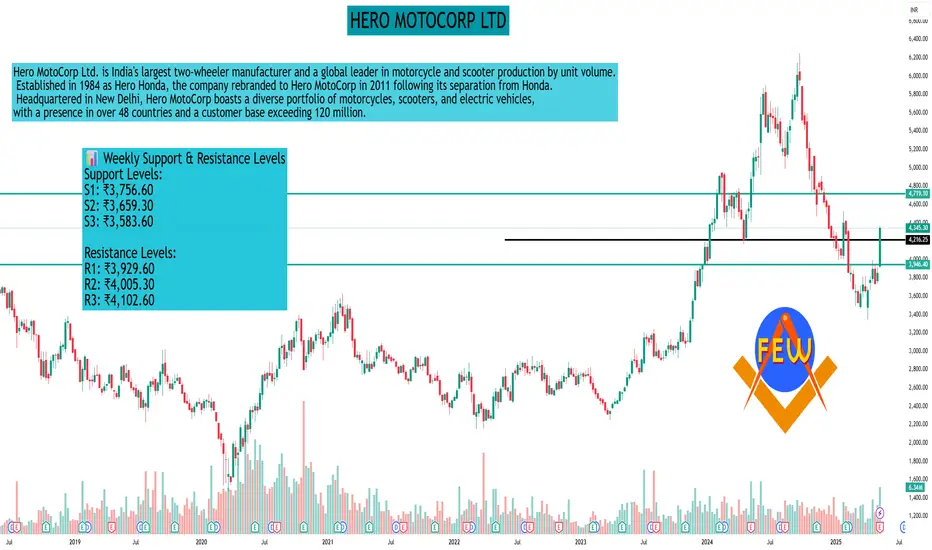
HERO MOTOCORP LTDAs of the week ending May 16, 2025, Hero MotoCorp Ltd. (NSE: HEROMOTOCO) closed at ₹3,853.90. Based on weekly technical analysis, here are the key support and resistance levels to consider for the upcoming week (May 19–23, 2025):
📊 Weekly Support & Resistance Levels
Support Levels:
S1: ₹3,756.60
S2: ₹3,659.30
S3: ₹3,583.60
Resistance Levels:
R1: ₹3,929.60
R2: ₹4,005.30
R3: ₹4,102.60
These levels are derived from standard pivot point calculations and can serve as potential zones where the stock might experience buying or selling pressure.
🔍 Technical Outlook
Immediate Support: A close below ₹3,756.60 may indicate further downside potential, with the next support at ₹3,659.30.
Immediate Resistance: A close above ₹3,929.60 could signal bullish momentum, targeting ₹4,005.30 and ₹4,102.60 subsequently.
Traders should monitor these levels closely, as breaches can indicate potential trend reversals or continuations.
SUN PHARMACUETICAL IND LTDSUN PHARMACEUTICAL IND L
SUNPHARMA THR
SWING TRADE
- EARN WITH ME DAILY 10K-20K -
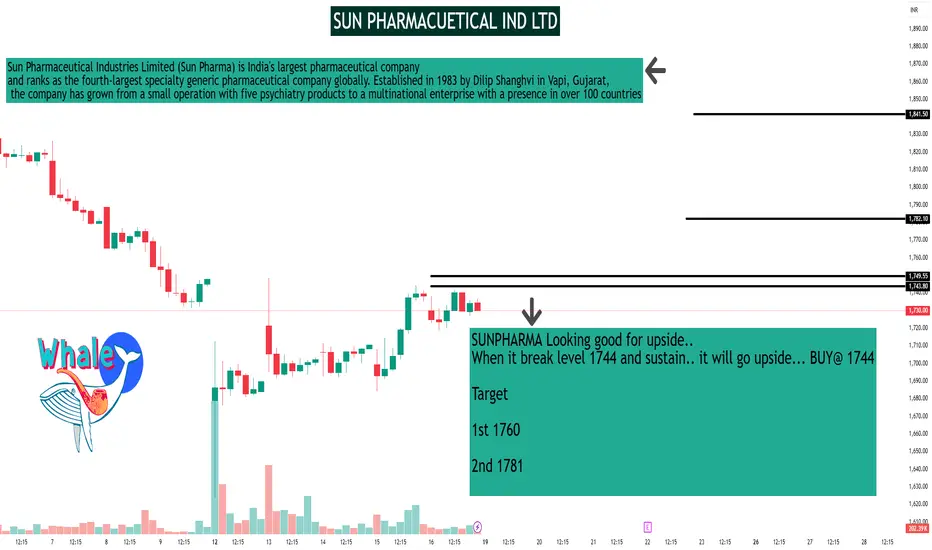
SUNPHARMA Looking good for upside..
When it break level 1744 and sustain.. it will go upside... BUY@ 1744
Target
1st 1760
2nd 1781
FNO
SUNPHARMA MAY FUT - LOT 9 (Qty-3150)
SUNPHARMA MAY 1740 CE - LOT 9 (Qty-3150)
Enjoy trading traders.. Keep add this STOCK in your watch list..
Big Investor are welcome..
Like this Post??? Hit like button..!!!
Follow me for FREE Educational Post and Alert..
MAZAGON DOCK SHIPBULL LTDMAZAGON DOCK SHIPBUIL LTD
Technical Analysis & Breakout Insights
Mazagon Dock Shipbuilders Ltd. - Technical Analysis & Breakout Insights
Date: May 16, 2025
Exchange: NSE
Current Market Price (CMP): 3,522.40
% Change: +10.68% | Volume: 16.56M
Price Action Summary
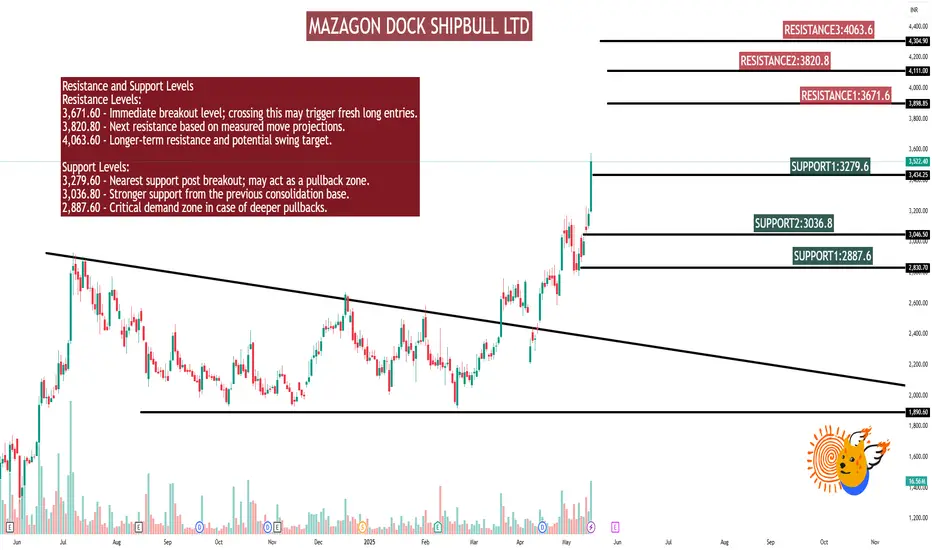
Mazagon Dock witnessed a powerful bullish rally with a close near the day's high, registering a 10.68% gain on extremely high volume. This signals a high-conviction breakout above previous resistances, with the stock clocking a fresh 52-week high and exhibiting signs of strong institutional participation.
Chart Pattern & Indicator Insights
20-Day Volume Breakout: Volume (16.56M) > 2x 20-day avg (6.7M) - strong accumulation.
52-Week High: Breaks annual high - bullish continuation signal.
Multi-Breakout Confluence: RSI, Bollinger Band breakout & BB squeeze-off- confirms explosive momentum.
Strong Bullish Candle: Big green candle closing near high - aggressive buying, minimal profit booking.
Bullish Momentum Cluster
Strong bullish momentum with RSI breakout
Swing trade candidate with intraday & short-term potential
Bollinger Band breakout + BB squeeze-off
Ideal for buy today, sell tomorrow setup
High probability trend continuation
Resistance and Support Levels
Resistance Levels:
3,671.60 - Immediate breakout level; crossing this may trigger fresh long entries.
3,820.80 - Next resistance based on measured move projections.
4,063.60 - Longer-term resistance and potential swing target.
Support Levels:
3,279.60 - Nearest support post breakout; may act as a pullback zone.
3,036.80 - Stronger support from the previous consolidation base.
2,887.60 - Critical demand zone in case of deeper pullbacks.
Educational Insights: How to Trade Mazagon Dock
Between July 2023 and March 2025, the stock was in a descending triangle or a contracting range, forming lower highs (red descending trendline) and finding support around 1920 levels (horizontal red line). This shows accumulation or consolidation after a strong uptrend.
Inside the range, a W-shaped structure (marked in blue) is visible. This is often a bullish reversal pattern, especially when it breaks out with strong volume, which happened around March-April 2025. A decisive breakout above the descending resistance trendline occurred with a spike in volume. Price has since rallied from around 3200 levels to the levels of 3500 (+10.68% today), indicating strong bullish momentum.
Volume Analysis: Notice the huge green volume bar on the breakout day (May 16, 2025), indicating strong buying interest and institutional participation. Volume buildup had already started increasing in late April, supporting the breakout.
Technical Observations: The stock shows signs of a strong uptrend following a breakout from a long-term consolidation zone. Based on previous price structure, the 2,600-2,400 range may act as a potential support area, where price had earlier faced resistance.
WIPRO LTD WIPRO LTD
Wipro Stock Analysis - Rebounding with Strong Q4 Performance
Technical Analysis: Building Momentum Towards New Highs
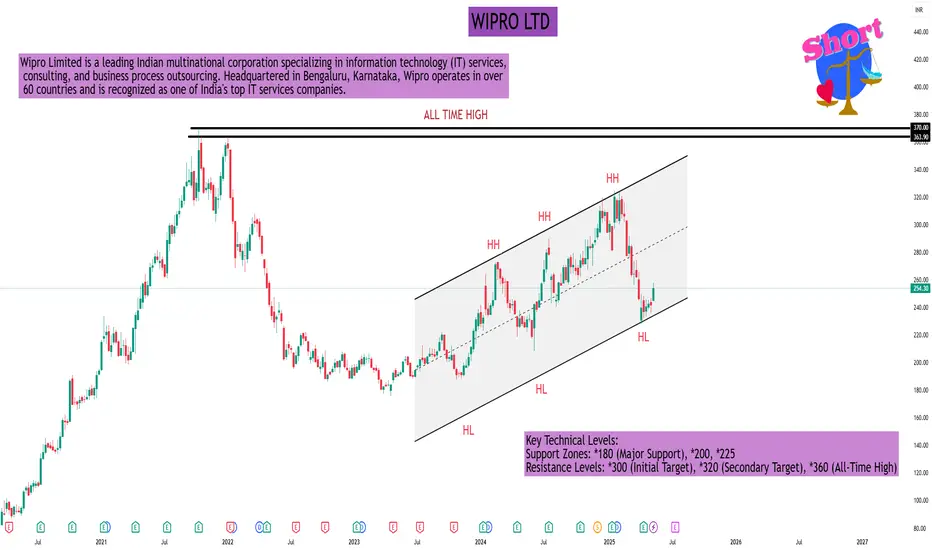
Wipro's stock has demonstrated a significant uptrend since the COVID-19 lows in April 2020, surging from ₹100 to an all-time high of ₹360 by October 2021. Following this peak, the stock underwent a substantial correction, retracing nearly 50% to reach the *180 level. This zone has since acted as a robust support, with the stock forming a series of higher highs and higher lows-a classic bullish pattern.
The recent Q4 FY25 results, announced on April 16, 2025, have further bolstered investor confidence, leading to a positive price movement. Currently trading around *250, the stock is poised to test higher resistance levels.
Key Technical Levels:
Support Zones: *180 (Major Support), *200, *225
Resistance Levels: *300 (Initial Target), *320 (Secondary Target), *360 (All-Time High)
Investors should monitor these levels closely. A sustained move above ₹300 could signal a continuation of the bullish trend, while a breach below *180 may indicate further downside.
Fundamental Analysis: Solid Q4 Performance with Strategic Wins
Wipro's Q4 FY25 results reflect a strong financial performance, with notable improvements across key metrics:
Q4 FY25 Key Financial Highlights:
22,319 Cr in Q3 FY24 and
22,208 Cr in Q4 FY24)
Total Income: *22,504 Cr (vs Total Expenses: *17,880 Cr (vs 17,779 Cr in Q3 FY24 and 17,828 Cr in Q4 FY24) Total Operating Profits: *4,624 Cr (vs ₹4,540 Cr in Q3 FY24 and 4,380 Cr in Q4 FY24)
Profit Before Tax: *4,743 Cr (vs 4,453 Cr in Q3 FY24 and ₹3,862 Cr in Q4 FY24) Profit After Tax: *3,588 Cr (vs ₹3,367 Cr in Q3 FY24 and Diluted Normalized EPS: *3.41 (vs 3.20 in Q3 FY24 and
Additional Insights:
2,858 Cr in Q4 FY24) 2.71 in Q4 FY24)
Net Profit Growth: Achieved a 26% YoY increase in net profit, indicating strong operational efficiency.
Large Deal Wins: Secured $4 billion in deal wins during Q4, including a significant $650 million contract with Phoenix, showcasing robust client acquisition.
Operating Margins: Expanded by 110 basis points YoY, reflecting effective cost management.
Cash Flow: Generated net operating cash flow of nearly $2 billion for FY25, representing 128.3% of net income, underscoring financial stability.
Despite the strong Q4 performance, Wipro has provided a cautious outlook for Q1 FY26, projecting a sequential revenue decline of 1.5% to 3.5%, attributed to macroeconomic uncertainties and client caution.
Reuters
Conclusion
Wipro's robust Q4 FY25 results, marked by significant profit growth and strategic deal wins, have reinforced its market position. The stock's technical setup suggests potential for further upside, provided it maintains key support levels. However, investors should remain vigilant regarding the company's cautious Q1 FY26 outlook and monitor upcoming economic indicators that may impact client spending.
PCR Trading Strategy The Put-Call Ratio (PCR) is a popular trading strategy that analyzes the ratio of put options to call options traded in the market, providing insights into market sentiment and potential price movements. It's a contrarian indicator, meaning that when the PCR is very high, it might suggest a bearish sentiment that could be followed by a price increase, and vice versa. Traders use the PCR to identify potential reversals and anticipate changes in market direction.

Institution Trading Strategy part 5Institutional traders, including high-frequency trading (HFT) firms, hedge funds, proprietary trading firms, and buy-side institutions, leverage sophisticated strategies powered by algorithmic trading and API automation to gain an edge in financial markets.

Institution Trading part 4Institutional trading is the buying and selling of financial assets by large organizations or institutions, such as pension funds, mutual funds, and insurance companies, on behalf of their clients or members. These institutions often manage large pools of capital, making them significant players in the financial markets.

What is Divergence ??In trading, divergence refers to a situation where the price action of an asset and a technical indicator move in opposite directions, suggesting a potential trend reversal or weakening trend. This discrepancy between price and indicator readings can be a signal for traders to anticipate a shift in momentum.

Technical Class 1Technical analysis is based on the fundamental idea that the price of a security moves in patterns or trends. Another essential assumption is that all fundamental considerations are reflected in the security price, which is a core concept of technical stock research.

Technical Concept A "technical concept" refers to a term or idea that has a specific, often specialized, meaning within a particular field or discipline, especially in technology or engineering. These concepts are often used to describe complex systems, processes, or principles. They can be fundamental to understanding a field or be more specific, like a particular algorithm or software library.

Database Trading Analysis Database trading analysis involves using structured data, like that stored in databases, to analyze trading data, identify patterns, and make informed trading decisions. This approach is crucial for modern trading desks that rely on data-driven insights to optimize strategies and generate alpha.

Learn Institutional Levels Trading part 6Institutional traders often use technical analysis for short-term trading, capitalizing on short-term market fluctuations. They also often use key levels to determine where to place their large orders. To do that, they identify key supply and demand zones and use these levels to enter and exit large positions.

CONCOR IDEAIndian equities are picking up momentum. One of the stock I identify is CONCOR for which chart looks bullinsh to atleast score the target near 1000. For trading it can test levels marked with lines retest show breakouts.
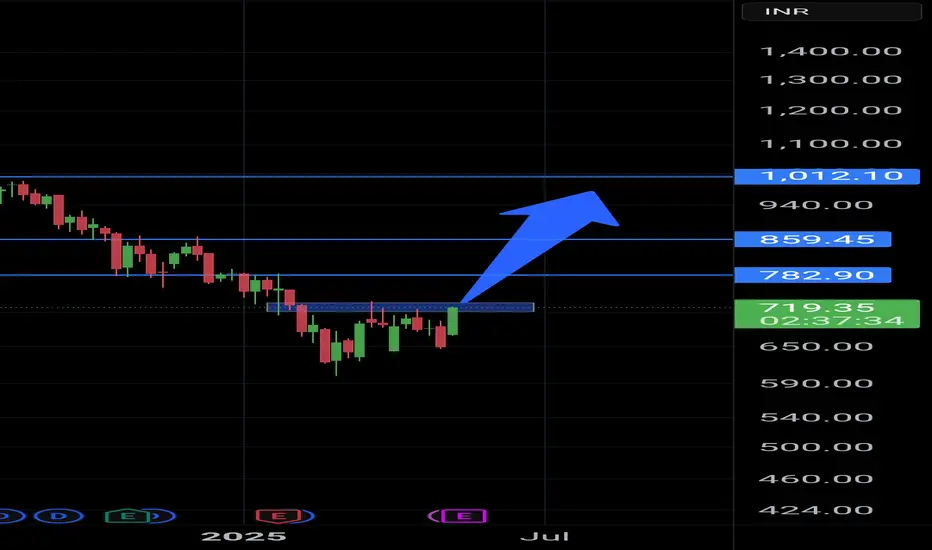
LIC HOUSING FINANCE LTDAs of May 16, 2025, LIC Housing Finance Ltd. (NSE: LICHSGFIN) exhibits a mildly bullish trend on the 15-minute timeframe, supported by several technical indicators:
📊 15-Minute Technical Analysis Summary
Price Levels:
Current Price: ₹617.95
High-Low Moving Average (HL MA) Bands:
Upper Band: ₹622.49
Middle Band: ₹619.49
Lower Band: ₹616.49
These bands suggest the stock is trading near its middle range, indicating potential consolidation.
MACD (12,26,9):
MACD Line: -3.16
Signal Line: -3.58
Histogram: Positive, indicating a bullish crossover
The MACD has been rising over the last five periods, reinforcing the bullish sentiment.
Technical Strength:
LICHSGFIN's technical strength is rated as "Mild Bullish," outperforming approximately 44.20% of stocks in the same category.
📈 TradingView Technical Summary (15-Minute Timeframe)
On TradingView, the 15-minute technical indicators for LICHSGFIN present a Neutral outlook, suggesting a balance between bullish and bearish signals.

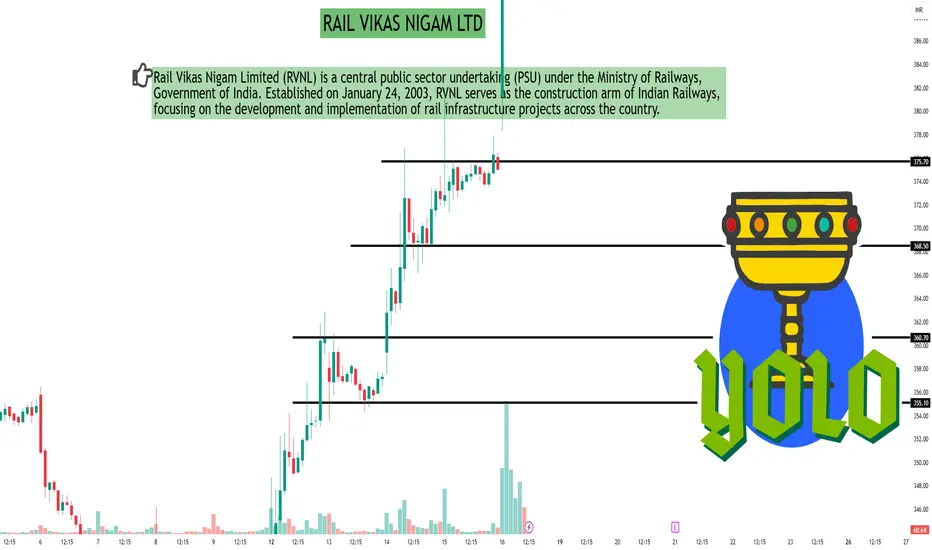
RAIL VIKAS NIGAM LTDAs of May 16, 2025, Rail Vikas Nigam Ltd. (NSE: RVNL) exhibits a bullish trend on the 30-minute timeframe, supported by several technical indicators:
📈 30-Minute Technical Analysis Summary
Current Price: ₹412.45
Relative Strength Index (RSI): 70.92
Indicates overbought conditions, suggesting strong upward momentum.
Moving Average Convergence Divergence (MACD): 2.89
Positive value supports the bullish trend.
Average Directional Index (ADX): 62.56
Reflects a strong trend strength.
Stochastic Oscillator: 78.09
Near overbought territory, indicating strong buying pressure.
Rate of Change (ROC): 0.972
Positive value aligns with upward price movement.
Supertrend: ₹372.14
Below current price, reinforcing the bullish outlook.
Parabolic SAR (PSAR): ₹371.61
Below current price, indicating an uptrend.
Chaikin Money Flow (CMF): 0.216
Positive value suggests buying pressure.
📊 TradingView Technical Summary (30-Minute Timeframe)
On TradingView, the 30-minute technical indicators for RVNL present a Neutral outlook, suggesting a balance between bullish and bearish signals.
⚠️ Trading Considerations
Overbought Indicators:
RSI and Stochastic values suggest the stock is in overbought territory; traders should watch for potential pullbacks.
Support Levels:
Supertrend and PSAR levels around ₹372 may act as support in case of a price correction.
Volume Analysis:
Monitoring volume trends alongside price movements can provide additional insights into the strength of the current trend.
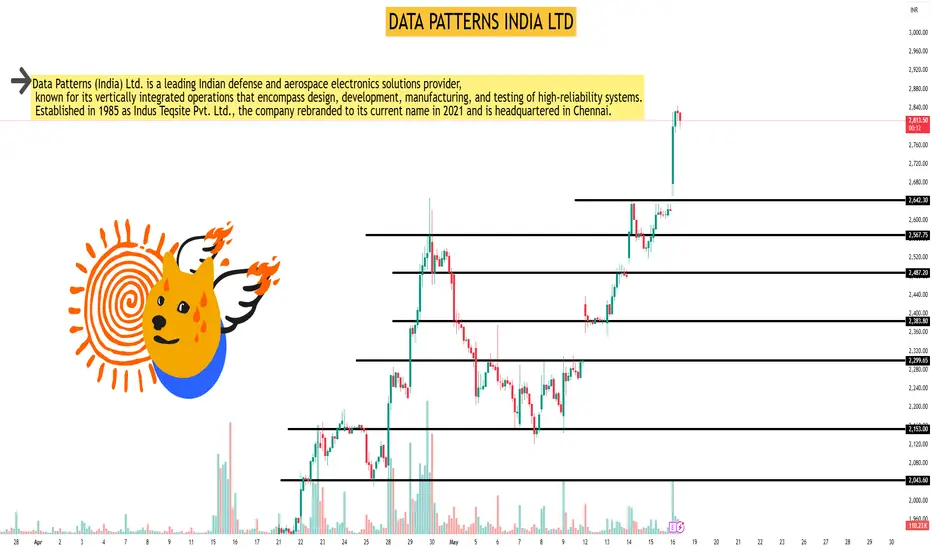
DATA PATTERNS INDIA LTDAs of May 16, 2025, Data Patterns (India) Ltd. (NSE: DATAPATTNS) exhibits a mildly bullish trend on the 45-minute timeframe, based on key technical indicators.
📊 45-Minute Technical Snapshot
Current Price: ₹2,821.20
20 SMA: ₹1,569.44
50 SMA: ₹1,546.58
Signal: Mild Bullish
Latest Price / MA Crossover: 7 ticks back
Crossover Type: Bullish
Analysis: Mild 20MA up, Mild 50 MA Uptrend, Mild Buy
📈 Additional Technical Indicators
Relative Strength Index (RSI): 72.31
Rate of Change (ROC): 56.07
Average Directional Index (ADX): 25.6
📉 Candlestick Patterns
Bullish Marubozu: Indicates strong buying pressure.
Long White Candle: Suggests bullish momentum.
📌 Summary
The 45-minute technical analysis of Data Patterns (India) Ltd. indicates a mildly bullish trend, supported by moving average crossovers and positive momentum indicators. However, the RSI suggests the stock is approaching overbought territory, warranting cautious optimism.
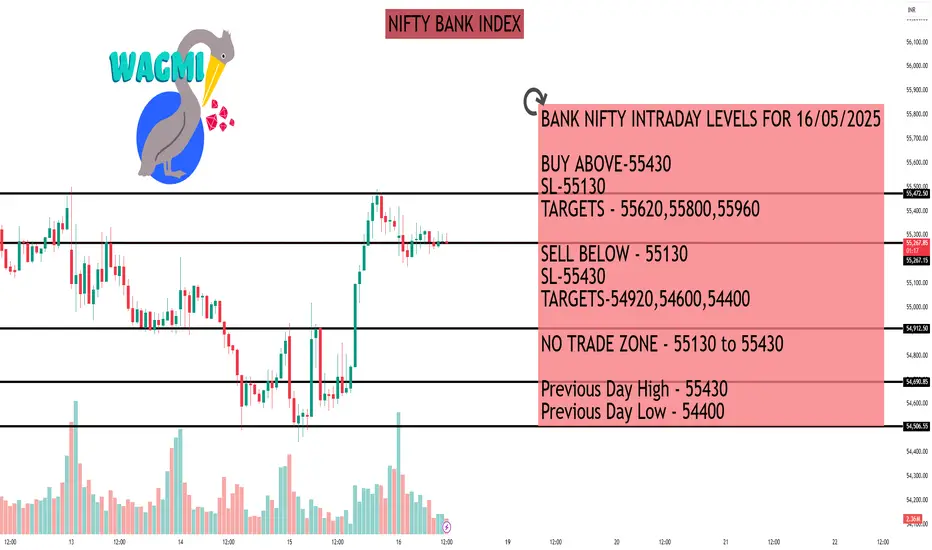
NIFTY BANK INDEXBANK NIFTY INTRADAY LEVELS FOR 16/05/2025
BUY ABOVE-55430
SL-55130
TARGETS - 55620,55800,55960
SELL BELOW - 55130
SL-55430
TARGETS-54920,54600,54400
NO TRADE ZONE - 55130 to 55430
Previous Day High - 55430
Previous Day Low - 54400
Based on price action major support & resistance's are here, the red lines acts as resistances, the green lines acts as supports. If the price breaks the
support/resistance, it will move to the next support/resistance line. White lines indicates previous day high & low, high acts as a resistance & low acts as a support for next day.
Trendlines are also significant to price action. If the price is above/below the trendlines, can expect an UP/DOWN with aggressive move.
Please NOTE: this levels are for intraday trading only.
Disclaimer - All information on this page is for educational purposes only,
we are not SEBI Registered, Please consult a SEBI registered financial advisor for your financial matters before investing And taking any decision. We are not responsible for any profit/loss you made.
Request your support and engagement by liking and commenting & follow to provide encouragement
HAPPY TRADING
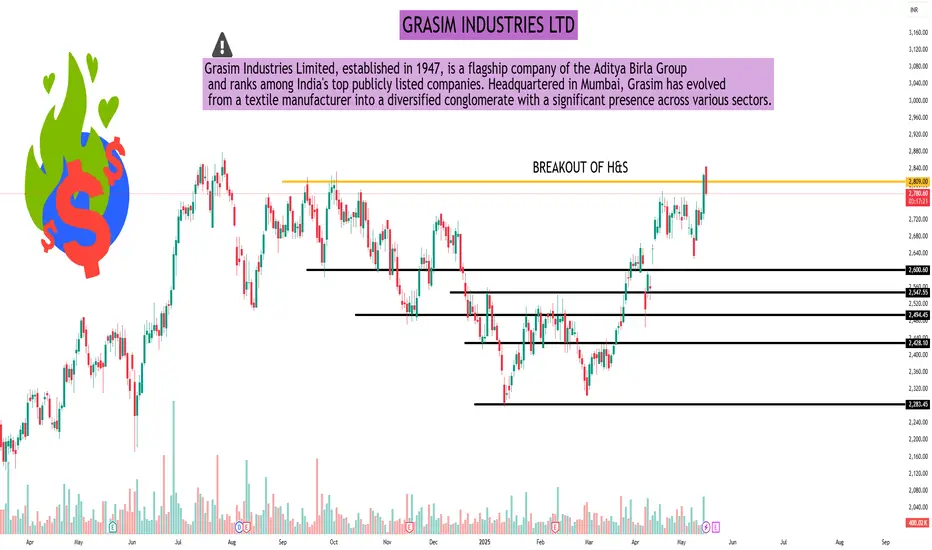
GRASIM INDUSTRIES LTDGRASIM INDUSTRIES LTD
Grasim - Inverted Head and Shoulder Breakout
Grasim, posted strong numbers!
A nice Inverted H&S pattern breakout done.
Buy @ 2825-2800
SL 2630
Target: 3250++
RSI is above 60+
MACD is Positive and giving a cross over
along with DMI showing Strength
Stocks looks super strong!