HIND ZINC SHORT TRADE -RISKYTechnical Analysis
Parabolic Extension: The stock has seen a massive, nearly vertical rally from the ~400 levels to highs near 670 in a very short span. Such parabolic moves are rarely sustainable without a significant correction or consolidation phase.
Rejection at Highs: The price action shows a sharp pullback from the recent high of 661.55, indicating that profit booking is kicking in and buyers are exhausted at these elevated levels.
Risk/Reward Ratio: The current setup offers a favorable Risk/Reward ratio for a short position. The stop loss is tight relative to the potential downside move as the stock attempts to revert to the mean.
Volume Profile: High volume during the ascent suggests strong participation, but upcoming sessions should be watched for distribution volume (selling pressure) to confirm the top.
Trade Setup (Short)
Entry Zone: 661 (Looking for rejection near the highs)
Stop Loss: 697.40 (Strict SL above recent swing high to protect against a "blow-off top")
Target: 564.45 (Targeting the gap fill/retracement to previous structure support)
Potential R:R: ~ 1:2.6
⚠️ Disclaimer: This chart analysis is shared for educational and informational purposes only. It does not constitute financial or investment advice. I am not a SEBI registered research analyst. Trading in the stock market involves a high degree of risk. Please consult with a certified financial advisor and perform your own due diligence before making any trading decisions.
NIFTY

RELIANCE: Major Weekly Breakout & Long SetupTechnical Analysis
Structure Breakout: The stock has successfully broken out above a key multi-month resistance level at 1592.30 (marked by the green horizontal line). This level previously acted as a significant supply zone, forming the rim of a potential bullish consolidation pattern (resembling a Cup & Handle or Rounding Bottom).
Momentum: The recent weekly candles show strong bullish momentum, pushing through the resistance with conviction. The price is now sustaining above this breakout point, which validates the bullish thesis.
Trend Continuation: After a period of correction and consolidation, the primary uptrend seems to be resuming. The Higher High (HH) formation on the weekly chart confirms the strength of buyers.
Risk/Reward: The setup offers an excellent Risk-to-Reward ratio (approximately 1:3), making it a high-probability trade for positional traders.
Trade Setup (Long)
Entry Zone: 1592 - 1600 (On the retest or continuation above the breakout level)
Stop Loss: 1509.15 (Placed below the breakout candle and recent swing structure to invalidate the thesis)
Target: 1855.60 (Projected measured move based on the depth of the previous consolidation)
Potential R:R: ~ 1:3.1
⚠️ Disclaimer: This analysis is for educational purposes only and does not constitute financial advice. I am not a SEBI registered analyst. Trading involves risk; please consult your financial advisor and conduct your own analysis before executing any trades.

Nifty spot 25683.30 by Daily Chart view - Weekly UpdateNifty spot 25683.30 by Daily Chart view - Weekly Update
- Support Zone 25425 to 25725 for Nifty Index
- Resistance Zone 26000 to 26200 >>> ATH 26373.20 for Nifty Index
- Deep rooted Fear plus Geo-Political events dampening Domestic Markets

Swing Buy Setup - BAJAJAUTO || Weekly ChartNSE:BAJAJ_AUTO
Price is holding above rising channel support and showing rejection from EMA + trendline confluence — classic continuation structure.
🔹 Buy Zone: Sustained move above ₹9,230
🔹 Stop Loss: Below breakout candle low (~₹8,970)
🔹 Targets:
🎯 T1: ₹9,480
🎯 T2: ₹9,880
🧠 Logic
Higher-high, higher-low structure intact
EMA acting as dynamic support
Tight risk for a clean upside expansion
No prediction. Only execution if price confirms.
Breakout holds → stay with trend. Breakout fails → exit fast.
Keep Learning,
Happy Trading.


GODREJAGRO – Waiting for Weekly Close Above 600My Technical View on GODREJAGRO
━━━━━━━━━━━━━━━━━━━━━━━━━━━━━━━━━━━━━━━━━━━
📊 CURRENT TECHNICAL SETUP
Current Price: ₹570.40 (-0.62%)
Timeframe: Weekly (1W)
Key Level: ₹600 (critical resistance on weekly close basis)
━━━━━━━━━━━━━━━━━━━━━━━━━━━━━━━━━━━━━━━━━━━
🎯 MY VIEW
GODREJAGRO is in a long-term downtrend from highs of ₹800+. The stock is currently testing support around the ₹570–600 zone, which has acted as a pivot level multiple times on the chart.
Key Observations:
✅ RSI showing extreme oversold readings (31.78) — suggesting panic selling may be exhausted
✅ Advanced RSI Divergence Detector highlighting a regular bullish divergence — a positive technical sign
✅ The ₹600 level remains a critical resistance and the KEY level to watch
My Trading Approach:
🚀 BUY consideration ONLY after a weekly close ABOVE ₹600 — This would be the first sign of potential trend reversal from the long-term downtrend. Until this happens, I remain on the sidelines watching this level closely.
Current price action below ₹600 suggests weakness, and patience is key. A weekly close above ₹600 would change the technical narrative and warrant looking for upside targets based on mean-reversion from oversold conditions.
━━━━━━━━━━━━━━━━━━━━━━━━━━━━━━━━━━━━━━━━━━━
⚠️ IMPORTANT DISCLAIMER
This is my personal technical observation for educational purposes only — NOT investment or trading advice. Past performance does not guarantee future results. Trade/Invest at your own risk and always use proper risk management. Consult a SEBI-registered financial advisor before making investment decisions.
━━━━━━━━━━━━━━━━━━━━━━━━━━━━━━━━━━━━━━━━━━━
💙 Do you agree with this view?
✈️ HIT THE PLANE ICON if this technical observation resonates with you!
━━━━━━━━━━━━━━━━━━━━━━━━━━━━━━━━━━━━━━━━━━━
📝 WHAT CHARTS DO YOU WANT ME TO ANALYZE?
Share your desired stock names in the comments below! I will analyze the chart patterns and share my technical view if I can identify meaningful setups. Looking forward to hearing from all of you — let's keep this discussion going and help each other make better trading decisions.

Nifty DownNifty and other major indices corrected since 11 am and broke the day low of the 1st half. However it recovered somewhat from the bottom. Nifty held it's support.

NIFTY Intraday Trade Setup For 5 Jan 2026NIFTY Intraday Trade Setup For 5 Jan 2026
Bullish-Above 26350
Invalid-Below 26300
T- 26640
Bearish Below 26200
Invalid-Above 26250
T- 26040
NIFTY has closed on a bullish note with over 1% gain last week, closing at ATH. Its a engulfing candle and index is on verge of breakout of daily range (26350- 26700) which has been valid since last 1 month.
26350 and 26200 will be Monday's range to watch for breakout for a directional move any side. Plan on 15 Min candle close.
I am Not SEBI Registered
This is my personal analysis for my personal trading. Kindly consult your financial advisor before taking any actions based on this.

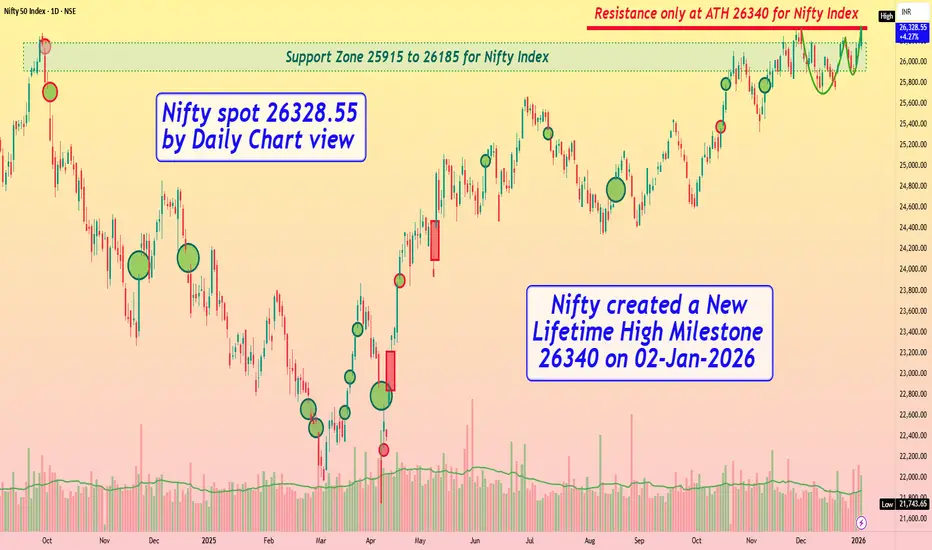
Nifty spot 26328.55 by Daily Chart view - Weekly UpdateNifty spot 26328.55 by Daily Chart view - Weekly Update
_*Nifty created a New Lifetime High Milestone 26340 on 02-Jan-2026*_
- Support Zone 25915 to 26185 for Nifty
- Resistance only at ATH 26340 for Nifty and each New ATH
- Volumes trending above avg traded quantity but with selling pressure
- Bullish Rising W formed by the neckline at previous ATH and New ATH level
- Hope to see further higher levels for the Nifty Index through the New Year 2026
NIFTY Buy-on-Dips | 26,000 CE Opportunity for Jan 6NIFTY continues to show bullish strength, and the broader structure favors a buy-on-dips approach for today, 2nd January 2026.
📌 Trade Setup (Options):
Instrument: NIFTY 26,000 CE (6th Jan Expiry)
Buy Zone: ₹180 – ₹170
Target: ₹240
Risk Level: ₹140 (must hold on closing basis)
As long as ₹140 remains intact, the bullish momentum stays valid. A dip into the mentioned buy zone could offer a low-risk, high-reward opportunity aligned with the current trend.
⚠️ Trade with strict risk management and adjust position sizing accordingly.
📌 Disclaimer:
This analysis is for educational purposes only and is not financial advice. Always manage risk and follow your trading plan.
Your feedback drives our content and keeps everyone trading smarter. Let’s make those pips together! 🚀
Happy Trading,
– The InvestPro Team

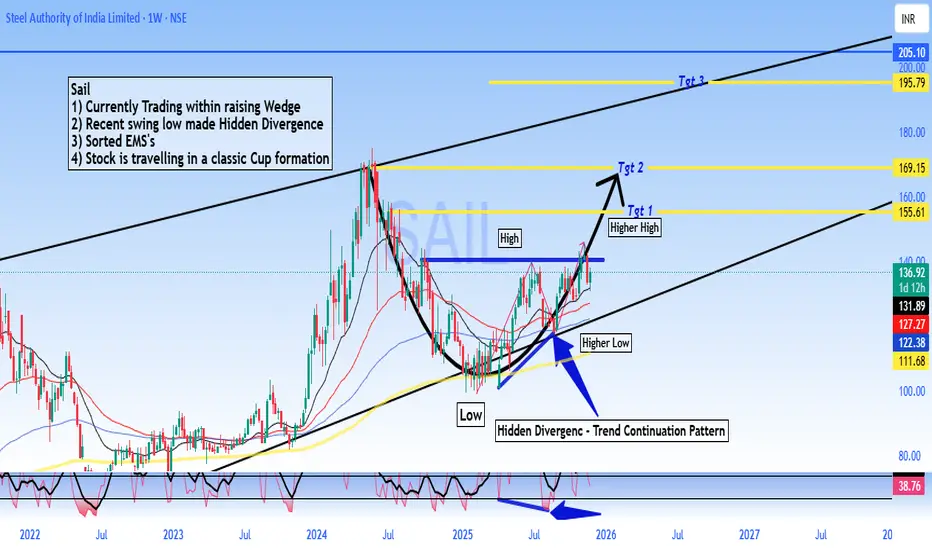
SAIL - Buy - Technical Analysis# Steel Authority of India Limited (SAIL) - Technical Analysis Report
Current Price: 136.92
Timeframe: Weekly Chart Analysis
Technical Setup Overview
SAIL is presenting a compelling technical picture with multiple bullish indicators aligning for a potential significant upward move. The stock is currently trading within a well-defined rising wedge pattern and has recently formed a **Hidden Divergence** on the weekly chart - a classic trend continuation signal.
Key Technical Observations
Rising Wedge Pattern:
The stock is trading within a rising wedge formation, which typically indicates consolidation before a breakout. The current price action suggests the stock is in the later stages of this pattern.
Hidden Divergence - Bullish Continuation Signal:
A **Hidden Divergence** has formed on the weekly timeframe.
- This pattern typically signals trend continuation and suggests the uptrend is likely to resume with strength
Sorted EMA Structure:
The Exponential Moving Averages are properly aligned, indicating a healthy bullish trend structure with multiple moving averages providing dynamic support.
Cup Formation in Progress:
The stock appears to be carving out a **classic Cup pattern**, which is a well-known bullish continuation formation. This pattern suggests accumulation and potential for a significant breakout move.
Price Targets & Projections
Based on the technical structure, here are the potential price targets:
Target 1: 155.61 (Higher High breakout level)
Target 2: 169.15
Target 3: 195.79
These targets are derived from the pattern structure and represent key resistance zones where profit-taking may occur.
Trading Strategy Considerations
For Swing Traders:
- Current levels offer a potential entry opportunity for medium to long-term positions
- A move above ₹140 could confirm the continuation pattern
- Stop loss can be placed below the recent higher low at 122 for risk management
Risk Factors to Monitor
- Failure to hold above ₹122 would invalidate the bullish hidden divergence
- Breakdown below the rising wedge support would change the outlook
- Sector performance and broader market conditions should be monitored
- Steel industry fundamentals and commodity price trends
🔔 Conclusion
SAIL is exhibiting strong technical characteristics with the Hidden Divergence pattern, sorted EMA structure, and cup formation all pointing toward potential upside. The current price action within the rising wedge presents an interesting risk-reward setup for traders and investors with appropriate risk management.
DISCLAIMER
This analysis is for educational and informational purposes only and should NOT be considered as investment advice or a recommendation to buy, sell, or hold any securities. - I am not a SEBI registered analyst or investment advisor - This is purely a technical analysis based on chart patterns and indicators - Past performance and technical patterns do not guarantee future results - Trading and investing in stocks involves substantial risk of loss - Always conduct your own research and due diligence before making any investment decisions - Consult with a qualified financial advisor before taking any investment positions - The author holds no responsibility for any profits or losses incurred based on this analysis - Risk management and position sizing are crucial - never invest more than you can afford to lose
**Trade/Invest at your own risk. Do your own analysis.**
#SAIL #SteelAuthorityOfIndia #StockMarket #TechnicalAnalysis #NSE #IndianStocks #ChartAnalysis #TradingView #StockTrading #HiddenDivergence #CupPattern #PriceAction #SwingTrading #Investing #MarketAnalysis #SteelSector #Commodities #TradingStrategy #ChartPatterns #TechnicalIndicators
NIFTY-50 ADVANCE ANALISYS FOR 1 JANUARY 2026green support, red resistance, watch blue line for clearification, follow only bolinger band

NIFTY Intraday Trade Setup For 30 Dec 2025NIFTY Intraday Trade Setup For 30 Dec 2025
Bullish-Above 26050
Invalid-Below 26000
T- 26260
Bearish-Below 25900
Invalid-Above 25950
T- 25650
We discussed that index may test 25900 below 26110, triggered and reached. Last week a shooting star candle has been formed in weekly TF. Now below 25900 index may extend the move till 25650. Bullish move can be seen if index sustains above 26050. 50 EMA in daily TF can be a confluence zone, break of which will trigger a short term bearishness in overall market. Plan the view on 15 Min candle close.
I am Not SEBI Registered
This is my personal analysis for my personal trading. Kindly consult your financial advisor before taking any actions based on this.

Nifty 50 spot 26042.30 by Daily Chart view - Weekly UpdateNifty 50 spot 26042.30 by Daily Chart view - Weekly Update
- Nifty has closed fairly above the Support Zone
- Support Zone steadfast at 25710 to 26010 for Nifty Index
- Resistance Zone grounded at 26200 to ATH 26325.80 for Nifty Index
- Volumes have fallen well below the average traded quantity thru the week
- Falling Resistance Trendline and the Resistance Zone rejection remain intact

NIFTY Intraday Trade Setup For 26 Dec 2025NIFTY Intraday Trade Setup For 26 Dec 2025
Bullish- Above 26250
Invalid-Below 26200
T- 26370-450
Bearish-Below 26110
Invalid-Above 26160
T- 25935
NIFTY has closed on a slight bearish note last day, ending near day low. Below 26110 there is a chance of gap filling towards 25930 zone, strong support placed at 25900. On flat opening short below 26110 on a 15 Min candle close. In case index surprises bears above 26350, then index will shot up towards 26450 zone. Buy above 26350 on a 15 Min candle close. Intraday support lies near 25930-25950 and resistance at 26450. Index is in bulls grip overall.
I am Not SEBI Registered
This is my personal analysis for my personal trading. Kindly consult your financial advisor before taking any actions based on this.

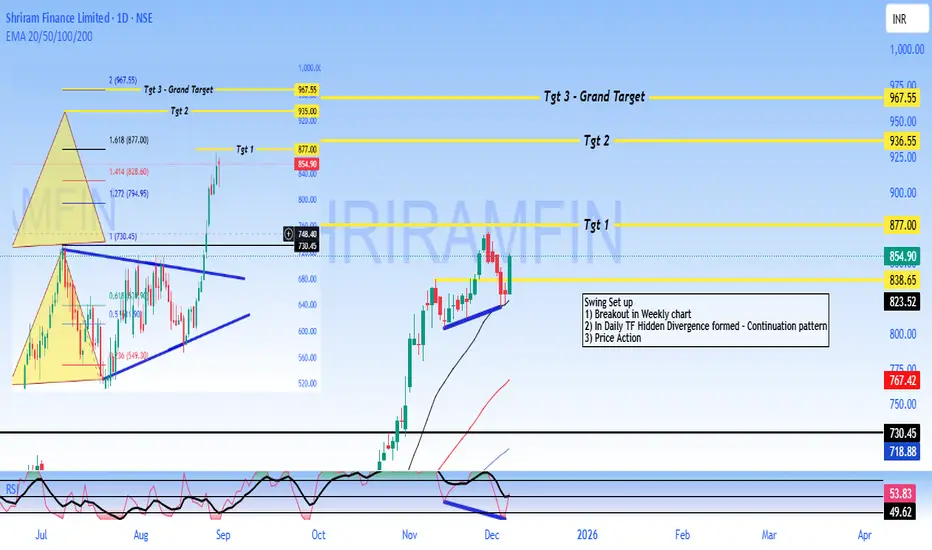
SHRIRAM - Buy - SwingTrading #Shriram Finance Limited - #Technical Analysis
Price: 854.90
#Technical Setup
Pattern: Continuation pattern with bullish hidden divergence following weekly breakout
Key Levels:
- Target 1: 877.00
- Target 2: 936.55
- Target 3: 967.55
- Support: 838 - 825 (critical)
- Major Support: 730.45
#Outlook
The chart shows a swing trading setup with upside potential toward 877 - 967 if support at 838 holds. A break below 825 would invalidate the bullish structure.
DISCLAIMER
This is NOT investment advice. This analysis is for educational purposes only. Trading involves substantial risk of loss. Always conduct your own research and consult a SEBI-registered financial advisor before making investment decisions. Past performance and technical patterns do not guarantee future results. The author assumes no responsibility for any losses incurred.
nifty 50 in coming weeks of 2026nifty 50 can be bought near 24700-300 range for 26700-27000 zones view invalid below 24200

APOLLO: Structural Reversal from Key Support Zone🚀 Long Setup: NSE:APOLLO Micro Systems (APOLLO)
Trade Parameters
Entry Zone: ₹245.00 – ₹255.00 (Current breakout level)
Stop Loss (SL): ₹214.00 (Weekly close basis / below structural support)
Target 1: ₹300.00 (Psychological & Analyst Consensus)
Target 2: ₹355.00 (All-Time High retest)
Risk/Reward Ratio: ~1:2.8
Technical Analysis
Support Rebound: The stock has successfully defended the ₹210–₹220 horizontal support zone, which acted as a major resistance-turned-support from mid-2025.
Momentum Shift: Today's 5% Upper Circuit hit at ₹249.80, accompanied by a spike in volume, signals the end of a 3-month correction/accumulation phase.
Trend Confirmation: The price has reclaimed the 20-week EMA, shifting the medium-term bias back to bullish.
RSI Recovery: RSI is turning up from the 40-level floor, suggesting the "oversold" energy is being replaced by fresh buying interest.
Fundamental Driver
The technical move is backed by the company's Q2 FY26 performance (highest-ever quarterly income of ₹226 Cr) and a massive ₹1,500 Cr order book. The recent licensing for high-energy explosives provides the long-term thematic tailwind for the Aerospace & Defense sector.

Kalyan Jewellers Bullish SetupKalyan Jewellers
F&O Segment Stock
The stock fell almost 50% from its high of about ₹783 in September 2024. But now it's finding good support, building a base, and moving inside a parallel channel. For the past year, it's been stuck in a range—which usually means a bigger move is getting ready (could be a channel, triangle, or some other pattern).
Here's why I'm positive about it:
It's holding strong at the channel's lower support line.
It's sitting right on key moving averages (EMA support).
There was a big jump in trading volume near the support zone, which shows real buyers stepping in.
The chart shows a few resistance levels above—these can become price targets if the stock breaks out.
For safety, keep your stop loss at the previous major low for capital protection.
Trade wisely.

RR KABEL : Breakout Soon Candidate NSE:RRKABEL
🔹 Technical View
Strong recovery from ₹900 zone
Price testing major resistance at ₹1,500–1,510
Above ₹1,510 (weekly close): Breakout → ₹1,650–1,800
Support: ₹1,380–1,400
Structure turning higher high–higher low → bullish bias
🔹 Fundamental Snapshot
Strong brand in wires & cables
Consistent growth, improving margins
Beneficiary of housing, infra & electrification demand
🔹 Outlook
Above ₹1,510: Momentum trade active
Below ₹1,380: Consolidation risk
Medium–Long term: Structurally bullish
Disclaimer:
This content is shared strictly for educational and informational purposes.
We are not SEBI-registered investment advisors or analysts.
The views expressed are personal opinions, based on publicly available data and market observations.
Please consult a SEBI-registered investment advisor before taking any investment or trading decisions. Any actions taken based on this
content are entirely at your own risk and responsibility.
Trade Secrets By Pratik

KEI : Strong Business, Breakout Loading..??NSE:KEI
🔹 Technical Analysis
Price approaching long-term falling trendline
Break & sustain above ₹4,300 → bullish breakout confirmation
Resistance: ₹4,300–4,350
Support: ₹3,790
Above ₹4,300 → ₹4,600–4,900 possible
Below ₹3,790 → consolidation / pullback risk
🔹 Fundamental Snapshot
Strong player in cables & wires
Consistent revenue & profit growth
Healthy ROE, strong execution track record
Beneficiary of power, infra & real estate capex
🔹 Future Growth Outlook
Demand tailwinds from:
Power transmission
Renewables
Infrastructure push
Capacity expansion supports long-term growth
Structurally bullish business
🔹 View
Short term: Breakout watch above ₹4,300
Medium–Long term: Bullish on dips
Risk: Failure near trendline → range-bound move
==============
⚠️ Disclaimer:
==============
This content is shared strictly for educational and informational purposes.
We are not SEBI-registered investment advisors or analysts.
The views expressed are personal opinions, based on publicly available data and market observations.
Please consult a SEBI-registered investment advisor before taking any investment or trading decisions.
Any actions taken based on this content are entirely at your own risk and responsibility.
========================
Trade Secrets By Pratik
========================

NIFTY Intraday Trade Setup For 22 Dec 2025NIFTY Intraday Trade Setup For 22 Dec 2025
NIFTY has closed on a positive note last day. Consecutive 4 pinbars have formed in weekly TF. A good consolidation near ATH. Now we have zones marked for the next leg of move. 26400 and 25700 are key levels for any directional move either side. It is simply sideways inside this range.
Above 25060 index will be bullish in intraday and 25890 is the downside gateway. Plan trades on 15 Min candle close on intraday levels.
26250 and 25800 zone will be intraday resistance and support respectively.
I am Not SEBI Registered
This is my personal analysis for my personal trading. Kindly consult your financial advisor before taking any actions based on this.

Nifty 50 spot 25966.40 by Daily Chart view - Weekly UpdateNifty 50 spot 25966.40 by Daily Chart view - Weekly Update
- Nifty has closed within Support Zone range upper end
- Support Zone remains steady at 25710 to 26010 for Nifty Index
- Resistance Zone stands firmly at 26200 to ATH 26325.80 for Nifty Index
- Volumes synced closely with avg traded quantity over the entire past weeks
- Falling Resistance Trendline Breakout in a steady making process by weekly closure
