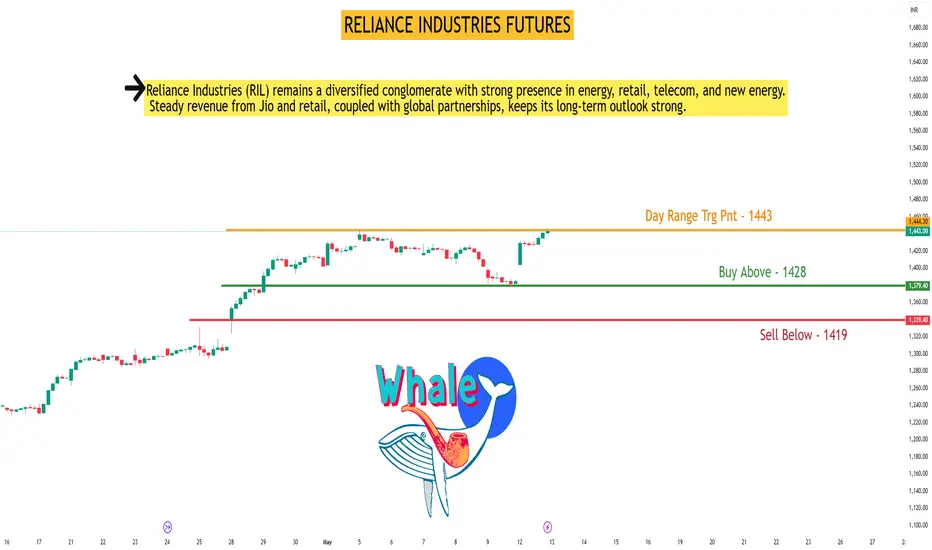
RELIANCE INDUSTRIES FUTURESRELIANCE Future Intraday Technical Analysis Date - 13-May-25 (Tuesday)
Day Range Trigger Point: 1443 | Expected Move: 41 pts
Buy Above: 1428
Average Buy Position: 1424
Target 1: 1468 |
Target 2: 1483
Stop-loss: 1415
Sell Below: 1419
Target 1: 1417 | Target 2: 1402
Stop-loss: 1432
Trading Strategy & Key Insights:
• Trade with structure confirmation and volume breakout strength. • Best Entry Timing:
✓ Before 10:30 AM or after 1:30 PM - Enter instantly on breakout.
✓ Between 10:30 AM to 1:30 PM - Prefer entries near SL zone.
? Respect stoploss & follow volume cues for validation.
NIFTY
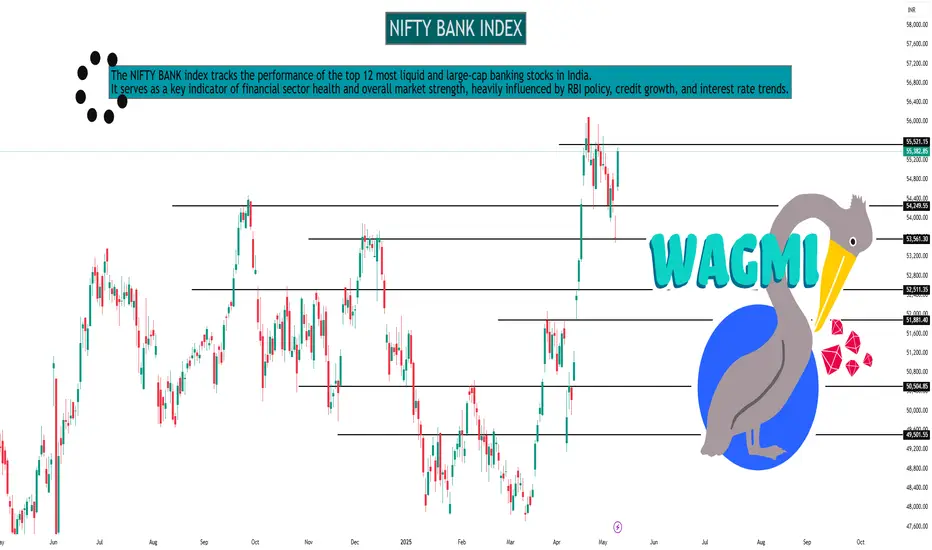
NIFTY BANK INDEXNIFTY BANK Index – 1-Day Timeframe Analysis
Technical Structure:
Trend: Bullish with minor consolidation near highs
Price Action: Sustaining above key moving averages; forming a bullish flag
Support Levels: 48,000 / 47,300
Resistance Levels: 49,500 / 50,000
Indicators:
RSI: Around 66 – healthy bullish momentum
MACD: Positive and widening – confirms upward trend
Volume: Steady on up-days; slight dip on pullbacks
Outlook:
Holding above 48,000 keeps bulls in control. A breakout above 49,500 may trigger fresh upside toward 50,500+. Watch for volatility around RBI or macro events.
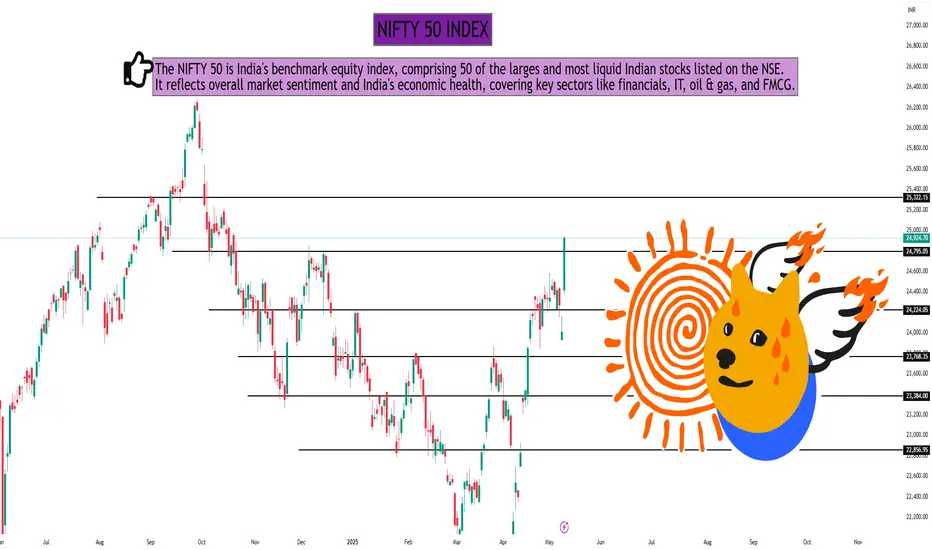
NIFTY 50 INDEX NIFTY 50 Index – 1-Day Timeframe Analysis
Technical Structure:
Trend: Uptrend intact; recent candles show strong bullish momentum.
Price Action: Forming higher highs; currently trading near resistance.
Support Levels: 22,500 / 22,200
Resistance Levels: 22,850 / 23,000
Indicators:
RSI: Around 68 – nearing overbought but still bullish
MACD: Positive crossover sustained
Volume: Rising on green candles – confirms buying interest
Outlook:
If NIFTY sustains above 22,850, a breakout toward 23,200 is likely. A rejection could lead to short-term pullback toward 22,500 support.
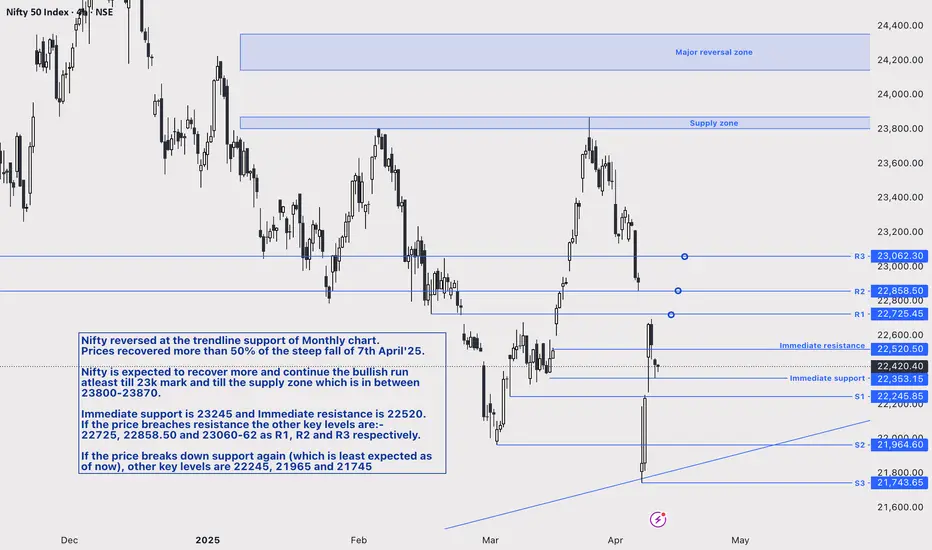
Nifty key levels for this weekNifty reversed at the trendline support of the Monthly chart.
Prices recovered over 50% of the steep fall of 7th April'25.
Nifty is expected to recover more and continue the bullish run at least until the 23k mark and until the supply zone, which is between 23800 and 23870.
Immediate support is 23245 and Immediate resistance is 22520.
If the price breaches resistance the other key levels are:-
22725, 22858.50 and 23060-62 as R1, R2 and R3 respectively.
If the price breaks down support again (which is least expected as of now), other key levels are 22245, 21965 and 21745
Prices in spot.
Nifty 50 Technical Analysis (as of May 12, 2025)Nifty 50 Technical Analysis - May 12, 2025
Current Market Overview:
Closing Price: The Nifty 50 closed at 24,924.70, up 916.70 points (+3.82%), marking its best single-day performance in four years.
Day Range: Low: 24,378.85 | High: 24,944.80
52-Week Range: Low: 21,281.45 | High: 26,277.35
Market Sentiment: The market exhibited strong bullish momentum, driven by positive global cues, including a ceasefire between India and Pakistan and optimism around US-China trade negotiations
Chart for your reference

Nifty Reversal Watch: Key Demand Zones & Moving Average in FocusAs a pure technical analyst, I rely solely on what the charts reveal, ignoring the noise of news and fundamentals. Charts tell the story in advance.
As a demand and supply zone trader, my primary focus is on identifying key areas where institutional activity is likely to drive price action. Today, we’ll analyze the Nifty 50 through the lens of demand zones and then complement it with traditional technical analysis using moving averages. This analysis aims to provide clarity on potential reversal zones and market behavior.
📊 Demand Zones: The Foundation of Analysis
Monthly & Quarterly Demand Zones : On the monthly timeframe, I’ve identified a critical demand zone. When we zoom into the quarterly timeframe, this zone aligns perfectly, creating a high-confluence area. These zones represent institutional footprints (Banks, mutual funds, etc. ), indicating where smart money is likely to step in. These are not just traditional lines or boxes on the chart; they are the footprints of institutions that control the market.
Significance of Demand Zones : Demand zones are areas where buyers are expected to dominate, often leading to price reversals. The confluence of monthly and quarterly demand zones increases the probability of a strong support level.
Current Price Action : Nifty is currently hovering near these demand zones, suggesting a potential bottom formation.
📊 Traditional Technical Analysis: Moving Averages
Now, let’s analyze the market through the lens of traditional technical analysts who rely on moving averages.
EMA 20 on Monthly Timeframe : The 20-period EMA on the monthly chart acts as a reliable support level historically. Since 2004, price reversals have consistently occurred near this moving average, marked by green circles on the chart.
EMA 20 as a Magnet : The EMA 20 on the monthly timeframe is equivalent to the 400-period EMA on the daily timeframe, representing the average price of almost 400 days. In trending markets, price always reverts to its average, making this a critical level to watch.
Historical Exceptions : While there are rare instances (marked by red circles) where Nifty has broken below the monthly EMA 20, the presence of demand zones adds an extra layer of support, reducing the likelihood of a significant breakdown.
Current Price Action : Nifty is currently near the monthly EMA 20, which coincides with the monthly and quarterly demand zones.
📊 Combining Both Approaches
High-Confluence Area : The alignment of monthly and quarterly demand zones with the monthly EMA 20 creates a high-confluence area. This increases the likelihood of a strong support level and a potential Bottom.
Risk Management : While the setup appears promising, it’s crucial to manage risk effectively. Always use strict stop-loss orders and avoid over-leveraging. Even high-probability setups can fail, especially when market sentiment is overwhelmingly negative.
📊 Conclusion
The Nifty 50 is at a critical juncture, with multiple technical indicators pointing towards a potential reversal or consolidation. The confluence of demand zones and the monthly EMA 20 provides a high-probability setup. However, always remember that no setup is foolproof, and risk management is crucial, it’s essential to remain cautious as markets can sometimes defy all technical setups.
This analysis is purely for educational purposes and is not intended as trading or investment advice. I am not a SEBI-registered analyst.
Lastly, thank you for your support.
"The market is a master of patience; trade with discipline, not emotion." 🚀📊

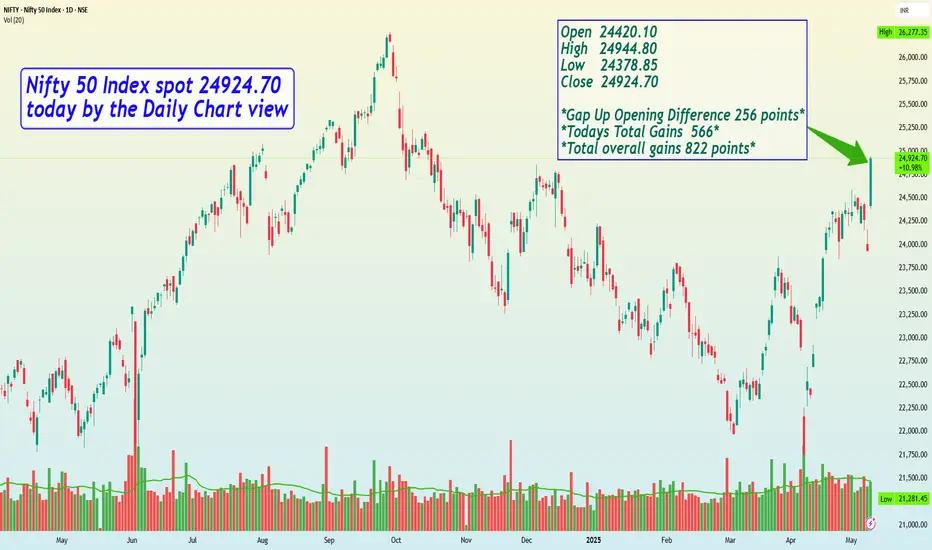
Nifty 50 Index spot 24924.70 today by the Daily Chart viewNifty 50 Index spot 24924.70 today by the Daily Chart view
Open 24420.10
High 24944.80
Low 24378.85
Close 24924.70
Gap Up Opening Difference 256 points
Todays Total Gains 565.95
Overall Total Points Gained 822 points 😃🙌🏼🤩🤝🏼😍👍🏼
* The Gap Up Opening today of 256 points will need to be closed sooner or later on for it might act as a vacuum created space to be filled in.
Support and Resistance part 2The support and resistance (S&R) are specific price points on a chart expected to attract the maximum amount of either buying or selling. The support price is a price at which one can expect more buyers than sellers. Likewise, the resistance price is a price at which one can expect more sellers than buyers.

Advanced Trading part 2Advanced trading encompasses sophisticated strategies, tools, and techniques used by experienced traders to navigate complex financial markets and potentially generate higher returns. It involves a deeper understanding of market dynamics, risk management, and technical analysis beyond the basics.

Institutional Trading StrategiesInstitutional traders, including high-frequency trading (HFT) firms, hedge funds, proprietary trading firms, and buy-side institutions, leverage sophisticated strategies powered by algorithmic trading and API automation to gain an edge in financial markets.

Instituional trading part 4Institutional trading refers to the buying and selling of securities on behalf of large organizations or institutions, like mutual funds, pension funds, and insurance companies. Unlike retail traders who trade with their personal accounts, institutional traders manage money for others, often in large volumes. They may also have access to more complex financial instruments and investment opportunities.

MACD (Moving Average Convergence Divergence) part 2MACD, short for Moving Average Convergence Divergence, is a momentum indicator used in technical analysis to identify potential trend changes in a financial market. It's calculated by comparing two exponential moving averages (EMAs) and is represented by a line, a signal line (which is a moving average of the MACD line), and optionally a histogram.

Advanced Database TradingAdvanced Database Trading refers to the use of sophisticated database technologies and techniques in the context of financial markets and trading activities. This includes using specialized databases for real-time data analysis, algorithmic trading, and risk management, as well as leveraging data mining and advanced analytical tools to identify patterns and make informed trading decisions.

Financial MarketsFinancial markets are platforms where individuals, companies, and governments trade financial instruments like stocks, bonds, currencies, and derivatives. These markets facilitate the flow of capital, enabling businesses to raise funds, individuals to invest, and governments to manage their finances.

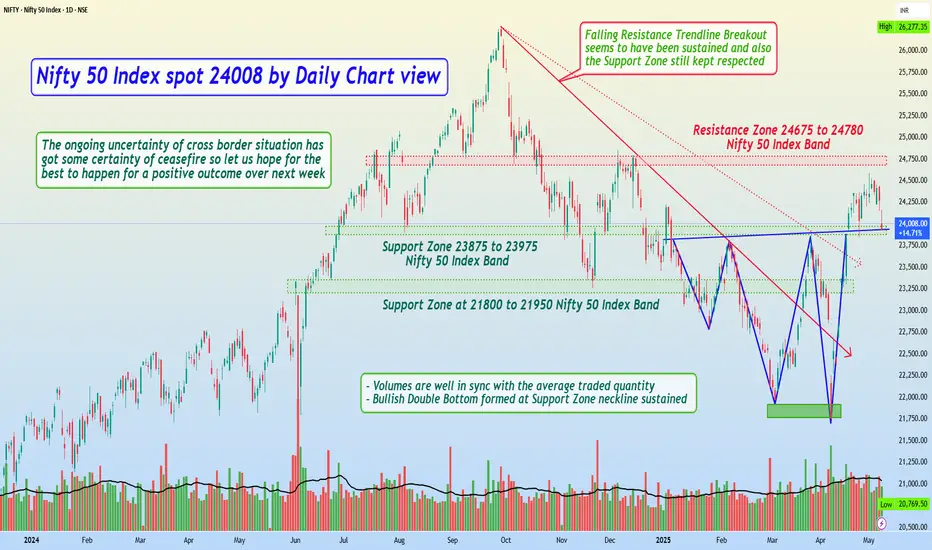
Nifty 50 Index spot 24008 by Daily Chart viewNifty 50 Index spot 24008 by Daily Chart view
- Resistance Zone 24675 to 24780 Nifty 50 Index Band
- Nifty is at Support Zone 23875 to 23975 Nifty 50 Index Band
- *Nifty having sustained above the Support Zone is bound to a bounce back by the cross border mellowed down situation*
- *The ongoing uncertainty of cross border situation has got some certainty of ceasefire so let us hope for the best to happen for a positive outcome over next week*
MACD ( Moving Average Convergence Divergence)MACD, or Moving Average Convergence Divergence, is a momentum indicator used in technical analysis to identify changes in the strength, direction, and duration of a trend. It's calculated by finding the difference between two exponential moving averages (EMAs), typically a 12-period and a 26-period EMA.

Option and Database Trading Options data providers collect specific data points that can later be used to determine price movements over time. These price changes in the stock market help investors and brokers decide which stocks might be ideal to sell or buy given current market conditions.

Institutional Trading part 5Institutional traders are defined as traders who engage in the buying and selling of securities for the accounts that they manage for any institution or a group of people. Some of the most common examples of institutional traders are mutual funds, pension funds, insurance companies, and exchange-traded funds. These institutional traders are capable of investing in securities that are generally not available for retail traders. These securities include both swaps and forwards

Institutional Trading part 4Institutional trading consists of the purchase and sale of financial assets by institutions through their traders. This definition of institutional trading applies to institutional equity trading, institutional stock trading, institutional options trading - any subcategory.

Divergence SecretsIn trading, divergence occurs when the price action of an asset moves in the opposite direction to what a technical indicator, such as a momentum oscillator, indicates. This discrepancy can signal a potential change in trend momentum or a possible reversal of the existing trend.

Institutional TradingInstitutional trading involves the buying and selling of financial assets, like stocks and bonds, by large financial institutions. These institutions, such as hedge funds, mutual funds, and pension funds, manage money on behalf of others and trade in significant volumes, potentially influencing market prices. They often require specialized services and technology to execute large trades.

Technical Trading AnalysisTechnical trading is a broader style that is not necessarily limited to trading. Generally, a technician uses historical patterns of trading data to predict what might happen to stocks in the future. This is the same method practiced by economists and meteorologists: looking to the past for insight into the future.

Divergence AnalysisDivergence in technical analysis occurs when the price of an asset moves in the opposite direction of a related technical indicator or oscillator. It signals that the momentum underlying the price trend is changing, which may foreshadow a potential shift in the trend's direction.
