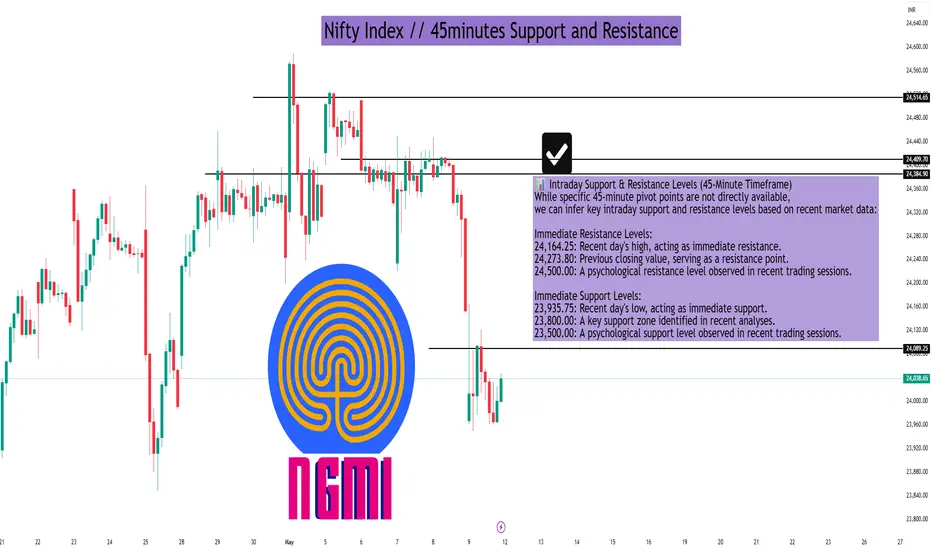
Nifty Index // 45minutes Support and ResistanceAs of the market close on May 9, 2025, the Nifty 50 index stood at 24,008.00, marking a decline of 265.80 points (-1.10%) for the day.
📊 Intraday Support & Resistance Levels (45-Minute Timeframe)
While specific 45-minute pivot points are not directly available, we can infer key intraday support and resistance levels based on recent market data:
Immediate Resistance Levels:
24,164.25: Recent day's high, acting as immediate resistance.
24,273.80: Previous closing value, serving as a resistance point.
24,500.00: A psychological resistance level observed in recent trading sessions.
Immediate Support Levels:
23,935.75: Recent day's low, acting as immediate support.
23,800.00: A key support zone identified in recent analyses.
23,500.00: A psychological support level observed in recent trading sessions.
🔍 Technical Indicators Summary
As per the latest technical analysis:
Relative Strength Index (RSI): 30.201 – Indicates a bearish condition.
Stochastic Oscillator (9,6): 97.279 – Suggests an overbought condition.
MACD (12,26): -105.46 – Indicates a bearish signal.
Average Directional Index (ADX): 47.759 – Suggests a strong trend.
Commodity Channel Index (CCI): -86.2237 – Indicates a bearish condition.
These indicators collectively suggest a bearish outlook for the Nifty 50 index in the short term.
📈 Trading Insights
Resistance Zone: The index faces resistance around the 24,164.25 to 24,273.80 range. A break above this zone could signal bullish momentum.
Support Zone: Support is observed around the 23,935.75 to 23,800.00 range. A breach below this zone may indicate further downside potential.
NIFTY
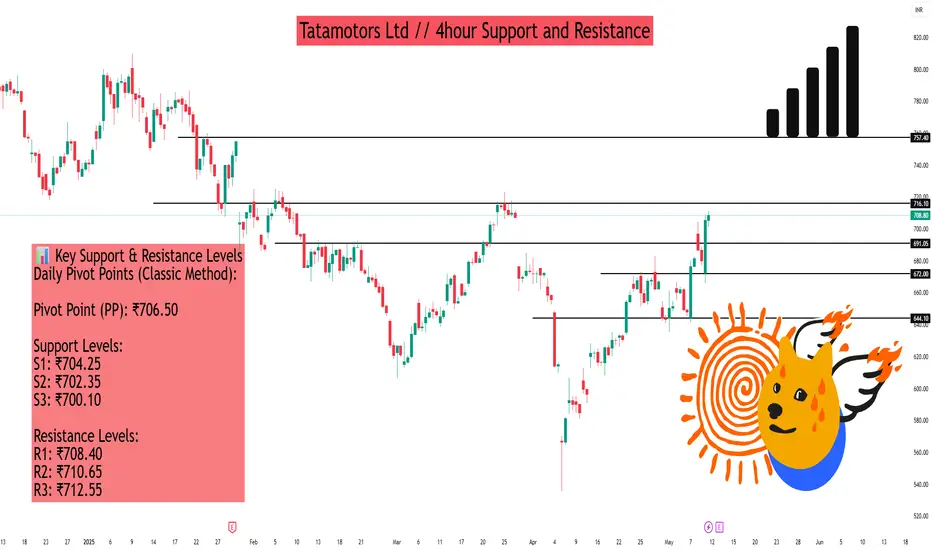
Tatamotors Ltd // 4hour Support and ResistanceAs of May 9, 2025, Tata Motors Ltd. (NSE: TATAMOTORS) closed at ₹736.10. While specific 4-hour support and resistance levels are not directly available, we can infer key levels based on daily and weekly pivot points, which are often utilized by traders for short-term analysis.
📊 Key Support & Resistance Levels
Daily Pivot Points (Classic Method):
Pivot Point (PP): ₹706.50
Support Levels:
S1: ₹704.25
S2: ₹702.35
S3: ₹700.10
Resistance Levels:
R1: ₹708.40
R2: ₹710.65
R3: ₹712.55
Weekly Pivot Points (Classic Method):
Pivot Point (PP): ₹732.62
Support Levels:
S1: ₹686.88
S2: ₹662.77
S3: ₹617.03
Resistance Levels:
R1: ₹756.73
R2: ₹802.47
🔍 Observations
The current price of ₹736.10 is above the daily pivot point, suggesting a bullish short-term trend.
Immediate resistance is observed near ₹740.17 (Daily R2), while support is around ₹724.33
On a weekly scale, the stock is trading near the pivot point of ₹732.62, indicating potential consolidation.
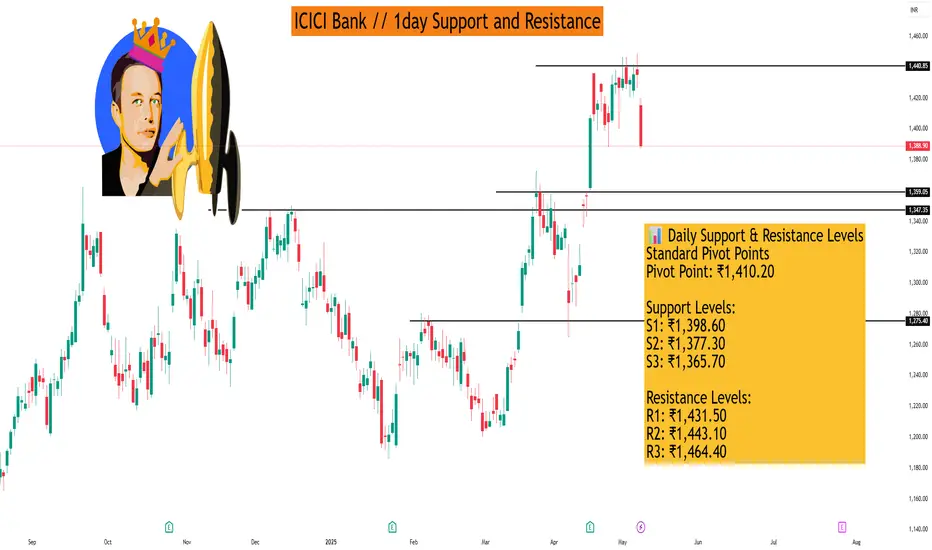
ICICI Bank // 1day Support and ResistanceAs of May 9, 2025, ICICI Bank Ltd. (NSE: ICICIBANK) closed at ₹1,388.90. Here are the key daily support and resistance levels based on various technical analyses:
📊 Daily Support & Resistance Levels
Standard Pivot Points
Pivot Point: ₹1,410.20
Support Levels:
S1: ₹1,398.60
S2: ₹1,377.30
S3: ₹1,365.70
Resistance Levels:
R1: ₹1,431.50
R2: ₹1,443.10
R3: ₹1,464.40
Fibonacci Levels
Pivot Point: ₹1,398.60
Support Levels:
S1: ₹1,386.03
S2: ₹1,378.27
S3: ₹1,365.70
Resistance Levels:
R1: ₹1,411.17
R2: ₹1,418.93
R3: ₹1,431.50
Camarilla Levels
Support Levels:
S1: ₹1,382.87
S2: ₹1,379.85
S3: ₹1,370.81
Resistance Levels:
R1: ₹1,394.93
R2: ₹1,397.95
R3: ₹1,407.00
Woodie's Levels
Pivot Point: ₹1,405.35
Support Levels:
S1: ₹1,396.18
S2: ₹1,372.45
Resistance Levels:
R1: ₹1,429.08
R2: ₹1,438.25
Demark Levels
Support Level:
S1: ₹1,371.50
Resistance Level:
R1: ₹1,404.40
🔍 Observations
The stock is currently trading below the Standard Pivot Point of ₹1,410.20, indicating potential bearish sentiment.
Immediate support is observed around ₹1,398.60 (Standard S1) and ₹1,386.03 (Fibonacci S1).
Resistance levels to watch include ₹1,411.17 (Fibonacci R1) and ₹1,431.50 (Standard R1).
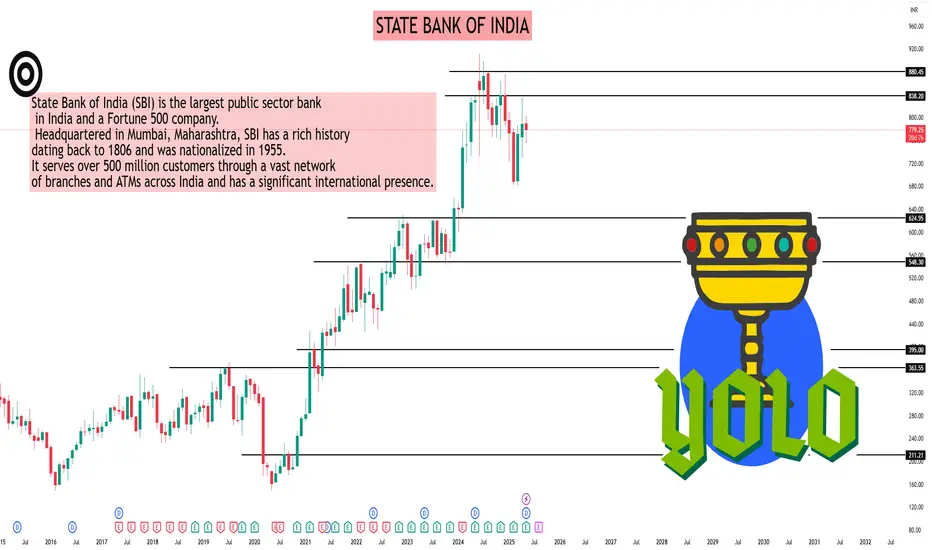
STATE BANK OF INDIAAs of May 9, 2025, State Bank of India (NSE: SBIN) closed at ₹779.25. Based on various technical analyses, here are the key monthly support and resistance levels for SBIN:
📊 Monthly Support & Resistance Levels (May 2025)
Standard Pivot Points
Pivot Point: ₹839.43
Support Levels:
S1: ₹784.72
S2: ₹733.93
S3: ₹679.22
Resistance Levels:
R1: ₹890.22
R2: ₹944.93
Fibonacci Levels
Pivot Point: ₹784.72
Support Levels:
S1: ₹744.42
S2: ₹719.52
S3: ₹679.22
Resistance Levels:
R1: ₹825.02
R2: ₹849.92
R3: ₹890.22
Camarilla Levels
Pivot Point: ₹784.72
Support Levels:
S1: ₹778.98
S2: ₹769.31
S3: ₹759.64
Resistance Levels:
R1: ₹798.32
R2: ₹807.99
R3: ₹817.66
Woodie's Levels
Pivot Point: ₹785.70
Support Levels:
S1: ₹735.90
S2: ₹680.20
Resistance Levels:
R1: ₹841.40
R2: ₹891.2
Demark Levels
Support Level:
S1: ₹759.33
Resistance Level:
R1: ₹864.83
🔍 Observations
The stock is currently trading near the Camarilla S1 level of ₹778.98, indicating potential support.
The Fibonacci Pivot Point at ₹784.72 may act as a resistance if the stock attempts to move upward.
Key support levels to monitor include ₹733.93 (Standard S2) and ₹719.52 (Fibonacci S2).
Resistance levels to watch are ₹825.02 (Fibonacci R1) and ₹841.40 (Woodie's R1).
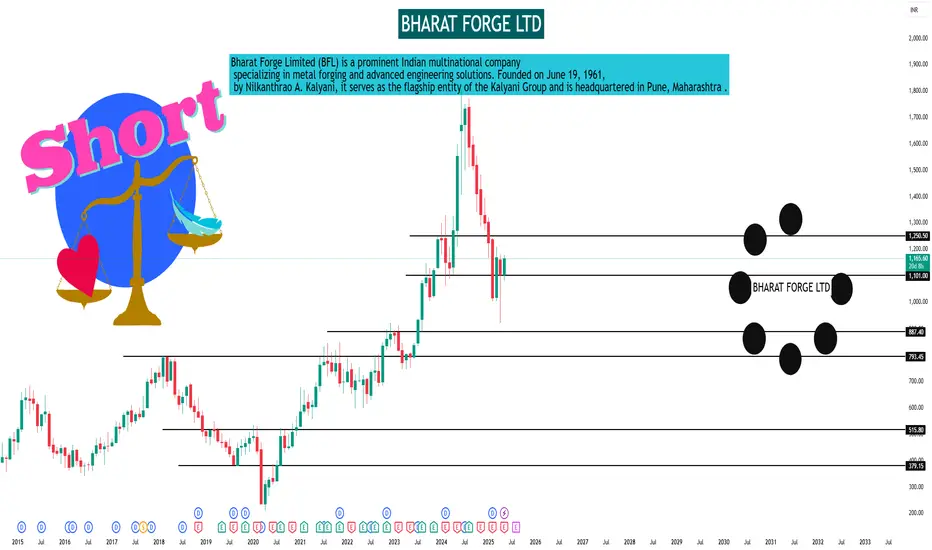
BHARAT FORGE LTDAs of May 9, 2025, Bharat Forge Ltd. (NSE: BHARATFORG) closed at ₹1,165.60. Below are the key monthly support and resistance levels based on various technical analyses:
📊 Monthly Support & Resistance Levels
Standard Pivot Points
Pivot Point: ₹1,215.77
Support Levels:
S1: ₹1,067.43
S2: ₹955.87
S3: ₹807.53
Resistance Levels:
R1: ₹1,327.33
R2: ₹1,475.67
Fibonacci Levels
Pivot Point: ₹1,067.43
Support Levels:
S1: ₹968.15
S2: ₹906.82
S3: ₹807.53
Resistance Levels:
R1: ₹1,166.72
R2: ₹1,228.05
R3: ₹1,327.33
Camarilla Levels
Pivot Point: ₹1,067.43
Support Levels:
S1: ₹1,080.38
S2: ₹1,056.55
S3: ₹1,032.73
Resistance Levels:
R1: ₹1,128.02
R2: ₹1,151.85
R3: ₹1,175.67
Woodie's Levels
Pivot Point: ₹1,076.62
Support Levels:
S1: ₹974.25
S2: ₹816.72
Resistance Levels:
R1: ₹1,234.15
R2: ₹1,336.52
Demark Levels
Pivot Point: ₹1,141.60
Support Level:
S1: ₹881.70
🔍 Observations
The stock is currently trading near the Fibonacci R1 level of ₹1,166.72, indicating potential resistance.
The Camarilla R2 level at ₹1,151.85 has recently been surpassed, suggesting bullish momentum.
Key support levels to monitor include ₹1,067.43 (Standard S1) and ₹1,056.55 (Camarilla S2).
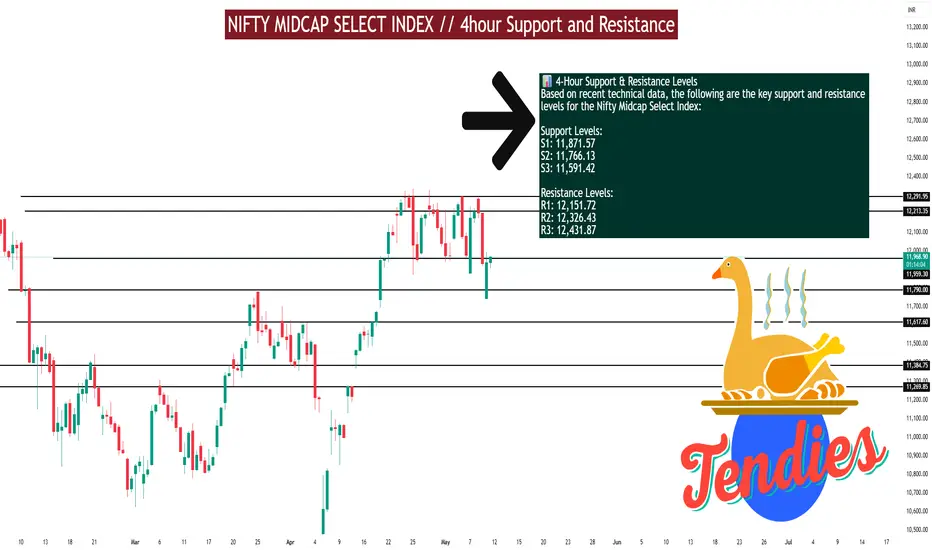
Nifty Midcap Select IndexAs of May 9, 2025, the Nifty Midcap Select Index is exhibiting a mildly bullish trend on the 4-hour timeframe, supported by various technical indicators and pivot point analyses.
📊 4-Hour Support & Resistance Levels
Based on recent technical data, the following are the key support and resistance levels for the Nifty Midcap Select Index:
Support Levels:
S1: 11,871.57
S2: 11,766.13
S3: 11,591.42
Resistance Levels:
R1: 12,151.72
R2: 12,326.43
R3: 12,431.87
🔍 Technical Indicators (4-Hour Timeframe)
Relative Strength Index (RSI): 74.96 – approaching overbought territory, suggesting potential for a short-term pullback.
Moving Average Convergence Divergence (MACD): 250.27 – indicates bullish momentum.
Average Directional Index (ADX): 25.11 – signifies a strengthening trend.
Stochastic Oscillator: 96.87 – overbought condition, caution advised.
Supertrend Indicator: Positioned at 11,824.56 – currently acting as a support level.
Parabolic SAR: 11,733.42 – below the current price, reinforcing the bullish stance.
📈 Trend Analysis
The index is trading above its 5-period and 15-period simple moving averages on the 4-hour chart, indicating a mild bullish crossover. This suggests continued upward momentum in the near term.
⚠️ Trading Insights
Bullish Scenario: A sustained move above 12,151.72 could open the path toward 12,326.43 and potentially 12,431.87.
Bearish Scenario: Failure to hold above 11,871.57 may lead to a retest of 11,766.13 or even 11,591.42.
NIFTY BANK INDEX Nifty Bank Index – 15-Minute Timeframe (As of May 9, 2025)
📌 Intraday Support & Resistance (15-min Chart):
🔻 Support Levels:
53,500 – Strong intraday support; multiple bounces seen here
53,200 – Minor support from morning session
52,900 – Gap-fill zone and previous demand area
🔺 Resistance Levels:
53,850 – VWAP + supply rejection area
54,200 – Key resistance from early session high
54,500 – Major barrier; breakdown retest level
📉 Intraday View: Trend remains weak below 54,200; bulls need a reclaim above 54,500 for momentum. Short-term scalpers should watch price action around VWAP (near 53,850).

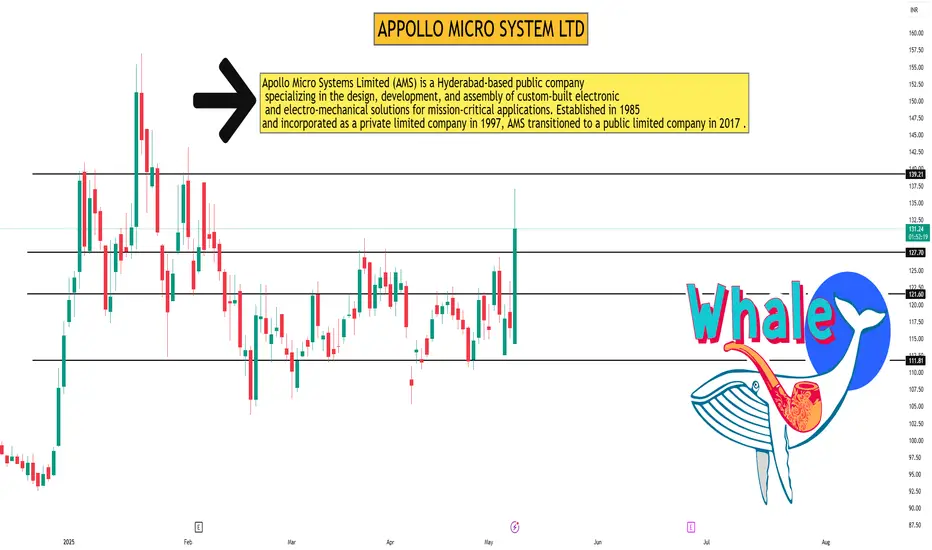
APPOLLO MICRO SYSTEM LTD Apollo Micro Systems Ltd – 1D Timeframe (As of May 9, 2025)
📌 Support & Resistance Levels (1-Day Chart Analysis):
Resistance Levels:
₹137.00 – Intraday high; strong near-term resistance
₹145.00 – Previous swing high and psychological level
₹157.00 – 52-week high, major resistance zone
Support Levels:
₹127.00 – VWAP zone; near-term intraday support
₹120.00 – Recent consolidation zone and demand area
₹114.30 – Today’s opening and previous base; key downside support
🔍 Technical Note: RSI is nearing overbought territory; price may consolidate below ₹137 unless a breakout is confirmed on high volume.
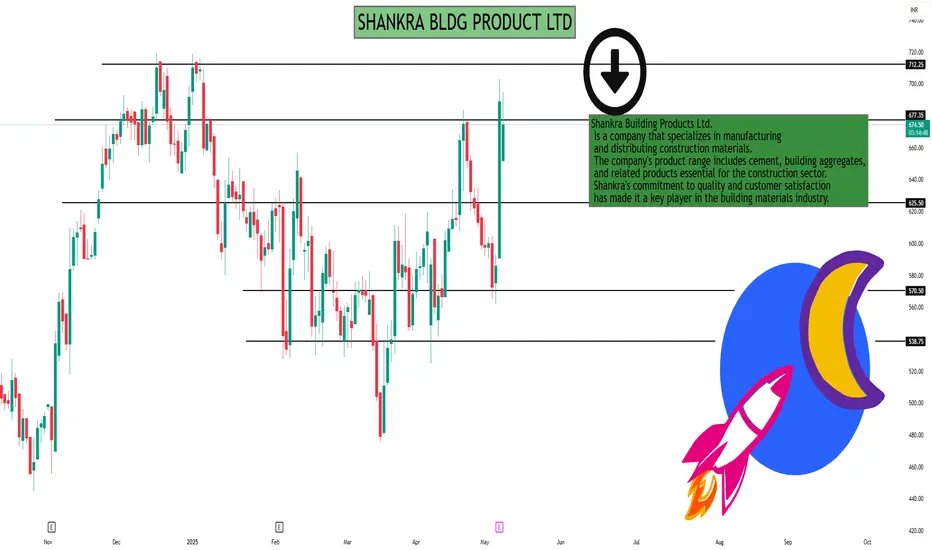
SHANKRA BLDG PRODUCT LTDAs of May 9, 2025, Shankara Building Products Ltd. (NSE: SHANKARA) is trading at ₹689.05, reflecting a 17.62% increase over the past 24 hours .
📊 Intraday Support & Resistance Levels
Based on technical analyses, the following are the key intraday support and resistance levels for SHANKARA:
Standard Pivot Points:
Support Levels:
S1: ₹647.02
S2: ₹625.53
S3: ₹586.52
Resistance Levels:
R1: ₹707.52
R2: ₹746.53
R3: ₹768.02
Pivot Point: ₹686.03
Camarilla Pivot Points:
Support Levels:
S1: ₹659.00
S2: ₹653.46
S3: ₹647.91
Resistance Levels:
R1: ₹670.10
R2: ₹675.64
R3: ₹681.19
Pivot Point: ₹647.02
+2
Fibonacci Pivot Points:
Support Levels:
S1: ₹647.02
S2: ₹623.91
S3: ₹609.63
Resistance Levels:
R1: ₹670.13
R2: ₹684.41
R3: ₹707.52
Pivot Point: ₹647.02
🔍 Technical Indicators
Moving Averages (MA): The stock is currently trading above its short-term moving averages, indicating a bullish trend.
Relative Strength Index (RSI): The RSI is in the overbought zone, suggesting that the stock may be overvalued in the short term.
MACD: The MACD line is above the signal line, reinforcing the bullish momentum.
📈 Trading Insights
Given the current price of ₹689.05, the stock is trading near its R1 resistance level of ₹707.52. Traders should monitor for a breakout above this level for potential upward movement. Conversely, if the stock retraces, the S1 support level at ₹647.02 may provide a buying opportunity.
MACD Trading ( Moving Average Convergence/Divergence) The Moving Average Convergence/Divergence indicator is a momentum oscillator primarily used to trade trends. Although it is an oscillator, it is not typically used to identify over bought or oversold conditions. It appears on the chart as two lines which oscillate without boundaries.

How to Trade ? (Basic to Advance)Open a Demat account. The first step is to open a Demat account, which serves as a digital repository for your stocks. ...
Understand stock terms. ...
Bids and asks. ...
Fundamental and technical knowledge of stocks. ...
Learn to set stop loss orders. ...
Seek expert advice. ...
Start with safer stocks.

Institution Trading part 5Institutional trading involves buying and selling financial assets on behalf of institutions, such as big funds or investment banks. These large companies have dedicated teams consisting of analysts and traders who work together to make optimal trades.

Institution TradingInstitutional trading refers to the buying and selling of financial assets by large organizations, like financial institutions, on behalf of their clients or members. These institutions manage large pools of capital and can significantly impact market prices and trends due to their size and trading volume. Unlike retail traders, institutional traders often have access to a wider range of investment opportunities and strategies.

Option Trading Options trading gives you the right or obligation to buy or sell a specific security on or by a specific date at a specific price. An option is a contract that's linked to an underlying asset, such as a stock or another security.

Advanced Trading part 2Advanced trading strategies usually involve multiple technical indicators and more complicated instruments, such as options and futures

Advanced Trading part 1Advanced trading encompasses a range of sophisticated techniques, strategies, and tools used by experienced traders to make informed decisions, manage risk, and capitalize on market opportunities. It involves a deeper understanding of market dynamics, technical analysis, and risk management principles, often utilizing complex instruments like options and futures.

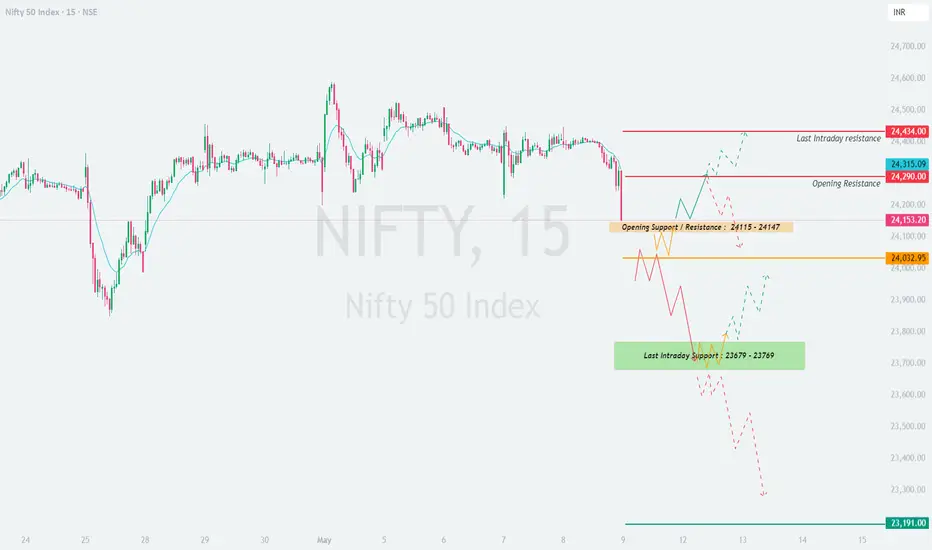
NIFTY : Trading Levels and Plan for 09-may-2025📊 Nifty Trading Plan for 09-May-2025
Timeframe: 15-Min | Previous Close (Approx.): 24,153.20
🔎 Key Technical Levels to Watch:
🔴 Opening Resistance: 24,290
🟧 Opening Support / Pivot Zone: 24,115 – 24,147
🟩 Immediate Support Zone: 24,000 – 24,032
🟦 Last Intraday Support Zone: 23,679 – 23,769
🟢 Major Support Level (Further Down): 23,191
📌 Sideways Resistance Zone (Higher Resistance): 24,434 – 24,480
🟢 1. Gap-Up Opening (📈 Opening above 24,253 — Gap of 100+ Points)
If Nifty opens significantly above 24,253, it will likely be challenging the Opening Resistance level of 24,290 from the start. A gap of this nature indicates strong initial buying interest.
✅ Plan of Action:
- If Nifty opens and sustains above 24,290, the initial move might extend towards the Sideways Resistance Zone (Higher Resistance) of 24,434 – 24,480.
- Educational Insight: When a gap up occurs directly into a resistance level (like 24,290), it's crucial to observe the first 15-30 minutes. Look for either:
- Continuation: Strong bullish candles breaking above 24,290 with good volume, confirming buyer strength. In this case, longs can be considered with a stop-loss below the opening range low, targeting 24,434.
- Rejection: If Nifty struggles at 24,290 or shows signs of weakness (e.g., long upper wicks, bearish engulfing patterns on the 15-min chart), it could be a sign of profit-booking or sellers stepping in. Shorts could be initiated below 24,250 (confirming the gap fill has started) for targets of 24,147 and then the Immediate Support Zone of 24,000 – 24,032.
- Avoid chasing the gap immediately. Wait for price to settle and provide a clear signal. A retest of the breakout level (24,290 if breached) from above would offer a better risk-reward entry for longs.
🟡 2. Flat Opening (🔄 Between 24,053 – 24,253)
A flat opening, likely within the range of the Opening Support / Pivot Zone (24,115 – 24,147) and the Opening Resistance (24,290), suggests initial indecision. The previous close of ~24,153 falls into this scenario.
✅ Plan of Action:
- The zone of 24,115 – 24,147 will be key.
- Bullish View: If Nifty holds above 24,147 and shows strength, longs can be initiated for a target of the Opening Resistance at 24,290. A convincing break above 24,290 could then target the Sideways Resistance Zone of 24,434 – 24,480.
- Bearish View: If Nifty breaks below 24,115 and sustains, it would indicate weakness. Shorts can be considered with targets at the Immediate Support Zone of 24,000 – 24,032.
- Educational Insight: Flat openings often lead to range-bound behavior initially. It's wise to wait for a breakout from the first 30-60 minutes range. Trading within the range can be risky unless clear support/resistance flips are observed on smaller timeframes. The direction of the break from this initial balance will likely set the tone for a significant portion of the session.
🔴 3. Gap-Down Opening (📉 Opening below 24,053 — Gap of 100+ Points)
A gap-down opening below 24,053 would mean Nifty is opening near or below the Immediate Support Zone of 24,000 – 24,032. This indicates significant selling pressure from the outset.
✅ Plan of Action:
- If Nifty opens below 24,032, watch how it reacts to this level.
- Potential Reversal: If the market finds support around 24,000 – 24,032 (e.g., forms a hammer, bullish engulfing, or double bottom on the 15-min chart), a bounce-back towards the gap-fill (towards 24,115 – 24,147) can be anticipated. Longs can be taken with strict stop-loss below the day's low.
- Continuation of Selling: If Nifty decisively breaks below 24,000 and sustains, further selling pressure can drag it towards the Last Intraday Support Zone of 23,679 – 23,769. In this case, short positions can be considered on a pullback to the breakdown level (around 24,000) or on continuation patterns.
- Educational Insight: Large gap downs can sometimes lead to sharp, short-covering rallies if they land in a strong support area. However, it's crucial not to try and "catch a falling knife." Wait for the price to stabilize and show signs of reversal (like a clear basing pattern or bullish candle formations) before considering long trades. If selling momentum is strong, attempting to go long too early can lead to quick losses.
💡 Risk Management Tips for Options Trading:
📏 Position Sizing is Key: Never allocate more than a small percentage of your trading capital (e.g., 1-2%) to a single trade. This helps in surviving drawdowns.
🎯 Define Stop-Loss Before Entry: For option buyers, this could be a percentage of premium (e.g., 20-30%) or based on the underlying spot Nifty level. For sellers, define the maximum acceptable loss or the spot level at which you'll exit.
⏳ Be Mindful of Time Decay (Theta): Especially when buying options, time decay accelerates as expiry approaches. Avoid holding onto losing OTM (Out-of-the-Money) options for too long, hoping for a turnaround.
🛡️ Consider Hedging for Volatility: If volatility is expected to be high or if you are unsure of the direction, consider strategies like spreads (bull call spread, bear put spread) or iron condors to limit risk.
💨 Don't Fight Strong Momentum: If the market is trending strongly, trading against the trend (e.g., buying puts in a strong uptrend) is generally a lower probability trade for option buyers unless a clear reversal is confirmed.
📖 Understand Option Greeks: A basic understanding of Delta, Gamma, Theta, and Vega can significantly improve your decision-making in options trading.
📌 Summary & Conclusion:
Nifty stands at a point where the immediate direction will be heavily influenced by the opening. The pivot zone around 24,115 – 24,147 is crucial for flat openings.
For Gap-Up openings , the ability to conquer and hold above 24,290 will be tested, with 24,434 – 24,480 as the next target. Failure could lead to a gap fill.
For Flat opens , range-bound action between 24,032 and 24,290 is possible initially. A breakout from this range will offer clearer directional cues.
For Gap-Downs , the 24,000 – 24,032 support zone is critical. A hold could offer a bounce, while a break could accelerate selling towards 23,679 – 23,769.
Always prioritize setups that offer good risk-reward ratios, wait for confirmation, and manage your risk diligently.
📢 Disclaimer:
I am not a SEBI-registered analyst. The above trading plan is intended purely for educational and informational purposes. It is based on technical analysis of the provided chart and should not be construed as financial advice. Trading in the stock market involves significant risk, and you may lose money. Please consult with your financial advisor before making any trading or investment decisions.
Institutional Trading part 4Institutional traders buy and sell securities for accounts they manage for a group or institution. Retail traders buy or sell securities for personal accounts. Institutional traders usually trade larger sizes and can trade more exotic products.

Management and PsychologyMarket psychology is the study of herd behavior and sentiment among economic actors, such as businesses, traders, or consumers. By studying the prevalence of greed, fear, or euphoria in the market, skilled traders can forecast future price movements and fluctuations in supply and demand.

Divergence Based TradingDivergence occurs when the stochastic oscillator's peaks or troughs disagree with the price. For instance, if the stochastic makes lower highs while the price is rising, it indicates a bearish divergence. Likewise, higher stochastic lows against lower price lows indicate a bullish divergence.

Support and Resistance'Support' and 'resistance' are terms for two respective levels on a price chart that appear to limit the market's range of movement. The support level is where the price regularly stops falling and bounces back up, while the resistance level is where the price normally stops rising and dips back down.

Support and ResistanceSupport is a price point below the current market price that indicate buying interest. Resistance is a price point above the current market price that indicate selling interest.
