Candlesticks Pattern part 1Candlestick patterns are visual representations of price movements within a specific timeframe, used in technical analysis to identify potential future price movements. Each candlestick represents a period's opening, high, low, and closing prices, and their combinations form patterns that can signal trend changes or potential continuations.
NIFTY

Option Trading AnalysisRelative Strength Index (RSI) The relative strength index (RSI) is one of the most commonly used indicators. ...
Bollinger Bands. ...
Intraday Momentum Index (IMI) ...
Money Flow Index (MFI) ...
Put-Call Ratio (PCR) Indicator. ...
Open Interest (OI)

Institution Trading part 4Institutional trading consists of the purchase and sale of financial assets by institutions through their traders. This definition of institutional trading applies to institutional equity trading, institutional stock trading, institutional options trading - any subcategory.

Institutional TradingInstitutional trade refers to the buying and selling of financial assets by large financial institutions, such as hedge funds, mutual funds, and pension funds. These institutions often manage significant amounts of capital and make trades on behalf of their clients or members. They typically engage in large-scale transactions and require specialized tools and services.

Advanced Trading part 2In business, "trade advance" or "trade credit" generally refers to a short-term, interest-free loan provided by a supplier to a business, allowing the buyer to defer payment for goods or services. It's essentially an arrangement where a supplier allows a buyer to purchase goods on credit, with payment due at a later date, typically within 30 to 90 days.

Advanced TradingAdvanced trading strategies usually involve multiple technical indicators and more complicated instruments, such as options and futures.

$NSE:NIFTY - Analysis For Tomorrow!🚨 Nifty 50 Breakout Incoming? | Symmetrical Triangle on 15-min Chart.
NSE:NIFTY is consolidating within a symmetrical triangle pattern on the 15-minute chart — a classic setup that often leads to a strong breakout or breakdown.
📊 Chart Setup:
Pattern: Symmetrical Triangle (Neutral)
Price Action: Compressing between rising support & falling resistance
View : Price nearing the tip — breakout imminent
✅ Bullish Scenario:
Breakout above 24,541
Targets: 24,666 → 24,737
✅ Watch for volume confirmation and follow-through candles
❌ Bearish Scenario:
Breakdown below 24,383
Targets: 24,186 → 24,041
❗ Confirm with a breakdown candle + failed retest
🔑 Key Support & Resistance:
Resistance: 24,541 | 24,666 | 24,737
Support: 24,383 | 24,186 | 24,041
📌 Note: Symmetrical triangles are neutral patterns. Wait for a confirmed breakout/breakdown with strong volume before entering a trade.

Meaning of RSI (Relative Strength Index)RSI stands for Relative Strength Index, a technical indicator used in financial markets to measure the momentum of an asset's price. It helps traders identify potential overbought or oversold conditions by analyzing recent price gains and losses.

Learn institution TradingProspective institutional traders are generally expected to possess, at a minimum, a bachelor's degree in finance, economics, business, or accounting. However, a master's degree or specialized certifications can enhance one's prospects even further.

Institution Trading StrategiesThis strategy involves taking advantage of price discrepancies between two or more markets or instruments. For example, an institution may buy a stock on one exchange where it is undervalued and simultaneously sell it on another exchange where it is overvalued, profiting from the difference.

Support and Resistance part 2Support occurs at the point where a downtrend is expected to pause due to a concentration of demand. Resistance occurs at the point where an uptrend is expected to pause due to a concentration of supply. Support and resistance areas can be identified on charts using trendlines and moving averages.

How to gwt success ?To achieve success, define your goals, cultivate a growth mindset, and prioritize your health. Build strong relationships, embrace continuous learning, and be adaptable. Celebrate your achievements, seek feedback, and stay committed to your long-term goals.
Elaboration:

INDUSIND Bank // 1month Support and ResistanceAs of May 5, 2025, here are the key 1-Month Support and Resistance levels for IndusInd Bank Ltd. (NSE: INDUSINDBK) based on recent technical analyses:
📊 Monthly Support and Resistance Levels
Level Value (₹)
S3 809.77
S2 888.08
S1 941.97
Pivot 1,015.58
R1 1,074.17
R2 1,152.48
R3 1,206.37
These levels are derived from the previous month's price range and are commonly used to identify potential reversal points in the market.
📈 Technical Indicators
Relative Strength Index (RSI): 44 (Neutral)
Moving Average Convergence Divergence (MACD): 5.16 (Sell)
Average Directional Index (ADX): 25.44 (Weak Trend)
Commodity Channel Index (CCI): -61.09 (Downtrend)
Money Flow Index (MFI): 26.16 (Strong Downtrend)
These indicators suggest a neutral to slightly bearish momentum, indicating potential downward movement if selling pressure increases.
📌 Summary
Immediate Support: ₹809.77
Immediate Resistance: ₹1,074.17
Medium-Term Outlook: Neutral to slightly bearish, with mixed signals from moving averages and momentum indicators.
Please note that technical analysis is subject to change based on market conditions. It's advisable to monitor these levels regularly and consider consulting with a financial advisor for personalized investment advice.

HDFC Bank ltd // 3hour Support and ResistanceAs of May 5, 2025, here are the key support and resistance levels for HDFC Bank Ltd. (NSE: HDFCBANK) based on the 3-hour chart:
📊 3-Hour Pivot Points
Level Value (₹)
S3 1,689.18
S2 1,701.12
S1 1,714.03
Pivot 1,725.97
R1 1,738.88
R2 1,750.82
R3 1,763.73
These levels are calculated based on the previous day's high, low, and close prices and are used to identify potential support and resistance zones.
📈 Technical Indicators
Relative Strength Index (RSI): 72.46 (Strong Uptrend)
Stochastic RSI: 0.92 (Strong Uptrend)
Commodity Channel Index (CCI): 130.18 (Strong Uptrend)
Money Flow Index (MFI): 86.61 (Strong Uptrend)
These indicators suggest a strong bullish momentum, indicating potential upward movement if buying interest continues.
📌 Summary
Immediate Support: ₹1,689.18
Immediate Resistance: ₹1,738.88
Medium-Term Outlook: Bullish, with strong momentum indicators and positive moving averages.
Please note that technical analysis is subject to change based on market conditions. It's advisable to monitor these levels regularly and consider consulting with a financial advisor for personalized investment advice.

RR KABEL LTDAs of May 5, 2025, here are the key support and resistance levels for R R Kabel Ltd. (NSE: RRKABEL) based on recent technical analyses:
📊 Classic Pivot Points (1-Day View)
Support Levels:
S3: ₹880.40
S2: ₹901.70
S1: ₹924.85
Resistance Levels:
R1: ₹969.30
R2: ₹990.60
R3: ₹1,013.75
Pivot Point: ₹946.15
These levels are derived from the price range of the previous trading day and are commonly used to identify potential reversal points in the market.
📈 Moving Averages & Indicators
Simple Moving Averages (SMA):
5-Day: ₹915.44 (Buy)
10-Day: ₹911.38 (Buy)
20-Day: ₹907.79 (Buy)
50-Day: ₹891.27 (Buy)
100-Day: ₹896.50 (Buy)
200-Day: ₹1,012.39 (Sell)
Exponential Moving Averages (EMA):
5-Day: ₹918.88 (Buy)
10-Day: ₹913.53 (Buy)
20-Day: ₹906.36 (Buy)
50-Day: ₹898.08 (Buy)
100-Day: ₹928.24 (Sell)
200-Day: ₹1,003.36 (Sell)
The alignment of these averages suggests a bullish short-term to medium-term outlook, with some indicators signaling bearish trends in the long term.
📉 RSI & Momentum Indicators
Relative Strength Index (RSI): 65.27 (Buy)
Stochastic RSI: 68.79 (Buy)
MACD: 7.38 (Buy)
Average Directional Index (ADX): 35.19 (Buy)
These indicators suggest a strong bullish momentum, indicating potential upward movement if buying interest continues.
📌 Summary
Immediate Support: ₹880.40
Immediate Resistance: ₹969.30
Medium-Term Outlook: Bullish, with strong momentum indicators and positive moving averages.

IOC LTDIOC
BUY
Entry price above: 145 Target 155/165
Stop loss 138
Time period: Swing/Positional call
After crossing 145 levels stock can show a good up move. Good reports are also there.
I am just representing my views For educational purposes only.

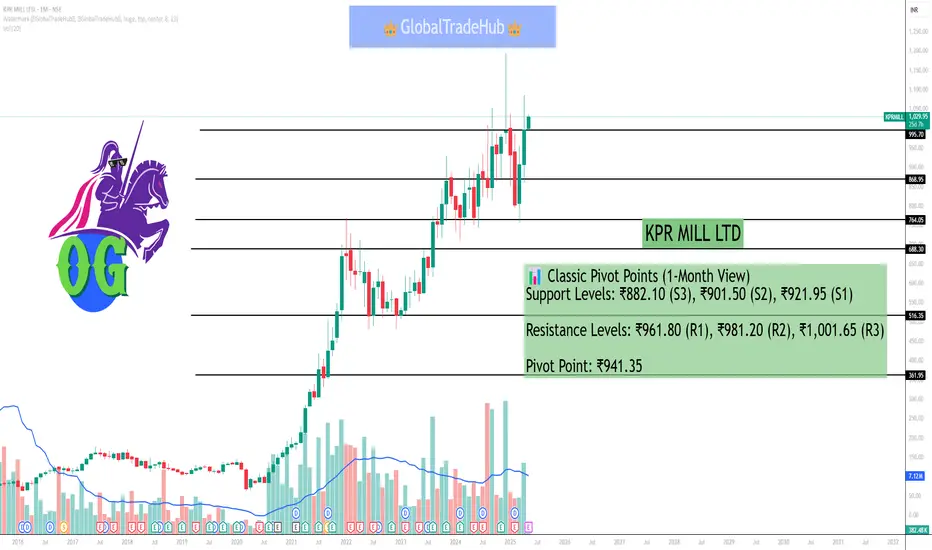
KPR MILL LTDAs of May 5, 2025, here are the key support and resistance levels for KPR Mill Ltd. (NSE: KPRMILL) based on recent technical analyses:
📊 Classic Pivot Points (1-Month View)
Support Levels: ₹882.10 (S3), ₹901.50 (S2), ₹921.95 (S1)
Resistance Levels: ₹961.80 (R1), ₹981.20 (R2), ₹1,001.65 (R3)
Pivot Point: ₹941.35
These levels are derived from the previous month's price range and are commonly used to identify potential reversal points in the market.
📈 Moving Averages & Indicators
Simple Moving Averages (SMA):
5-Day: ₹971.43
10-Day: ₹963.19
20-Day: ₹985.48
50-Day: ₹993.04
100-Day: ₹952.26
200-Day: ₹901.74
Exponential Moving Averages (EMA):
5-Day: ₹925.25 (Buy)
10-Day: ₹933.29 (Buy)
20-Day: ₹952.39 (Sell)
50-Day: ₹968.62 (Sell)
100-Day: ₹951.72 (Sell)
200-Day: ₹904.76 (Buy)
The alignment of these averages suggests a mixed short-term to medium-term outlook, with some indicators signaling bullish trends and others indicating bearish tendencies.
📉 RSI & Momentum Indicators
Relative Strength Index (RSI): 42.56 (Neutral)
Stochastic RSI: 59.15 (Buy)
MACD: 8.04 (Buy)
Average Directional Index (ADX): 32.45 (Buy
These indicators suggest a neutral to slightly bullish momentum, indicating potential upward movement if buying interest increases.
📌 Summary
Immediate Support: ₹882.10
Immediate Resistance: ₹961.80
Medium-Term Outlook: Neutral to slightly bullish, with mixed signals from moving averages and momentum indicators.
Bank NiftyBank Nifty Intraday Outlook - 1H Chart (May 05)
Price is hovering near a key support zone. A breakdown could lead to further downside, but watch for a potential bounce from the recent support area. Plan your trades wisely!!
Key Levels to Watch:
Support: 54,400-54,600
Resistance: 55,500-56,000
Stay disciplined. Trade with logic, not emotion.

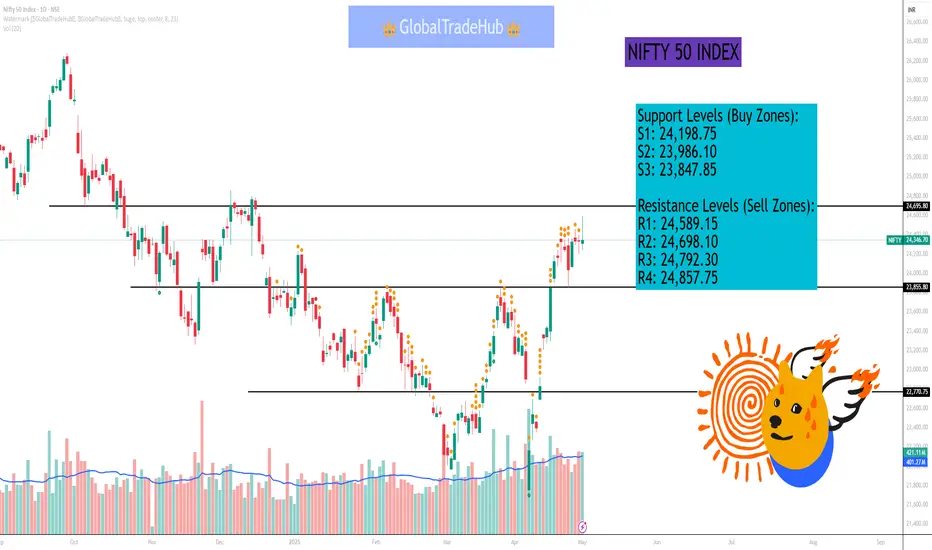
NIFTY 50 INDEXNifty 50 Intraday Levels for May 5, 2025
Previous Close (Reference Price):
24,313.65
Support Levels (Buy Zones):
S1: 24,198.75
S2: 23,986.10
S3: 23,847.85
Resistance Levels (Sell Zones):
R1: 24,589.15
R2: 24,698.10
R3: 24,792.30
R4: 24,857.75
ICICI Bank ICICI Bank (1D) Technical View
▲ Pattern Formed:
*Ascending Triangle Breakout - strong bullish continuation pattern
Intraday Buy Entry: *1,435-*1,440
Target Price: *1,465
Stop Loss: *1,422
? Breakout above multi-top resistance zone with strong volume confirmation signals momentum.
Risk-reward is favorable for intraday trade.
#ICICIBANK

Technical ConceptA "technical concept" refers to a specific idea or principle within a technical field, like engineering, computer science, or a specific industry. It's a fundamental building block that helps explain how something works, what it does, and why it's used. These concepts are often complex and require a certain level of technical understanding.

Option TradingOptions trading may seem overwhelming at first, but it’s easy to understand if you know a few key points. Investor portfolios are usually constructed with several asset classes. These may be stocks, bonds, exchange-traded funds (ETFs), and mutual funds. Options are another asset class, and when used correctly, they offer many advantages that trading stocks and ETFs alone cannot.

Meaning of Divergence In trading, divergence refers to a situation where an asset's price movement is not aligned with the movement of a technical indicator or other data point. It's a signal that the underlying momentum of an asset might be weakening and could indicate a potential trend reversal or continuation.
